

Abstract
Gene expression profiling (GEP) has stratified diffuse large B-cell lymphoma (DLBCL) into molecular subgroups that correspond to different stages of lymphocyte development - namely germinal center B-cell-like and activated B-cell-like. This classification has prognostic significance, but GEP is expensive and not readily applicable into daily practice, which has lead to immunohistochemical algorithms proposed as a surrogate for GEP analysis. We assembled tissue microarrays from 475 de novo DLBCL patients who were treated with rituximab-CHOP chemotherapy. All cases were successfully profiled by GEP on formalin-fixed, paraffin-embedded tissue samples. Sections were stained with antibodies reactive with CD10, GCET1, FOXP1, MUM1, and BCL6 and cases were classified following a rationale of sequential steps of differentiation of B-cells. Cutoffs for each marker were obtained using receiver operating characteristic curves, obviating the need for any arbitrary method. An algorithm based on the expression of CD10, FOXP1, and BCL6 was developed that had a simpler structure than other recently proposed algorithms and 92.6% concordance with GEP. In multivariate analysis, both the International Prognostic Index and our proposed algorithm were significant independent predictors of progression-free and overall survival. In conclusion, this algorithm effectively predicts prognosis of DLBCL patients matching GEP subgroups in the era of rituximab therapy.
Keywords: Diffuse large B-cell lymphoma, ABC-DLBCL, GCB-DLBCL, CD10, BCL6, FOXP1
Introduction
Diffuse large B-cell lymphoma (DLBCL), not otherwise specified, is classified by the World Health Organization (WHO) as a single disease entity on the basis of morphological and clinical criteria.1 The standard therapy for patients with DLBCL is rituximab® combined with cyclophosphamide, doxorubicin, vincristine, and prednisone (R-CHOP), and this results in a long-term disease-free survival of approximately 50%.2 Gene expression profiling (GEP), however, has identified molecularly and clinically distinct subgroups of disease within DLBCL, known as germinal-center-B-cell-like (GCB) and activated B-cell-like (ABC), and unclassified DLBCL.3,4 The DLBCL gene-expression subgroups differ by the expression of more than 1000 genes, making them at this level as different as acute lymphoid and myeloid leukemias.5 The mechanisms of malignant transformation of the two subgroups involve distinct and specific pathways, with BCL2 rearrangement and C-REL amplification seen mostly in GCB-DLBCL and constitutive activation of the NF-κB pathway characterizing ABC-DLBCL.4,6 These novel insights into the pathogenesis of the DLBCL subgroups are enabling the discovery of targets for investigational therapies.
The molecular distinction between the DLBCL subgroups is also important, because patients in these subgroups respond differently and retain a different prognosis when treated with R-CHOP.7 Patients with GCB-DLBCL have a more favorable outcome than those with ABC-DLBCL, irrespective of the International Prognostic Index (IPI) score.8 However, due to expense and technical constraints and the need for intensive bioinformative analysis, the use of GEP technology for routine clinical use is challenging. In an attempt to translate GEP classification into a manageable set of measurable proteins, several algorithms have been proposed in recent years based on immunohistochemical stains and tissue microarray technique. The original algorithm, proposed by Hans et al,9 is based on the expression of three proteins: neprilysin (CD10), B-cell lymphoma 6 (BCL6), and multiple myeloma oncogene 1/interferon regulatory factor 4 (MUM1/IRF4) and can classify DLBCL patients into two categories (GCB and non-GCB) with differing prognoses. This algorithm, however, was created for use in patients treated with CHOP without rituximab, and in addition, it had low concordance with GEP analysis (71% for GCB, 88% for non-GCB). The prognostic relevance of the Hans algorithm led to inconsistent results in subsequent studies performed in patient groups treated with R-CHOP.7,10–15
Three studies reported new staining algorithms obtained from patients treated with R-CHOP,12,15,16 two of which combined results with GEP analysis.12,16 In the first study, Choi and colleagues developed an algorithm based on the expression of five biomarkers which had a high concordance with GEP (93%). Compared with the Hans algorithm, the Choi algorithm integrated the analysis of two new molecules: forkhead box protein P1 (FOXP1) and serpin A9/germinal center expressed transcript 1 (GCET1), that allowed a better discrimination between GCB and non-GCB DLBCL. These two markers exhibited reliable staining17–19 and could further address different steps of B-cell maturation. In a second study, Meyer et al. reported an algorithm (called the “Tally” algorithm) that had a high concordance with GEP and was also based on the expression of five markers: CD10, GCET1, FOXP1, MUM1, and rhombotin-2/LIM domain only 2 (LMO2). However, based on a recent study, when these algorithms were tested for concordance with GEP and prognostic power on an independent cohort of patients, these algorithms did not correlate well with GEP results and showed poor prognostic power.20
We used five specific markers, including CD10, GCET1, FOXP1, MUM1, and BCL6 to describe consecutive stages of the differentiation of mature B-cells through the GC. We constructed an effective algorithm, defined as Visco-Young algorithm, based on three of these markers that can match with high concordance (92.6%) between patients with GCB and ABC gene signatures. Our algorithm exhibits strong independent prognostic value that is almost equivalent to that of GEP analysis in the largest cohort of DLBCL patients treated with R-CHOP.
Patients and methods
Patients
We studied 475 patients with de novo adult DLBCL cases that had been diagnosed between January 2002 and October 2009, as part of the International DLBCL Rituximab-CHOP Consortium Program Study. Cases were selected on the basis of the available GEP results and clinical data. All cases were reviewed by a group of hematopathologists (all primary center pathologists, SMM, MAP, MBM, AT, and KHY), and the diagnoses were confirmed on the basis of WHO classification criteria. The current study was reviewed and approved as being of minimal to no risk or as exempt by each of the participating center Institutional Review Boards, and the comprehensive collaborative study was approved by the Institutional Review Board at The University of Texas MD Anderson Cancer Center in Houston, Texas. A Material Transfer Agreement was established and approved by each of the participating centers joining this collaborative project for the International DLBCL Consortium Program.
Tissue microarray (TMA) immunohistochemistry
Immunohistochemical staining was performed on all 475 cases. The hematoxylin-eosin stained slides from each tumor cases were reviewed, and representative areas with the highest percentage of tumor cells were selected for TMA construction. Immunohistochemical analysis was performed on 4-μm TMA sections using a streptavidin-biotin complex technique, and antibodies reactive against the following antigens were utilized: CD3, CD5, CD10, CD20, CD30, CD79a, CD138, ALK-1, BCL2, BCL6, FOXP1, GCET1, GCET2, and MUM1. The samples were analyzed independently by a group of six hematopathologists/pathologists in addition to each of the contributing center hematopathologists), and disagreements were resolved by joint review on a multiheaded microscope.
Gene expression profiling analysis
RNA was extracted from 475 formalin-fixed, paraffin-embedded tissue (FFPET) samples using HighPure Paraffin RNA Extraction Kit (Roche Applied Science). Fifty ng RNA was transcribed into cDNA, linearly amplified using the WT-Ovation™ FFPE System (Nugen) SPIA method21, and biotin labeled using FL-Ovation™ cDNA Biotin Module V2 (Nugen) in all the cases. For GeneChip hybridization, 5 μg of WT-Ovation amplified cDNA was applied to HG-U133 Plus 2.0 GeneChips (Affymetrix) and hybridized overnight. GeneChips were washed, stained, and scanned using the Fluidic Station 450 and GeneChip Scanner 3000 (Affymetrix) according to the manufacturer’s recommendations. For data analysis and classification, the microarray DQN (trimmed mean of differences of perfect match and mismatch intensities with Quantile Normalization22) signals were generated and normalized to the quantiles of beta distribution with parameters p=1.2 and q=3. A Bayesian model23 was also utilized to determine the class probability. The classification model was built on the 47 paired FFPET-fresh frozen sample dataset previously generated with confidence rate of 90.2–100% in fresh frozen tissue and 91.3–100% in FFPE tissue.24 The same methodology developed during this pilot study has been validated and demonstrated to be applicable by using the LLMPP dataset in the Gene Expression Omnibus (GEO) database GSE#10846 that have 181 CHOP-treated and 233 R-CHOP-treated DLBCL patients with FF samples.25
Receiver operating characteristic (ROC) curve analysis to assess discriminatory accuracy of each marker
The ROC curves allowed us to visualize the specificity and sensitivity of each marker (CD10, GCET1, FOXP1, MUM1, and BCL6) in assigning cases to GCB or ABC classification prior to further categorization.26 The performance of each marker could be quantified by the area under the ROC (AUROC) curve (Supplemental Figure 1). All cases were classified separately as GCB or non-GCB based on the cut-off scores form both datasets and the proposed three marker algorithm. Except for 8 cases (1.7%), which were classified as GCB according to the cut-off scores from set 2 but not from set 1 due to the lower cut-off for BCL6, all other 467 cases were completely matched between both groups (Kappa=0.978), demonstrating the validity and reliability of our model. Of these 8 cases, 6 (all 6 being CD10-negative) were GCB and 2 ABC according to GEP, indicating that the lower (30%) cut-off score for BCL6 is more sensitive and useful to identify those, especially CD10-negative GCB cases.
Rationale for the structure of the algorithm
In designing the algorithm, we emphasized the importance of CD10 expression (step 1), which is usually part of the initial diagnostic staining panel for hematopathologists, and its staining has shown the best concordance in different studies between different laboratories.27 We then analyzed GCET1, FOXP1, and MUM119,28 expression in this order (step 2–4), following our rationale that will be discussed below. Finally, we left to BCL6 a minor role in recognizing patients with GCB-DLBCL (step 5) due to the variability and reliability of its staining.26 The five steps of the global algorithm are shown in Figure 1.
Figure 1. Stratification of 475 diffuse large B-cell lymphoma (DLBCL) patients using tissue microarray (TMA) immunohistochemistry: Initial global algorithm.

This algorithm illustrates our rationale for the sequential steps of differentiation of the B-cells through the GC and is built on data from 475 patients. Values in parentheses indicate how patients were classified according to GEP analysis; uncl=unclassifiable cases. The first value in the parentheses indicates the number of cases where GEP and TMA coincided.
Cutoff establishment
We avoided cutoff values based on mean and median expression, since our protein marker expression had a non-Gaussian distribution (Table 1). Instead, by calculating the Youden index29 from our ROC curves, we identified the point on the curve corresponding to the maximum sensitivity and specificity for each marker to classify a DLBCL as either of GCB or ABC type according to GEP analysis. The Youden index pointed to optimal cutoff scores of 35% for CD10, 33% for BCL6, 45% for GCET, 75% for FOXP1, and 58% for MUM1. For CD10 and BCL6, the cutoffs were very close to 30%, which is the accepted cutoff for these two molecules.9 In order to avoid too many different cutoffs in the final algorithm, we compared the optimal cutoff of GCET1 and FOXP1 to 60% and found no change occurred in their sensitivity and specificity. Therefore, we modified the cutoff scores for both GCET1 and FOXP1 to 60%, thus maintaining the optimal cutoff for MUM1.
Table 1.
Concordance between GEP analysis and 4 immunohistochemical algorithms in 431 patients who were classified by GEP either as GCB or ABC (excluding 44 unclassified patients)
| GEP analysis | |||
|---|---|---|---|
|
| |||
| Algorithms | GCB (231) | ABC (200) | Concordance (%) |
| Three-marker algorithm (Visco-Young Algorithm) | |||
| GCB | 215 | 16 | 93.1 |
| Non-GCB | 16 | 184 | 92.0 |
|
| |||
| Four-marker algorithm (Visco-Young Algorithm) | |||
| GCB | 216 | 16 | 93.2 |
| Non-GCB | 15 | 184 | 92.5 |
|
| |||
| Choi algorithm | |||
| GCB | 216 | 28 | 88.6 |
| Non-GCB | 15 | 172 | 91.9 |
|
| |||
| Hans algorithm | |||
| GCB | 209 | 33 | 86.3 |
| Non-GCB | 22 | 167 | 88.3 |
Refining the global algorithm
The initial algorithm with the established cutoffs exhibited a straightforward concordance with GEP analysis (Figure 1). This concordance could be further improved by removing unnecessary passages or redundant decisional points. We removed all the subsequent steps for CD10+ patients and we eliminated step 4 (MUM1), obtaining a four-marker algorithm, which is shown in Figure 2A. Furthermore, after removing step 2 (GCET1) for CD10− patients, we obtained a three-marker algorithm, shown in Figure 2B. By simplifying the algorithm, we increased the number of concordant patients.
Figure 2. Stratification of 475 DLBCL patients using TMA immunohistochemistry: Proposed three-marker and four-marker algorithms compared with the Choi and Hans algorithms.

(A) The four-marker algorithm was developed from the initial global algorithm using four markers and correctly characterizes 92.8% of patients as either GCB- or ABC-DLBCL according to GEP analysis. (B) The three-marker algorithm represents a further simplification and characterizes 92.6% patients compared with GEP. (C) The Choi algorithm was developed with the same five markers as those in our initial global algorithm but with different cutoffs and sequences, and had a predictivity of 90.1% compared with GEP. (D) The Hans algorithm was based on the expression of three markers and had a predictivity of 87.3% compared with GEP. Values in the parentheses indicate how patients were classified according to GEP analysis; uncl=unclassifiable cases.
Validation set
To test the efficacy of the new algorithm in predicting survival in an independent series of cases, we applied the algorithm to a second group of 574 archival DLBCL cases studied using TMAs similarly to the first cohort but for which no GEP analysis was available. Of these, 237 patients had been treated with R-CHOP and 337 with CHOP without rituximab. The same selection criteria as those for the first cohort were applied to these patients. Clinical characteristics at presentation for the validation set were similar to the test set in terms of median gender (female in 45%, p = 0.37), LDH (elevated in 34%, p = 0.66), AAS (III-IV in 49%, p = 0.28), presence of B-symptoms (32%, p = 0.77), or IPI (0–2 in 64%, p = 0.69), except for age. Patients of the validation set were significantly younger than patients of the test set (median age 58 years, p=0.007).
Fluorescence in situ hybridization for C-MYC gene rearrangement
Fluorescence in situ hybridization (FISH) was performed on paraffin-embedded tissue sections with a locus-specific identifier IGH/MYC/CEP 8 tri-color, dual fusion probes (DFP, 05J75-001 from Vysis, Downers Grove, Illinois, USA) and, due to shortcommings of the former in identifying alternative (non-IGH) C-MYC rearrangement partners, a locus-specific identifier C-MYC dual-color, break-apart probe (BP, 05J91-001 from Vysis,). FISH signals were scored with a Zeiss fluorescence microscope. Cases on the TMA were considered for evaluation if at least 200 tumor cell nuclei per core displayed positive signals. Abnormal FISH signals were recorded as percentage of cells showing an abnormality.
Response definitions and statistical analysis
Response assessment was standardized among different Institutions following the criteria based on CT-scan and bone marrow biopsy.30 Late deaths not related to the underlying lymphoma or its treatment were not considered treatment failures.30 The actuarial probability of Progression-free survival (PFS) and overall survival (OS) was determined using the Kaplan–Meier method,31 and differences were compared using the log-rank test. A Cox proportional-hazards model was used for multivariate analysis.32 All variables with P < 0.05 were considered to be statistically significant. The comparison of clinical and laboratory features at presentation was carried out with the χ2 test or the Spearman rank correlation.
Results
Comparison between the new algorithms and GEP results
The 475 patients were classified into GCB (231, 49%), ABC (200, 42%), or unclassifiable (44, 9%) cases by GEP analysis, as shown in Figure 3. The three-marker algorithm (Figure 2B) exhibited a very similar concordance to GEP analysis compared with the four-marker algorithm (only one additional mismatch; see Table 1). Hence, this simplified version was adopted for subsequent analysis. According to the three-marker algorithm, 252 patients (53%) had a GCB phenotype, and 223 (47%) had a non-GCB phenotype (Figure 2B). The 44 cases that were unclassifiable by GEP were assigned to the GCB (21) or the non-GCB (23) subgroups by the new algorithm. Our algorithm had a concordance with GEP results of 92.6% for the 431 patients classified by GEP as having either GCB or ABC disease, compared with 92.8% for the four-marker algorithm. The Choi and Hans algorithms could correctly assign 90.1% and 87.3% of the cases, respectively (Table 1). Concordance of the three-marker algorithm was 93.1% for GCB (16 mismatches out of 231 patients) and 92% for ABC (16 mismatches out of 200 patients), both of which compared favorably with the Hans and Choi algorithms (Table 1). The “Tally” algorithm proposed by Meyer et al.16 was applied to 342 patients whose samples could be classified without the need for LMO2 staining, and its concordance with GEP was 90.1%. The concordance of our algorithm with the recently proposed simplified Hans* and Choi* algorithms by Meyer et al.16 was 86.3% and 81.2%, respectively.
Figure 3. Heat map of hierarchical clustering of gene expression profiling on 475 DLBCL patiets.

Cases stratified as ABC-DLBCL on the left show all the cases express selected markers. Similarly, cases stratified as GCB-DLBCL on the right express hierarchically selected markers. Cases in the middle could not be stratified by GEP as unclassifiable cases (UC).
Distribution and prognostic significance of the expression of each marker
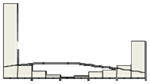
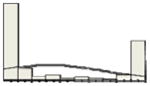
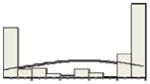
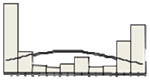
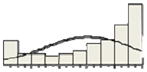
With the Youden index, we established the positivity cutoffs of 30% or more for CD10 and BCL6 and 60% or more for GCET1, FOXP1, and MUM1. Expression above these cutoffs for CD10 was observed in 190 (40%) of patients, BCL6 in 375 (79%), GCET1 in 134 (28%), FOXP1 in 271 (57%), and MUM1 in 179 (38%). The distribution of the expression for each marker is shown in the histograms on Table 2. Since the cutoffs determined with the Youden index were meant only to determine patients as having either GCB or non-GCB DLBCL and were not intended for predicting survival, we divided the percentage of expression of each marker in percentiles in the 475 R-CHOP-treated patients. As shown in Table 2, CD10 expression was significantly associated with PFS when 0%, 20%, or 30% were used as cutoffs. BCL6 expression did not affect PFS. GCET1 and MUM1 expression were instead significantly associated with PFS at several cutoffs, with the Youden index and our chosen cutoffs being among the most predictive for PFS. The 60% cutoff for FOXP1 was the most predictive for PFS in this study group.
Table 2.
Summary of biostatistical features of five immunohistochemical stains (CD10, GCET1, MUM1, FOXP1 and BCL6)
| Molecule | Mean/Median | Distribution | Youden’s index cut-off | PFS OS ≤ vs > | Algorithm cut-off | PFS OS ≤ vs > | 25th percentile | PFS OS ≤ vs > | 50th percentile | PFS OS ≤ vs > | 75th percentile | PFS OS ≤ vs > |
|---|---|---|---|---|---|---|---|---|---|---|---|---|
| CD10 | 37/20 |
|
35 | 0.06 0.06 |
30 | 0.03 0.06 |
0 | 0.01 0.03 |
20 | 0.02 0.08 |
80 | 0.43 0.88 |
| GCET1 | 32/5 |
|
45 | 0.01 0.06 |
60 | 0.02 0.07 |
0 | 0.001 0.01 |
5 | 0.006 0.07 |
80 | 0.07 0.20 |
| FOXP1 | 58/80 |
|
75 | 0.01 0.0004 |
60 | 0.006 0.0009 |
5 | 0.01 0.03 |
80 | 0.02 0.03 |
100 | 0.21 0.10 |
| MUM1 | 42/30 |
|
58 | 0.009 0.01 |
60 | 0.009 0.02 |
5 | 0.76 0.12 |
30 | 0.22 0.01 |
80 0.42 |
0.05 0.42 |
| BCL6 | 60/70 |
|
33 | 0.39 0.66 |
30 | 0.38 0.51 |
40 | 0.20 0.68 |
70 | 0.51 0.29 |
90 | 0.85 0.98 |
The x-axis of the histogram represents the percentage of positive staining from 0 to 100%, divided in 10% intervals; the y-axis is the relative number of patients. For CD10 and GCET1 higher values had positive effect on PFS, for FOXP1 and MUM1 higher values were associated with inferior PFS. Percentiles were used for all the molecules to address the non-Gaussian distribution of values, and their effect at different levels on PFS and OS.
Clinical data and survival
Clinical characteristics at presentation for the 475 R-CHOP-treated patients with de novo DLBCL and stratified according to our proposed three-marker algorithm are shown in Table 3. Clinical variables were well balanced between GCB and non-GCB subgroups except for age, stage, and IPI scores. Patients with the non-GCB phenotype were significantly older (median age, 65 vs. 60 years) and had higher IPI scores (37% vs. 22%; IPI 3–5) than patients with the GCB phenotype, as shown in Table 3.
Table 3.
Clinical characteristics and their impact on survival of 475 DLBCL treated with R-CHOP, then divided according to our three markers algorithm in GCB and non-GCB.
| Overall | GCB | Non-GCB | p-value | ||||||
|---|---|---|---|---|---|---|---|---|---|
|
| |||||||||
| N | % | PFS p-value | OS p-value | N | % | N | % | ||
| Patients | 475 | 100 | |||||||
|
| |||||||||
| Median age | 62 | ||||||||
| ≥60 | 289 | 61 | 0.004 | <0.0001 | 135 | 53 | 154 | 70 | 0.0002 |
| <60 | 186 | 39 | 119 | 47 | 67 | 30 | |||
|
| |||||||||
| Gender | |||||||||
| F | 202 | 43 | 0.33 | 0.80 | 107 | 42 | 95 | 43 | 0.84 |
| M | 273 | 57 | 147 | 58 | 126 | 57 | |||
|
| |||||||||
| Stage | |||||||||
| I–II | 224 | 47 | <0.0001 | <0.0001 | 131 | 52 | 93 | 42 | 0.04 |
| III–IV | 251 | 53 | 123 | 48 | 128 | 58 | |||
|
| |||||||||
| LDH | |||||||||
| Normal | 149 | 35 | 0.0001 | <0.0001 | 80 | 36 | 69 | 33 | 0.46 |
| High | 280 | 65 | 140 | 64 | 140 | 67 | |||
|
| |||||||||
| Performance Status | |||||||||
| 0–1 | 378 | 80 | 0.003 | <0.0001 | 198 | 78 | 180 | 81 | 0.35 |
| 2 or more | 97 | 20 | 56 | 22 | 41 | 19 | |||
|
| |||||||||
| N extranodal sites | |||||||||
| 0–1 | 366 | 77 | 0.001 | <0.0001 | 199 | 78 | 167 | 76 | 0.47 |
| 2 or more | 109 | 23 | 55 | 22 | 54 | 24 | |||
|
| |||||||||
| B-symptoms | |||||||||
| No | 281 | 68 | 0.19 | 0.06 | 153 | 70 | 128 | 66 | 0.40 |
| Yes | 132 | 32 | 66 | 30 | 66 | 34 | |||
| IPI risk group | |||||||||
| 0–1 | 172 | 46 | <0.0001 | <0.0001 | 102 | 47 | 70 | 33 | 0.002 |
| 2–3 | 198 | 40 | 94 | 42 | 104 | 50 | |||
| 4–5 | 59 | 14 | 22 | 10 | 37 | 17 | |||
|
| |||||||||
| Bulky mass | |||||||||
| <7,5 cm | 271 | 73 | 0.86 | 0.10 | 136 | 71 | 135 | 75 | 0.36 |
| ≥7,5 cm | 99 | 27 | 55 | 29 | 44 | 25 | |||
|
| |||||||||
| C-MYC breaks | |||||||||
| No | 273 | 92 | 0.01 | 0.03 | 129 | 88 | 144 | 96 | 0.01 |
| Yes | 23 | 8 | 17 | 12 | 6 | 4 | |||
|
| |||||||||
| Therapy response | |||||||||
| CR | 358 | 76 | <0.0001 | <0.0001 | 187 | 74 | 171 | 77 | 0.34 |
| PR | 72 | 15 | 40 | 16 | 32 | 15 | |||
| SD | 20 | 4 | 13 | 5 | 7 | 3 | |||
Data regarding the presence of B-symptoms, bulky disease, LDH, IPI risk group were available for 413, 370, and 429 patients, respectively. MYC analysis was performed in 296 classified patients. The reported p-value on the IPI score distribution refers to the difference between low (0–1) and high (4–5) IPI score; p-values were p=0.13 between intermediate (2–3) and high (4–5), and p=0.02 between low (0–1) and intermediate (2–3) IPI scores. For therapy response we calculated p-values as CR vs other responses.
Median follow-up was 42 months (range, 4–106 months). Overall, the 5-year OS and PFS were 62% and 60%, respectively. No different outcome was observed in patients treated in different Institutions. As shown in Figure 4C, 5-year OS was significantly different when patients were stratified according to GEP subgroups (69 ± 3% for GCB vs. 53 ± 5% for ABC vs. 60 ± 4% for unclassified cases; P = 0.02 for GCB vs. ABC). Similarly, the 5-year OS was significantly different when patients were stratified according to our three-marker algorithm (71 ± 3% for GCB vs. 51 ± 5% for non-GCB; P = 0.003). In terms of PFS, Figure 4E and 4F show that both the GEP (64 ± 3% for GCB vs. 46 ± 5% for ABC vs. 53 ± 5% for unclassified; P = 0.003 for GCB vs. ABC) and our algorithm (64 ± 4% for GCB vs. 48 ± 5% for non-GCB; P = 0.002) can stratify patients into groups with significantly different 5-year PFS rates. Since there were 44 unclassified cases by GEP and they would not be excluded in the clinical setting, the use of our algorithm allowed us to stratify this subset into two groups with distinct OS and PFS rates. These rates were nonetheless not significantly different which we believe can be attributed to the small number of cases (Supplemental Figure 2). In terms of OS and PFS, the new algorithm compared favorably both with both the Choi and Hans algorithms. Five-year OS was 65 ± 4% for GCB vs. 54 ± 5% for non-GCB (P = 0.04), and 5-year PFS was 66 ± 3% for GCB vs. 53 ± 5% for non-GCB (P = 0.02), according to the Choi algorithm. Using the Hans algorithm, 5-year OS was 64 ± 4% for GCB vs. 55 ± 4% for non-GCB (P = 0.06), and 5-year PFS was 67 ± 4% vs. 52 ± 5% (P = 0.02). The “Tally” algorithm16 was significantly predictive for OS (P = 0.009) and PFS (P = 0.01).
Figure 4. Overall survival (OS) and progression-free survival (PFS) analyses of R-CHOP-treated DLBCL patients when stratified by GEP and TMA immunohistochemistry algorithm.

(A) OS curve for all patients. (B) PFS curve for all patients. (C and D) OS and PFS curves of 431 patients stratified by GEP results, excluding unclassifiable cases (44 of 475); unclassifiable cases are analyzed separately in Supplemental Figure 1. (E and F) OS and PFS curves of 475 patients divided into GCB and non-GCB according to our TMA algorithm.
In the validation set of 574 patients with available TMA data but without GEP analysis, we confirmed the reliability of our algorithm in predicting survival. In this independent subset of patients who were treated with either CHOP or R-CHOP, our algorithm could divide each group of patients into cohorts with significantly different PFS and OS rates (Figure 5). In the validation set, patients with GCB and non-GCB subtypes according to our algorithm did not differ significantly in terms of clinical characteristics at presentation, except for age that was significantly higher for patients with non-GCB subtype.
Figure 5. Validation set of OS and PFS analyses in 574 patients with DLBCL treated with cyclophosphamide, doxorubicin, vincristin, predisone (CHOP) and R (rituximan)-CHOP.

Overall survival and PFS analysis of 574 patients with available TMA but not GEP analysis, stratified according to our three-marker algorithm. (A) 337 CHOP-treated patients; (B) 237 R-CHOP-treated patients.
Univariate and multivariate analyses
As shown in Table 3, univariate analysis for PFS and OS revealed that high IPI score, all the variables that compose the IPI [i.e., stage, age, lactate dehydrogenase (LDH), performance status, and number of extranodal sites] and failure to achieve CR were significantly associated with shorter PFS. In multivariate analysis using the Cox regression model, an IPI score 3–5 (hazard ratio, 0.59; 95% CI, 0.43–0.83; P = 0.002), non-GCB origin (hazard ratio, 0.59; 95% CI, 0.43–0.81; P = 0.001), and failure to achieve CR (hazard ratio, 0.15; 95% CI, 0.10–0.21; P = 0.032) were independent adverse prognostic factors for PFS. Similar results were obtained in terms of OS, with IPI score 3–5 (hazard ratio, 0.53; 95% CI, 0.38–0.74; P = 0.0002), non-GCB origin (hazard ratio, 0.56; 95% CI, 0.40–0.77; P = 0.0004), and failure to achieve CR (hazard ratio, 0.14; 95% CI, 0.10–0.20; P < 0.0001) as independent prognostic factors. Age, stage, LDH, performance status, and number of extranodal sites were not computed in the multivariate analysis because these variables are included in the IPI score. More interestingly, univariate and multivariate analysis were performed in the 237 patients treated with R-CHOP of the validation set. Similarly to the former, both IPI score 3–5 (hazard ratio, 0.57; 95% CI, 0.37–0.89; P = 0.01), and non-GCB origin (hazard ratio, 0.63; 95% CI, 0.42–0.96; P = 0.03) resulted independent adverse prognostic factors for PFS.
Kaplan-Meier analyses showed that, according to our algorithm, IPI score (0–1 vs. 2–3 vs. 4–5) could divide patients with GCB and non-GCB subtypes into cohorts with significantly different PFS rates (Supplemental Figure 3). When we combined the IPI score and our algorithm, we identified a group of patients with a very favorable PFS (IPI 0–1 and GCB phenotype, 5-year PFS of 86 ± 1%) and a patient group with an unfavorable PFS (IPI score 4–5 and non-GCB phenotype, 5-year PFS of 28 ± 7%).
Twenty-three of 296 patients (8%) had MYC rearrangements. Patients with C-MYC breaks had a significantly inferior OS (p=0.03) and PFS (p=0.01) compared to patients without breaks (median and mean OS 24 and 34 months, median and mean PFS 18 and 25 months, respectively). As shown in Table 3, C-MYC breaks were significantly more frequent among patients with GCB DLBCL. Even though numbers were low, the pejorative impact of C-MYC breaks on survival of our patients reached statistical significance in GCB patients according to GEP (16 patients, p=0.02 for OS and p<0.0001 for PFS) but not in ABC (7 patients, p=0.32 for OS and p=0.66 for PFS). Similar results were obtained when we used our algorithm to split patients into GCB (17 patients, p=0.03 for OS and p<0.0001 for PFS) or non-GCB phenotype (6 patients, p=0.43 for OS and p=0.76 for PFS).
Discussion
We created a new algorithm based on the expression of CD10, FOXP1, and BCL6 that precisely stratifies the GCB and ABC subtypes of DLBCL. The associations of each marker with GCB or ABC DLBCL and the cutoffs to determine positivity were assessed using ROC curves, which obviated the need to use any arbitrary cutoffs. Our algorithm had strong prognostic power matching that of GEP in R-CHOP-treated patients and was independent of IPI. In an independent cohort of patients treated with either CHOP or R-CHOP, we confirmed the algorithm’s prognostic predictive value. Finally, the algorithm proposed also allowed us to classify patients with DLBCL whose disease had been unclassifiable according to GEP, although survival analysis in this small group of patients did not reach statistical significance.
Our results confirm the reliability of previous findings,33 demonstrating that GEP can be performed by extracting RNA from FFPET instead of frozen tissue, which is often not obtained at diagnosis and is becoming decreasingly available in the current era of small needle biopsy for diagnosis. The immunohistochemical algorithm can be easily performed by most laboratories on paraffin-embedded tissues and allows for the direct visualization of tumor cells.26 Moreover, compared with GEP analysis, the phenotype of the tumor reflects gene expression of the lymphoma cells, revealing which molecules are in fact expressed and functional and could thus be the target of new drugs. Recent studies have shown that some drugs enhance the activity of chemotherapy in ABC- but not GCB-DLBCL, providing a rationale for different therapeutic approaches for distinct DLBCL subtypes.34–38
Malignant B-cells of DLBCL are thought to be “frozen” at particular stages of B-cell development. In the GC microenvironment, specific proteins are up- or down-regulated at any one particular stage. It has been shown that B-cells in the GC can migrate extensively within their respective compartments.39 In this scenario, GCET1 stains positive in rapidly dividing B-cells (i.e., Ki-67+ centroblasts) in the dark zone of the GC. Its expression is enhanced when B-cells are stimulated by CD40 signaling,40 and it is then likely to identify centroblasts that have been rescued from cell death and are prompted to proliferate and undergo somatic hypermutation and class-switch recombination.17,28,41 Foxp1 is an essential transcriptional regulator of B-cell development that influences B-cell development at very early stages,42 and its mRNA expression is also typically elevated in ABC-DLBCL.42 Cell lines that are at an intermediate stage of differentiation between GCB and ABC (i.e., LIB) express CD10, BCL6 and MUM1 as well as FOXP1,19 indicating that this marker could represent a bridge from the GC stage to subsequent B-cell activation. Some preliminary data have suggested that smaller FOXP1 isoforms may have a role in activating the transcription factor MUM1, pushing B-cells toward plasma cell differentiation.6,41–44 Hence, in the construction of our algorithm, we evaluated the expression of CD10, GCET1, FOXP1, and MUM1 in that order to progressively address the steps of B-cell maturation.
Since BCL6 is the marker with the largest variability in its staining interpretation between laboratories, only a minority of patients will need to rely on its staining for subset discrimination. According to our algorithm, the role of BCL6 is confined to patients (less than 20%) that are negative both for CD10 and FOXP1, while the Choi and the Hans algorithms gave strong decisional power to BCL6 (50% and 60% of patients, respectively). We acknowledge that the assignment of these patients to a specific subset might benefit of other GC-specific markers that have been used in other algorithms, but were not analyzed in our study. Among these, human GC-associated lymphoma (HGAL or GCET-1) expression has been shown to correlate with improved survival in CHOP-treated patients with DLBCL.45 This observation was confirmed in our series of cases as well (data not shown). Similarly, LMO2 mRNA expression was reported as a predictors of superior outcome in DLBCL patients in a relatively small series of DLBCL cases, however, the finding has not been confirmed and validated from other groups in a large cohort of cases.46 HGAL is an adaptor protein involved in prevention of lymphocyte migration, thus constraining lymphocytes to the GC.47,48 Double-staining studies have demonstrated that most BCL6+ cells co-express HGAL, although several BCL6+ cells of the proliferating pole or dark zone of GCs lack staining for HGAL. Therefore, it is suggested that HGAL, unlike GCET1, may identify resting cells within the GC.49,50 Other markers that are discriminatory for ABC-DLBCL, such as cyclin D2,9,51 PRDM1/Blimp1, and XBP1,52 were excluded based on our previous experience and on the absence of data in R-CHOP-treated patients at the time of the approval for the current study. We found that GCET1 and FOXP1 were both predictive of PFS in R-CHOP-treated patients, regardless of the cutoff utilized (Table 1). To the best of our knowledge, this is the first report addressing the prognostic predictive value of GCET1 expression as a single marker for R-CHOP-treated patients with DLBCL.
The use of the algorithm we proposed, when applied to patients uniformly treated with R-CHOP, had remarkable prognostic significance and was independent of IPI, as shown in the multivariate analysis. When we combined the IPI score and our algorithm, we could identify cohorts of patients at very low (IPI 0–1 and GCB phenotype, 5-year PFS of 86 ± 1%) or very high risk of relapse (IPI score 4–5 and non-GCB phenotype, 5-year PFS of 28 ± 7%).
The staining algorithm proposed by Choi et al. has shown good concordance with GEP analysis, but had a complicated structure, using five markers with different cutoffs.12 The more recent Tally algorithm16 was also based on the expression of five antibodies, three of which are not commonly used by pathologists, and with arbitrary decisional cutoffs. In both studies, it is not clear whether patients with transformed, primary mediastinal, primary cutaneous, or central nervous system DLBCL were excluded from the analysis, despite the peculiar biological features and clinical behavior of these tumor types.
Unlike any other new marker, CD10 is part of the initial immunophenotypic panel used by hematopathologists. Therefore, our use of CD10 as the first discriminating marker in the new algorithm simplifies the categorization of patients. The predictive value of CD10 positivity alone in identifying patients with GCB according to GEP was 95% in our series, similar to that reported by others,9,12,20 and could not be improved by the addition of any other markers. Thus, although we have maintained the structure of the Hans algorithm for CD10+ patients, our new algorithm improves the discrimination of CD10− patients, who were correctly assigned in 91.4% of cases, compared with 82.3% when the Hans algorithm was used. However, a very small subset of cases with strong CD10 expression was classified as ABC. Most of these cases had strong FOXP-1 or MUM-1 expression, but rarely expressed GCET-1. On the other hand rare cases lacking CD10 expression were classified as GCB by GEP. Most of these cases had strong BCL6 and FOXP1 expression, while only few expressed GCET1. Morphologically, the first group had polymorphic morphology, whereas cases classified as ABC by IHC algorithm, but GCB by GEP analysis, showed typical centroblastic morphology. The low number of misclassified patients did not allow conclusion on clinical behavior of this particular subset.
We analyzed 296 patients with available material for the presence of C-MYC, and 8% had MYC rearrangements. Patients with C-MYC breaks had a significantly inferior outcome compared to patients without breaks. Although numbers were low, C-MYC breaks had a significant impact on survival of GCB, but not in ABC patients, either when recognized by means of GEP or of our algorithm.
We reviewed 466 patients with available material for morphologic classification using 2008 WHO classification as criteria.53–55 Four hundred and five (87%) had centroblastic morphology (CB). Of them, 251 had cleaved (59) or large non-cleaved (192) cell types. Twenty-four patients had anaplastic morphology (5%), and 37 had immunoblastic morphology (IB, 8%). According to morphologic subtype distribution, CB was significantly more represented in the GCB (54%) than IB (27%, p = 0.001), while anaplastic morphology was GCB in 66%. Large non-cleaved cell type was more represented in GCB (63%), similarly to the medium-sized cells (76%), and differently from cleaved cells (41%) and polymorphic cell type (38%). Patients with CB had significantly better OS (p < 0.0001) and PFS (p = 0.001) compared to IB, or anaplastic morphology (p = 0.0001 and p = 0.004, respectively). According to cell type distribution, large non-cleaved cell type had the better 5-year PFS and OS (65% and 70%, respectively). A significant difference in terms of OS or PFS was observed between large non-cleaved cell type and others (p = 0.04 and p = 0.005, respectively).
In conclusion, we found that the expression of three markers can be combined to divide DLBCL into GCB and non-GCB subgroups with high specificity and that our method can predict an outcome similar to that of GEP analysis in R-CHOP-treated patients. Our findings are currently used in our new clinical trial DLBCL studies. We believe the algorithm presented here will substantially improve upon the performance of the former algorithms, and allow a better stratification of DLBCLs for further characterizing the pathways that identify each of the DLBCL subtypes and for testing the efficacy of new drugs in distinct subgroups.
Supplementary Material
Acknowledgments
We thank our consortium program team of pathologists, hematologists and clinicians, and each of the contributing center principal physicians for their support in selection, evaluation and contribution of the cases. We thank our patients, former and current Hematopathology and Hematology/Oncology fellows, and research scientists (Chih-Jian Lih, Paul M. Williams, Lynn Trinh, and Yuchaun Tai) for their support. Technical and publication editing supports from Maitrayee Goswami and Virginia Mohlere from the Department of Scientific Publications are greatly appreciated. The abstract was presented as oral communication at the Lugano ICML Conference on June 16, 2011.
C.V. is an honorable visiting hematologist supported by San Bortolo Hospital, Vicenza, Italy and The University of Texas MD Anderson Cancer Center. K.H.Y is supported by The University of Texas MD Anderson Cancer Center Institutional R & D Fund, Institutional Research Grant Award, MD Anderson Cancer Center SPORE Research Development Program Award, Gundersen Lutheran Medical Foundation Award, and Forward Lymphoma Fund. This study is also partially supported by NCI/NIH (R01CA138688 and 1RC1CA146299).
Footnotes
Publicly Available Data Sets: All primary sequencing data will be made publicly available through the GEO archive through accession GSE#31312.
Conflicts of Interest
The authors declare no conflicts of interest.
Supplemental Appendix (full description of Materials and Methods with additional results) is available at Leukemia Online Website
Authorship Contributions
Designed research: C.V. and K.H.Y.
Performed research: C.V., Y.L., Z.Y.X.M., W.L., S.M.M., M.A.P., M.B.M., L.W., and K.H.Y.
Contributed vital new reagents, resource, and analytical tools under approved IRB and MTA: C.V., Y.L, R.N.M., A.T., W.W., W.L., E.S.G.D., S.M.M., K.D., A.C., W.T., A.O., Y.Z., G.B., J.N.W., S.O.N., C.D., E.D.H., X.F.Z., R.S.G., W.W.L.C., F.Z., J.T., X.Y.Z., J.H.V.K., Q.H., M.A.P., M.B.M., C.E.B.R., L.J.M., L.W., and K.H.Y.
Collected data and followup under approved IRB and MTA: C.V., Z.Y.X.M., R.N.M., T.M.G., A.T., E.S.G.D., S.M.M., K.D., A.C., W.T., A.O., Y.Z., G.B., J.N.W., H.Y.W., S.O.N., C.D., E.D.H., X.F.Z., R.S.G., W.W.L.C., F.Z., M.C., J.T., X.Y.Z., J.H.V.K., Q.H., W.A., J.E., M.P., A.J.M.F., M.A.P., M.B.M., C.E.B.R., L.J.M., and K.H.Y.
Contributed vital strategies, participated in discussions and provided scientific input: C.V., Y.L, Z.Y.X.M., R.N.M., T.M.G., Y.L, A.T., W.W., W.L., B.S.K., E.S.G.D., S.M.M., K.D., A.C., W.T., A.O., Y.Z., G.B., J.N.W., H.Y.W., S.O.N., C.D., E.D.H., X.F.Z., R.S.G., W.W.L.C., F.Z., M.C., J.T., X.Y.Z., J.H.V.K., Q.H., W.A., J.E., M.P., A.J.M.F., M.A.P., M.B.M., C.E.B.R., L.J.M., L.W., and K.H.Y.
Analyzed data: C.V. and K.H.Y.
Performed and supported statistical analysis: C.V., A.T., and K.H.Y.
Wrote the paper: C.V. and K.H.Y.
References
- 1.Jaffe ES, Harris NL, Stein H, Isaacson PG. Classification of lymphoid neoplasms: the microscope as a tool for disease discovery. Blood. 2008;112:4384–4399. doi: 10.1182/blood-2008-07-077982. [DOI] [PMC free article] [PubMed] [Google Scholar]
- 2.Coiffier B, Thieblemont C, Van Den Neste E, Lepeu G, Plantier I, Castaigne S, et al. Long-term outcome of patients in the LNH-98. 5 trial, the first randomized study comparing rituximab-CHOP to standard CHOP chemotherapy in DLBCL patients: a study by the Groupe d’Etudes des Lymphomes de l’Adulte. Blood. 2010;116:2040–2045. doi: 10.1182/blood-2010-03-276246. [DOI] [PMC free article] [PubMed] [Google Scholar]
- 3.Alizadeh AA, Eisen MB, Davis RE, Ma C, Lossos IS, Rosenwald A, et al. Distinct types of diffuse large B-cell lymphoma identified by gene expression profiling. Nature. 2000;403:503–511. doi: 10.1038/35000501. [DOI] [PubMed] [Google Scholar]
- 4.Rosenwald A, Wright G, Chan WC, Connors JM, Campo E, Fisher RI, et al. The use of molecular profiling to predict survival after chemotherapy for diffuse large-B-cell lymphoma. N Engl J Med. 2002;346:1937–1947. doi: 10.1056/NEJMoa012914. [DOI] [PubMed] [Google Scholar]
- 5.Shaffer AL, Rosenwald A, Staudt LM. Lymphoid malignancies: the dark side of B-cell differentiation. Nat Rev Immunol. 2002;2:920–932. doi: 10.1038/nri953. [DOI] [PubMed] [Google Scholar]
- 6.Lenz G, Staudt LM. Aggressive lymphomas. N Engl J Med. 2010;362:1417–1429. doi: 10.1056/NEJMra0807082. [DOI] [PMC free article] [PubMed] [Google Scholar]
- 7.Fu K, Weisenburger DD, Choi WW, Perry KD, Smith LM, Shi X, et al. Addition of rituximab to standard chemotherapy improves the survival of both the germinal center B-cell-like and non-germinal center B-cell-like subtypes of diffuse large B-cell lymphoma. J Clin Oncol. 2008;26:4587–4594. doi: 10.1200/JCO.2007.15.9277. [DOI] [PubMed] [Google Scholar]
- 8.A predictive model for aggressive non-Hodgkin’s lymphoma. The International Non-Hodgkin’s Lymphoma Prognostic Factors Project. N Engl J Med. 1993;329:987–994. doi: 10.1056/NEJM199309303291402. [DOI] [PubMed] [Google Scholar]
- 9.Hans CP, Weisenburger DD, Greiner TC, Gascoyne RD, Delabie J, Ott G, et al. Confirmation of the molecular classification of diffuse large B-cell lymphoma by immunohistochemistry using a tissue microarray. Blood. 2004;103:275–282. doi: 10.1182/blood-2003-05-1545. [DOI] [PubMed] [Google Scholar]
- 10.Nyman H, Adde M, Karjalainen-Lindsberg ML, Taskinen M, Berglund M, Amini RM, et al. Prognostic impact of immunohistochemically defined germinal center phenotype in diffuse large B-cell lymphoma patients treated with immunochemotherapy. Blood. 2007;109:4930–4935. doi: 10.1182/blood-2006-09-047068. [DOI] [PubMed] [Google Scholar]
- 11.Natkunam Y, Farinha P, Hsi ED, Hans CP, Tibshirani R, Sehn LH, et al. LMO2 protein expression predicts survival in patients with diffuse large B-cell lymphoma treated with anthracycline-based chemotherapy with and without rituximab. J Clin Oncol. 2008;26:447–454. doi: 10.1200/JCO.2007.13.0690. [DOI] [PubMed] [Google Scholar]
- 12.Choi WW, Weisenburger DD, Greiner TC, Piris MA, Banham AH, Delabie J, et al. A new immunostain algorithm classifies diffuse large B-cell lymphoma into molecular subtypes with high accuracy. Clin Cancer Res. 2009;15:5494–5502. doi: 10.1158/1078-0432.CCR-09-0113. [DOI] [PMC free article] [PubMed] [Google Scholar]
- 13.Xia ZG, Xu ZZ, Zhao WL, Zhao SQ, Ding F, Chen Y, et al. The prognostic value of immunohistochemical subtyping in Chinese patients with de novo diffuse large B-cell lymphoma undergoing CHOP or R-CHOP treatment. Ann Hematol. 2010;89:171–177. doi: 10.1007/s00277-009-0799-2. [DOI] [PubMed] [Google Scholar]
- 14.Seki R, Ohshima K, Fujisaki T, Uike N, Kawano F, Gondo H, et al. Prognostic impact of immunohistochemical biomarkers in diffuse large B-cell lymphoma in the rituximab era. Cancer Sci. 2009;100:1842–1847. doi: 10.1111/j.1349-7006.2009.01268.x. [DOI] [PMC free article] [PubMed] [Google Scholar]
- 15.Nyman H, Jerkeman M, Karjalainen-Lindsberg ML, Banham AH, Leppa S. Prognostic impact of activated B-cell focused classification in diffuse large B-cell lymphoma patients treated with R-CHOP. Mod Pathol. 2009;22:1094–1101. doi: 10.1038/modpathol.2009.73. [DOI] [PubMed] [Google Scholar]
- 16.Meyer PN, Fu K, Greiner TC, Smith LM, Delabie J, Gascoyne RD, et al. Immunohistochemical methods for predicting cell of origin and survival in patients with diffuse large B-cell lymphoma treated with rituximab. J Clin Oncol. 2011;29:200–207. doi: 10.1200/JCO.2010.30.0368. [DOI] [PMC free article] [PubMed] [Google Scholar]
- 17.Montes-Moreno S, Roncador G, Maestre L, Martinez N, Sanchez-Verde L, Camacho FI, et al. Gcet1 (centerin), a highly restricted marker for a subset of germinal center-derived lymphomas. Blood. 2008;111:351–358. doi: 10.1182/blood-2007-06-094151. [DOI] [PubMed] [Google Scholar]
- 18.Barrans SL, Fenton JA, Banham A, Owen RG, Jack AS. Strong expression of FOXP1 identifies a distinct subset of diffuse large B-cell lymphoma (DLBCL) patients with poor outcome. Blood. 2004;104:2933–2935. doi: 10.1182/blood-2004-03-1209. [DOI] [PubMed] [Google Scholar]
- 19.Brown PJ, Ashe SL, Leich E, Burek C, Barrans S, Fenton JA, et al. Potentially oncogenic B-cell activation-induced smaller isoforms of FOXP1 are highly expressed in the activated B cell-like subtype of DLBCL. Blood. 2008;111:2816–2824. doi: 10.1182/blood-2007-09-115113. [DOI] [PubMed] [Google Scholar]
- 20.Gutiérrez-García G, Cardesa-Salzmann T, Climent F, Gonzalez-Barca E, Mercadal S, Mate JL, et al. Gene-expression profiling and not immunophenotypic algorithms predicts prognosis in patients with diffuse large B-cell lymphoma treated with immunochemotherapy. Blood. 2011;117:4836–4843. doi: 10.1182/blood-2010-12-322362. [DOI] [PubMed] [Google Scholar]
- 21.Marko NF, Frank B, Quackenbush J, Lee NH. A robust method for the amplification of RNA in the sense orientation. BMC Genomics. 2005;6:27. doi: 10.1186/1471-2164-6-27. [DOI] [PMC free article] [PubMed] [Google Scholar]
- 22.Liu WM, Li R, Sun JZ, Wang J, Tsai J, Wen W, et al. PQN and DQN: algorithms for expression microarrays. J Theoretical Biol. 2006;243:273–278. doi: 10.1016/j.jtbi.2006.06.017. [DOI] [PubMed] [Google Scholar]
- 23.Wright G, Tan B, Rosenwald A, Hurt EH, Wiestner A, Staudt LM. A gene expression-based method to diagnose clinically distinct subgroups of diffuse large B cell lymphoma. Proc Natl Acad Sci U S A. 2003;100:9991–9996. doi: 10.1073/pnas.1732008100. [DOI] [PMC free article] [PubMed] [Google Scholar]
- 24.Williams PM, Li R, Johnson NA, Wright G, Heath J-D, Gascoyne RD. A novel method of amplification of FFPET-derived RNA enables accurate disease classification with microarrays. J Mol Diagn. 2010;12:680–686. doi: 10.2353/jmoldx.2010.090164. [DOI] [PMC free article] [PubMed] [Google Scholar]
- 25.Lenz G, Wright G, Dave SS, Xiao W, Powell J, Zhao H, et al. Stromal gene signatures in large-B-cell lymphomas. N Engl J Med. 2008;359:2313–2323. doi: 10.1056/NEJMoa0802885. [DOI] [PMC free article] [PubMed] [Google Scholar]
- 26.Tzankov A, Zlobec I, Went P, Robl H, Hoeller S, Dirnhofer S. Prognostic immunophenotypic biomarker studies in diffuse large B cell lymphoma with special emphasis on rational determination of cut-off scores. Leuk Lymphoma. 2010;51:199–212. doi: 10.3109/10428190903370338. [DOI] [PubMed] [Google Scholar]
- 27.de JD, Xie W, Rosenwald A, Chhanabhai M, Gaulard P, Klapper W, et al. Immunohistochemical prognostic markers in diffuse large B-cell lymphoma: validation of tissue microarray as a prerequisite for broad clinical applications (a study from the Lunenburg Lymphoma Biomarker Consortium) J Clin Pathol. 2009;62:128–138. doi: 10.1136/jcp.2008.057257. [DOI] [PubMed] [Google Scholar]
- 28.Banham AH, Beasley N, Campo E, Fernandez PL, Fidler C, Gatter K, et al. The FOXP1 winged helix transcription factor is a novel candidate tumor suppressor gene on chromosome 3p. Cancer Res. 2001;61:8820–8829. [PubMed] [Google Scholar]
- 29.Youden WJ. Index for rating diagnostic tests. Cancer. 1950;3:32–35. doi: 10.1002/1097-0142(1950)3:1<32::aid-cncr2820030106>3.0.co;2-3. [DOI] [PubMed] [Google Scholar]
- 30.Cheson BD, Horning SJ, Coiffier B, Shipp MA, Fisher RI, Connors JM, et al. Report of an international workshop to standardize response criteria for non-Hodgkin’s lymphomas. NCI Sponsored International Working Group. J Clin Oncol. 1999;17:1244–1253. doi: 10.1200/JCO.1999.17.4.1244. [DOI] [PubMed] [Google Scholar]
- 31.Kaplan E, Meier P. Nonparametric estimation from incomplete observations. J Am Stat Assoc. 1958;53:457–481. [Google Scholar]
- 32.Cox DR. Regression models and life-tables. J R Stat Soc. 1972;34:187–220. [Google Scholar]
- 33.Rimsza LM, Leblanc ML, Unger JM, Miller TP, Grogan TM, Persky DO, et al. Gene expression predicts overall survival in paraffin-embedded tissues of diffuse large B-cell lymphoma treated with R-CHOP. Blood. 2008;112:3425–3433. doi: 10.1182/blood-2008-02-137372. [DOI] [PMC free article] [PubMed] [Google Scholar]
- 34.Dunleavy K, Pittaluga S, Czuczman MS, Dave SS, Wright G, Grant N, et al. Differential efficacy of bortezomib plus chemotherapy within molecular subtypes of diffuse large B-cell lymphoma. Blood. 2009;113:6069–6076. doi: 10.1182/blood-2009-01-199679. [DOI] [PMC free article] [PubMed] [Google Scholar]
- 35.Hernandez-Ilizaliturri FJ, Deeb G, Zinzani PL, Pileri SA, Malik F, Macon WR, et al. Higher response to lenalidomide in relapsed/refractory diffuse large b-cell lymphoma in nongerminal center b-cell-like than in germinal center b-cell-like phenotype. Cancer. 2011 doi: 10.1002/cncr.26135. e-pub ahead of print 14 April 2011. [DOI] [PubMed] [Google Scholar]
- 36.Uddin S, Hussain AR, Ahmed M, Al-Dayel F, Bu R, Bavi P, et al. Inhibition of c-MET is a potential therapeutic strategy for treatment of diffuse large B-cell lymphoma. Lab Invest. 2010;90:1346–1356. doi: 10.1038/labinvest.2010.108. [DOI] [PubMed] [Google Scholar]
- 37.Milhollen MA, Traore T, Adams-Duffy J, Thomas MP, Berger AJ, Dang L, et al. MLN4924, a NEDD8-activating enzyme inhibitor, is active in diffuse large B-cell lymphoma models: rationale for treatment of NF-{kappa}B-dependent lymphoma. Blood. 2010;116:1515–1523. doi: 10.1182/blood-2010-03-272567. [DOI] [PubMed] [Google Scholar]
- 38.Hailfinger S, Lenz G, Ngo V, Posvitz-Fejfar A, Rebeaud F, Guzzardi M, et al. Essential role of MALT1 protease activity in activated B cell-like diffuse large B-cell lymphoma. Proc Natl Acad Sci U S A. 2009;106:19946–19951. doi: 10.1073/pnas.0907511106. [DOI] [PMC free article] [PubMed] [Google Scholar]
- 39.Schwickert TA, Lindquist RL, Shakhar G, Livshits G, Skokos D, Kosco-Vilbois MH, et al. In vivo imaging of germinal centres reveals a dynamic open structure. Nature. 2007;446:83–87. doi: 10.1038/nature05573. [DOI] [PubMed] [Google Scholar]
- 40.Frazer JK, Jackson DG, Gaillard JP, Lutter M, Liu YJ, Banchereau J, et al. Identification of centerin: a novel human germinal center B cell-restricted serpin. Eur J Immunol. 2000;30:3039–3048. doi: 10.1002/1521-4141(200010)30:10<3039::AID-IMMU3039>3.0.CO;2-H. [DOI] [PubMed] [Google Scholar]
- 41.Falini B, Mason DY. Proteins encoded by genes involved in chromosomal alterations in lymphoma and leukemia: clinical value of their detection by immunocytochemistry. Blood. 2002;99:409–426. doi: 10.1182/blood.v99.2.409. [DOI] [PubMed] [Google Scholar]
- 42.Hu H, Wang B, Borde M, Nardone J, Maika S, Allred L, et al. Foxp1 is an essential transcriptional regulator of B cell development. Nat Immunol. 2006;7:819–826. doi: 10.1038/ni1358. [DOI] [PubMed] [Google Scholar]
- 43.Lenz G, Wright GW, Emre NC, Kohlhammer H, Dave SS, Davis RE, et al. Molecular subtypes of diffuse large B-cell lymphoma arise by distinct genetic pathways. Proc Natl Acad Sci U S A. 2008;105:13520–13525. doi: 10.1073/pnas.0804295105. [DOI] [PMC free article] [PubMed] [Google Scholar]
- 44.Klein U, Casola S, Cattoretti G, Shen Q, Lia M, Mo T, et al. Transcription factor IRF4 controls plasma cell differentiation and class-switch recombination. Nat Immunol. 2006;7:773–782. doi: 10.1038/ni1357. [DOI] [PubMed] [Google Scholar]
- 45.Lossos IS, Alizadeh AA, Rajapaksa R, Tibshirani R, Levy R. HGAL is a novel interleukin-4-inducible gene that strongly predicts survival in diffuse large B-cell lymphoma. Blood. 2003;101:433–440. doi: 10.1182/blood-2002-06-1931. [DOI] [PubMed] [Google Scholar]
- 46.Lossos IS, Czerwinski DK, Alizadeh AA, Wechser MA, Tibshirani R, Botstein D, et al. Prediction of survival in diffuse large-B-cell lymphoma based on the expression of six genes. N Engl J Med. 2004;350:1828–1837. doi: 10.1056/NEJMoa032520. [DOI] [PubMed] [Google Scholar]
- 47.Natkunam Y, Lossos IS, Taidi B, Zhao S, Lu X, Ding F, et al. Expression of the human germinal center-associated lymphoma (HGAL) protein, a new marker of germinal center B-cell derivation. Blood. 2005;105:3979–3986. doi: 10.1182/blood-2004-08-3112. [DOI] [PMC free article] [PubMed] [Google Scholar]
- 48.Lu X, Chen J, Malumbres R, Cubedo Gil E, Helfman DM, Lossos IS. HGAL, a lymphoma prognostic biomarker, interacts with the cytoskeleton and mediates the effects of IL-6 on cell migration. Blood. 2007;110:4268–4277. doi: 10.1182/blood-2007-04-087775. [DOI] [PMC free article] [PubMed] [Google Scholar]
- 49.Natkunam Y, Zhao S, Mason DY, Chen J, Taidi B, Jones M, et al. The oncoprotein LMO2 is expressed in normal germinal-center B cells and in human B-cell lymphomas. Blood. 2007;109:1636–1642. doi: 10.1182/blood-2006-08-039024. [DOI] [PMC free article] [PubMed] [Google Scholar]
- 50.Pan Z, Shen Y, Du C, Zhou G, Rosenwald A, Staudt LM, et al. Two newly characterized germinal center B-cell-associated genes, GCET1 and GCET2, have differential expression in normal and neoplastic B cells. Am J Pathol. 2003;163:135–144. doi: 10.1016/S0002-9440(10)63637-1. [DOI] [PMC free article] [PubMed] [Google Scholar]
- 51.Amen F, Horncastle D, Elderfield K, Banham AH, Bower M, Macdonald D, et al. Absence of cyclin-D2 and Bcl-2 expression within the germinal centre type of diffuse large B-cell lymphoma identifies a very good prognostic subgroup of patients. Histopathology. 2007;51:70–79. doi: 10.1111/j.1365-2559.2007.02721.x. [DOI] [PubMed] [Google Scholar]
- 52.Shaffer AL, Shapiro-Shelef M, Iwakoshi NN, Lee AH, Qian SB, Zhao H, et al. XBP1, downstream of Blimp-1, expands the secretory apparatus and other organelles, and increases protein synthesis in plasma cell differentiation. Immunity. 2004;21:81–93. doi: 10.1016/j.immuni.2004.06.010. [DOI] [PubMed] [Google Scholar]
- 53.Harris NL, Jaffe ES, Stein H, et al. A revised European-American classification of lymphoid neoplasms: a proposal from the International Lymphoma Study Group [see comments] Blood. 1994;84:1361–1392. [PubMed] [Google Scholar]
- 54.Gatter KC, Warnke RA. Diffuse large B-cell lymphoma. In: Jaffe ES, Harris NL, Stein H, Vardiman JW, editors. Pathology and Genetics: Tumours of Haematopoietic and Lymphoid Tissues. World Health Organization Classification of Tumours; Lyon, France: IARC Press; 2001. pp. 171–174. [Google Scholar]
- 55.Stein H, Warnke RA, Chan WC, et al. Diffuse large B-cell lymphoma, not otherwise specified. In: Swerdlow SH, Campo E, Harris NL, et al., editors. WHO Classification of Tumours of Haematopoietic and Lymphoid Tissues. 4. Lyon, France: IARC; 2008. pp. 233–237. [Google Scholar]
Associated Data
This section collects any data citations, data availability statements, or supplementary materials included in this article.