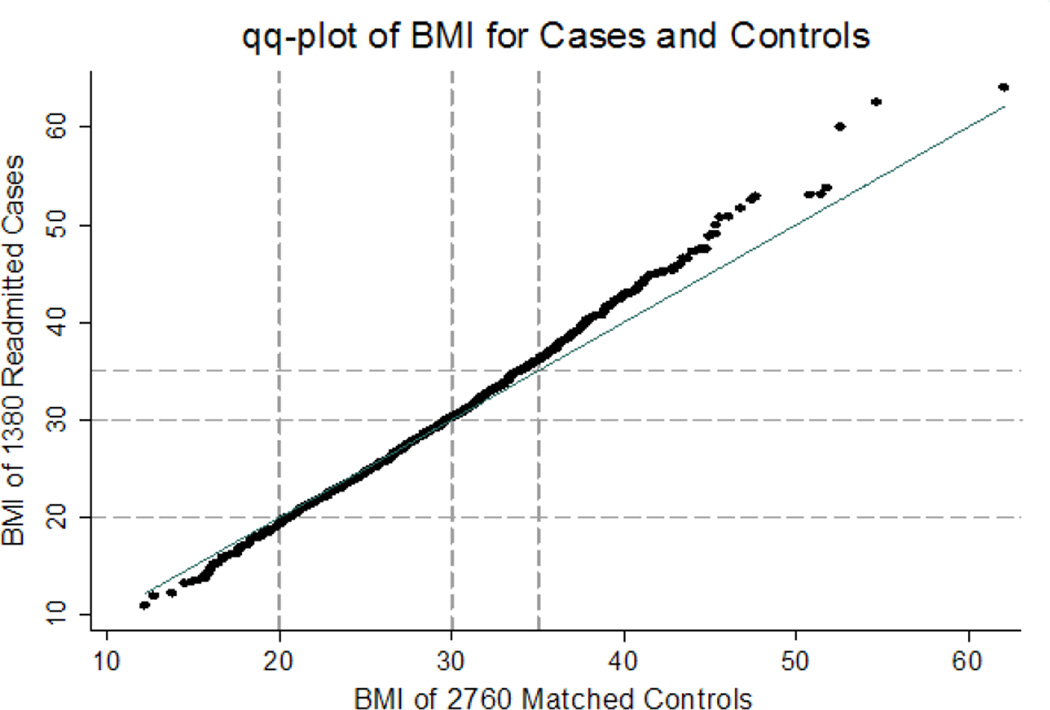
Figure 1. Quantile-quantile plot of body mass index for cases and controls.
The solid line indicates x = y, and dashed lines indicate BMI = 20, BMI = 30 and BMI = 35. After ordering the cases and controls, adjacent pairs of controls were averaged to allow a one-to-one plot of cases versus controls. As can be seen, patients with a BMI greater than 35 kg/m2 were overrepresented among cases of readmission as compared to controls.

