

Abstract
Recent studies suggest that white matter abnormalities contribute to both motor and non-motor symptoms of Parkinson’s disease. The present study was designed to investigate the degree to which diffusion tensor magnetic resonance imaging (DTI) indices are related to executive function in Parkinson’s patients. We used tract-based spatial statistics to compare DTI data from 15 patients to 15 healthy, age- and education-matched controls. We then extracted mean values of fractional anisotropy (FA) and mean diffusivity (MD) within an a priori frontal mask. Executive function composite Z scores were regressed against these DTI indices, age, and total intracranial volume. In Parkinson’s patients, FA was related to executive composite scores, and both indices were related to Stroop interference scores. We conclude that white matter microstructural abnormalities contribute to cognitive deficits in Parkinson’s disease. Further work is needed to determine whether these white matter changes reflect the pathological process or a clinically important comorbidity.
Keywords: pathology/physiopathology; imaging, diffusion tensor; magnetic resonance imaging; cognition disorders; aging; Parkinson’s disease, idiopathic
Introduction
Cognitive impairment is common in early Parkinson’s disease (PD) and typically involves domains of immediate memory, psychomotor speed, and executive function (Muslimovic, Post, Speelman, & Schmand, 2005). Proposed mechanisms for these deficits include cholinergic loss, focal cerebral and subcortical volume loss (de la Monte, Wells, Hedley-Whyte, & Growdon, 1989), and loss of dopaminergic input to the striatum with resulting downstream effects on frontal subcortical networks. These networks participate in motor, attentional, visuospatial, and affective functions necessary for goal-directed behavior (Alexander, DeLong, & Strick, 1986). Cross-sectional autopsy studies imply that neurodegeneration in PD proceeds in a predictable topographic sequence, with earliest abnormalities in the caudal brainstem and olfactory bulb, later the substantia nigra pars compacta (SNc), and finally the cerebral cortex (Braak et al., 2002). Recently, a number of studies of PD have described microstructural changes in cerebral hemispheric white matter as well as a greater than normal burden of deep white matter ischemic changes (Bohnen & Albin, 2011). The degree to which these white matter abnormalities contribute to cognitive symptoms is not fully understood.
For the present study, magnetic resonance diffusion tensor imaging (DTI) was used as a measure of white matter microstructural integrity. We used tract-based spatial statistics (TBSS; Smith et al., 2006) to map PD-related differences in two commonly reported DTI measures, fractional anisotropy (FA) and mean diffusivity (MD). FA is a measure of the proportion of water diffusion that is directional and thus reflects coherence of white matter tracks; MD is a measure of the magnitude of free water diffusion, which increases with degeneration of microstructural barriers such as cell membranes (Rae et al., 2012). Since several groups have reported DTI changes in hemispheric white matter in PD, the primary goal of the present study was to determine the extent to which these changes were related to cognition. We hypothesized that higher mean FA and lower mean MD within pre specified frontal subcortical white matter tracks would correspond to preserved executive function in PD patients.
Materials and Methods
Subjects
Imaging and cognitive data acquired from 15 patients with early-stage PD were compared to those from 15 age-matched controls. PD subjects were recruited from local movement disorders clinics and met U.K. brain bank criteria for idiopathic PD (Gibb & Lees, 1988). Healthy control subjects were imaged and underwent cognitive testing as part of a longitudinal study of aging (Sager, Hermann, & La Rue, 2005). For all subjects, major psychiatric or medical disease, dementia, and history of head trauma, and abnormal structural brain MRI were exclusion criteria. Of the PD patients, eight had left arm motor symptom onset, and 7 right; mean Hoehn and Yahr stage was 1.63 (Hoehn & Yahr, 1967). Mean disease duration from onset of motor symptoms was 5.6 years (SD 5 years). Mean Unified Parkinson’s disease Rating Scale (UPDRS) total and motor sub scores (off anti-Parkinson medications for 12-18 hours) were 15.6 (SD 6), and 10 (SD 12) respectively. Of PD subjects, 5 were taking monoamine oxidase inhibitors, 7 dopamine agonists (pramipexole or ropinerole), and three carbidopa/levodopa (750–1200 mg of levodopa daily). The study was approved by the local IRB and written informed consent was obtained from all participants.
Neuropsychological testing
The neuropsychologist (B. Bell) performed cognitive testing in the morning after PD patients had taken their regular anti-Parkinson medications. The test battery was designed to evaluate intellectual ability, psychomotor speed, language, verbal memory, and executive function. For the present study we generated a composite Z score for executive function from the Trail Making Test part B minus part A time difference (TMT B - A; Reitan, 1992), Wisconsin Card Sorting Test-64 perseverative responses score (WCST-64; Paolo, Axelrod, Troster, Blackwell, & Koller, 1996), and phonemic fluency/Controlled Oral Word Association Test score (COWAT; Benton, Hamsher, & Sivan, 1983). First, Z scores for the separate tests were calculated by dividing the difference between each individual’s score and the control group mean by the control group standard deviation. For each test, the control group mean then corresponded to Z=0 and 1 SD for the control group defined one Z point. Then, Z scores from tests in which higher scores indicate worse performance (TMT B-A and WCST-64 perseverative errors) were multiplied by -1 and then averaged with the COWAT Z score to produce a composite executive function Z score. The Stroop task interference score was analyzed separately because it was only available for PD subjects. Stroop interference scores estimate the impact of (color-word) interference on processing speed; positive scores indicate better than projected performance (Golden, 1975).
Image acquisition
Subjects were scanned on a General Electric 3.0 Tesla SIGNA (Waukesha, WI) MRI system using an 8-channel head coil. DTI was acquired using a diffusion-weighted, spin-echo, single-shot, echo planar pulse sequence with 25 encoding directions, Array Spatial Sensitivity Encoding parallel imaging (undersampling R=2 in the phase encoding direction), and one non-diffusion-weighted volume. The cerebrum was covered in 48 contiguous, 3.0 mm thick axial slices of TR = 1200 ms, TE = 73-84 ms, FOV =240 ms, flip angle 90 degrees, matrix = 80×80 to yield 2.4×2.4×3.0 mm voxels. High order shimming was performed immediately prior to DTI. A magnetization-prepared rapid gradient echo (MPRAGE) T1-weighted volume (TR 6.6 ms, TE 2.8 ms, flip angle 8 degrees, inversion time 900 ms, field of view 260 mm, slice thickness 1.2 mm) was acquired for computation of total intracranial volume (TICV). A fluid suppressed inversion recovery (FLAIR) sequence (for PD: 2.4 mm axial slices of TR=8502 ms, TE 140 ms, Inversion time 2250 ms, field of view 240 mm; for controls: 1.2 mm Sag slices of TR 6200, TE 141, inversion time 1872, field of view 260) was acquired for quantification of white matter hyperintensities (WMH). PD patients were off anti-Parkinson medication for 6 hours prior to scanning for the purpose of functional MRI studies not reported here.
Image processing
Digital communications in medicine (DICOM) single-slice images were converted to Neuroimaging Informatics Technology Initiative (NIFTI) volumes in AFNI (http://afni.nimh.nih.gov) and visually inspected for artifacts. DTI volumes were corrected for eddy current-related distortions and diffusion parameters estimated in FSL 4.1.6 (http://www.fmrib.ox.ac.uk/fsl). Subject-specific FA and MD maps were processed using TBSS. This method uses precise registration and sampling techniques (without smoothing) to generate a group-specific skeleton of major white matter tracks in Montreal Neurological Institute (MNI) space onto which FA or MD values for individual subjects are mapped. Options exercised during this automated processing stream included use of a group-specific (1×1×1mm) target and FA skeleton threshold of > 0.2. The group-specific target is expected to improve registration for aged and disease groups, in which brain and ventricular volume may vary.
Since the major hypothesis of this study was that executive function would be related to DTI indices from tracks that specifically convey frontal-subcortical connections, we then imposed an a priori anatomical mask. The mask (Figure 1, inset) consisted of the conjunction of the inferior frontal gyrus - pars triangularis, inferior frontal gyrus - pars operculis, middle frontal gyrus, and superior frontal gyrus from the Harvard-Oxford cortical structural atlas, provided by FSL. We dilated the mask by 1-2 voxels to ensure full coverage of frontal subcortical white matter tracts. We then (“blindly”) extracted mean individual subject FA and MD values from non-zero voxels within this pre-specified mask to serve as DTI indices in the statistical analyses (FA index, MD index).
Figure 1. Relationship of DTI indices to executive scores.
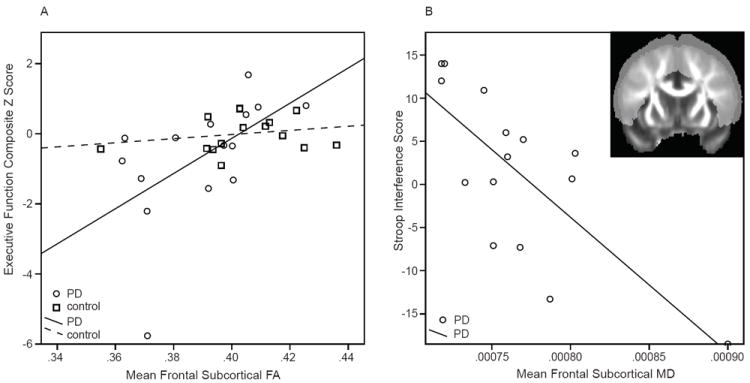
A. Executive composite Z scores versus fractional anisotropy (FA) index in PD (circles) and control (square) subjects.
B. Stroop interference scores (available for PD subjects only) versus MD index.
Inset: Coronal FA map showing the a priori mask that was used to extract DTI indices.
Because DTI changes in hemispheric white matter could be related to subcortical volume loss or to an excess of FLAIR MWH, these features were quantified from T1-weighted and FLAIR volumes. T1-weighted volumes were automatically parcellated in Freesurfer 4.5 (surfer.nmr.mgh.harvard.edu) to yield TICV, caudate nucleus, and putamen volumes; the parcellations were visually inspected for errors. For each subject, the sum of right and left caudate nucleus and putamen volumes was expressed as a percentage of TICV.
Due to slight differences in the acquisition of FLAIR images (scalp signal characteristics and signal-to-noise ratio) between PD and control groups, blinded WMH ratings could not be performed. Both sets of images were of sufficient quality that WMH could be measured and counted accurately. From axial FLAIR images, a single rater (C.G.) quantified number, location, and size of WMH to yield a score for each subject based on a semi-quantitative scale (Scheltens et al., 1993). Scheltens scores range from 0-84 with larger numbers indicating a greater burden of WMH. Intra-rater reliability for Scheltens scoring (intraclass correlation coefficient) in our laboratory is 0.9.
Statistical analysis
Data describing participants’ baseline characteristics (age, years of formal education, and gender) were compared between PD and control groups using an unpaired T test in SPSS version 20 (IBM Corp., Armonk, NY). WMH burden, TICV, striatal volumes, and executive function scores, as well as FA and MD indices, were compared between groups using ANCOVA with age and gender as covariates.
DTI values along the skeleton were compared between groups using an unpaired t-test in FSL’s randomise version 2.1 (http://www.fmrib.ox.ac.uk/fsl/randomise). Voxel-wise maps of the t-statistic, family-wise error (FWE) corrected for multiple comparisons using threshold-free cluster enhancement (Smith & Nichols, 2009) were examined at a threshold of p<0.05. Tracks showing between-group differences were described with reference to an MRI atlas of human white matter (Oishi, Faria, Van Zijl, & Mori, 2011).
Linear regression was used to evaluate the extent to which executive composite Z scores (dependent) were related to FA or MD index, group (PD versus control), age, TICV, and DTI index-by-group interaction. (Both TICV and age can have a small effect on FA). Within the PD group, Stroop interference scores were regressed against DTI indexes, age, and TICV.
Results
Baseline characteristics
Age, years of formal education, and WMH burden did not differ between groups (Table). Male gender proportion and TICV were greater in the PD group (p=0.04). FA and MD indices derived from the a priori frontal mask differed between groups. The executive composite Z score was not significantly lower in PD when controlled for age and gender.
Table.
Baseline Data
| Group | Age (yr) | Education (yr) | Gender (% male) | TICV (ml) | WMH Score | Striatal volume (%TICV) | FA Index | MD Index | Executive Z score | Stroop Interference |
|---|---|---|---|---|---|---|---|---|---|---|
| Control Mean (SD) | 60.3 (6.5) | 15.7 (2.3) | 60* | 1435.6*(153) | 2.5(2.1) | 1.13 | 0.404*(0.02) | 0.00072* (0.00003) | 0(.50) | NA |
| PD Mean (SD) | 62.7 (10) | 15.9 (2.4) | 80* | 1551.2*(140) | 3.8(3.9) | 1.14 | 0.390*(0.02) | 0.00078* (0.00008) | -0.65(1.75) | 1.59(9.7) |
Abbreviations: NA, not applicable; TICV, total intracranial volume; WMH, white matter hyperintensity score.
Indicates measures that differ between groups (p<0.05).
TBSS analysis
FA group differences (PD<control; p<0.05 FWE) were present in portions of the anterior limb of internal capsule and anterior corona radiata, body of corpus callosum, sagittal stratum (inferior longitudinal fasciculus and inferior fronto-occipital fasciculus), uncinate fasciculus, and deep cerebellar white mater. FA was also lower in the right midbrain and in white matter subjacent to several frontal, temporal, parietal, and occipital gyri. MD differences (PD>control; p<0.05 FWE) were more extensive than FA changes and present in portions of most tracks.
Relationships between executive function composite Z scores and DTI
The effects of age and TICV were not significant. Higher FA index was related to higher executive function Z scores in the PD but not the control group (DTI index-by-group interaction t[df]=-2.3[5], p=0.03; Figure 1, A). The same results were obtained when the regression analysis was re-run after replacing the score of the PD outlier (executive function composite -5.77) with the next lowest value (-2.21). The MD index was not related to the executive composite Z score. However, both higher FA index and lower MD index were related to higher Stroop Interference scores in PD (|t|[df]=2.5[3], p=0.03; Figure 1, B).
Discussion
This report contributes to accumulating evidence that the microstructural integrity of neocortical white matter is altered in non-demented PD patients (Zhan et al., 2011; Rae et al., 2012). These white matter changes may be related to pathologic mechanisms of PD, or may represent a clinically significant comorbidity. A comparison of white matter lesion burden between groups in our study did not show significant differences, suggesting that the DTI measures may reflect a non-ischemic process. One potential mechanism is Wallerian degeneration of axons due to atrophy and gliosis of subcortical nuclei, which has been described in PD dementia (de la Monte, et al., 1989). We did not find a significant difference in striatal volumes at this early stage of disease, suggesting that DTI may be a more sensitive biomarker for disease pathology than volumetric analyses. In our TBSS analysis, the extent of group differences in MD exceeded that of FA; however, the FA index was more consistently related to executive measures.
A few studies have described relationships between DTI measures and single executive measures in PD. One study found that PD patients who achieved two or fewer categories on the WCST had lower left parietal white matter FA than those with more normal performance (Matsui et al., 2007). Another recent report used a voxel-wise TBSS approach to show that increased FA and decreased MD in several frontal white matter tracks were related to phonemic fluency in PD (Rae et al., 2012). This study was of similar size to the current study and did not measure WMH burden nor cortical/subcortical volumes. Further, a composite executive score is expected to be more reliable as a cognitive index than are single test scores.
In our PD cohort, DTI indices (decreased FA, increased MD) were related to increased susceptibility to interference during the Stroop task. Although frontal lesions produce slow performance on all portions of the Stroop task, lesions of the superior medial prefrontal cortex (supplementary motor area and/or anterior cingulate cortex) disproportionately exacerbate the interference effect (Stuss, Floden, Alexander, Levine, & Katz, 2001). Many functional and physiologic studies show altered activity of the supplementary motor area, which sends projections to the putamen and receives projections from the ventrolateral thalamus as part of the motor circuit, in PD (Alexander, DeLong, & Strick, 1986). It is interesting that impairment on a cognitive task that is sensitive to dysfunction of this circuit was correlated with DTI indices that may reflect the fidelity of its connections.
Limitations
A few limitations should be noted. This pilot study was relatively small, and using a voxel-wise approach may have increased susceptibility to false positive results. Nonetheless, between-group DTI differences were comparable to prior studies and the significant DTI-neuropsychological relationships found in the PD group in contrast to the control group suggests that these DTI changes are indeed a marker for processes that impact cognition in PD.
With reference to covariates considered in the analyses, slight differences in acquisition of the FLAIR images between groups may have produced bias in the WMH ratings (in spite of good intra-rater reliability). PD and control samples were not gender balanced, partially because PD is more prevalent in males. Gender is not reported to have a large effect on DTI; however, in order to control for this limitation, we included TICV (which is correlated with gender and can have a small effect on DTI measures) as covariate in the all of the analyses. Larger sample sizes will be needed in the future to control for potential gender differences and cardiovascular risk factors in the relationship between white matter health and cognitive function. A larger, prospective, longitudinal study will be needed to confirm these preliminary findings.
Acknowledgments
This work was supported by the Department of Veterans Affairs, Veterans Health Administration, Office of Research and Development, Clinical Science Research and Development Service (C.G., V.A. CDA-2) and by the University of Wisconsin Institute for Clinical and Translational Research, funded through a National Institutes of Health Clinical and Translational Science Award, [C.G., grant number 1UL1RR025011]. These funding institutions did not participate in study design, data collection, analysis, interpretation, or reporting. This work was supported with use of facilities at the William S. Middleton Memorial Veterans Hospital Geriatric Research Education and Clinical Center and the Waisman Laboratory for Brain Imaging and Behavior, Madison, WI, USA.
Abbreviations
- ANCOVA
analysis of covariance
- COWAT
controlled oral word association test
- DICOM
Digital Communications in Medicine
- DTI
diffusion tensor imaging
- FA
fractional anisotropy
- FWE
family-wise error corrected
- MD
mean diffusivity
- MNI
Montreal Neurological Institute
- MPRAGE
magnetization-prepared rapid gradient echo
- MRI
magnetic resonance imaging
- NIFTI
Neuroimaging Informatics Technology Initiative
- PD
Parkinson’s disease
- SENSE
sensitivity encoding parallel imaging
- TBSS
tract-based spatial statistics
- TE
echo time
- TICV
total intracranial volume
- TR
repetition time
- UPDRS
Unified Parkinson’s disease Rating Scale
- WCST-64
Wisconsin Card Sorting Test-64
- WMH
white matter hyperintensities
Footnotes
A preliminary report of portions of the information contained in this manuscript was presented in abstract for at the Dublin International Movement Disorders Society Congress in June, 2012; following revision, the current report is significantly different from the abstract.
The authors declare no conflicts of interest.
References
- Alexander GE, DeLong MR, Strick PL. Parallel organization of functionally segregated circuits linking basal ganglia and cortex. Annual Review of Neuroscience. 1986;9:357–381. doi: 10.1146/annurev.ne.09.030186.002041. [DOI] [PubMed] [Google Scholar]
- Benton A, Hamsher D, Sivan A. Multilingual Aphasia Examination. 3. Iowa City: AJA Associates; 1983. [Google Scholar]
- Bohnen NI, Albin RL. White matter lesions in Parkinson disease. Nature reviews Neurology. 2011;7(4):229–236. doi: 10.1038/nrneurol.2011.21. [DOI] [PMC free article] [PubMed] [Google Scholar]
- Braak H, Del Tredici K, Bratzke H, Hamm-Clement J, Sandmann-Keil D, Rub U. Staging of the intracerebral inclusion body pathology associated with idiopathic Parkinson’s disease (preclinical and clinical stages) Journal of Neurology. 2002;249(Suppl 3):III/1–5. doi: 10.1007/s00415-002-1301-4. [DOI] [PubMed] [Google Scholar]
- de la Monte SM, Wells SE, Hedley-Whyte T, Growdon JH. Neuropathological distinction between Parkinson’s dementia and Parkinson’s plus Alzheimer’s disease. Annals of Neurology. 1989;26(3):309–320. doi: 10.1002/ana.410260302. [DOI] [PubMed] [Google Scholar]
- Gibb WR, Lees AJ. The relevance of the Lewy body to the pathogenesis of idiopathic Parkinson’s disease. J Neurol Neurosurg Psychiatry. 1988;51(6):745–752. doi: 10.1136/jnnp.51.6.745. [DOI] [PMC free article] [PubMed] [Google Scholar]
- Golden CJ. The measurement of creativity by the Stroop Color and Word Test. Journal of Personality Assessment. 1975;39(5):502–506. doi: 10.1207/s15327752jpa3905_9. [DOI] [PubMed] [Google Scholar]
- Grambaite R, Selnes P, Reinvang I, Aarsland D, Hessen E, Gjerstad L, Fladby T. Executive Dysfunction in Mild Cognitive Impairment is Associated with Changes in Frontal and Cingulate White Matter Tracts. Journal of Alzheimer’s Disease. 2011;27(2):453–62. doi: 10.3233/JAD-2011-110290. [DOI] [PubMed] [Google Scholar]
- Hoehn MM, Yahr MD. Parkinsonism: onset, progression and mortality. Neurology. 1967;17(5):427–442. doi: 10.1212/wnl.17.5.427. [DOI] [PubMed] [Google Scholar]
- Matsui H, Nishinaka K, Oda M, Niikawa H, Komatsu K, Kubori T, Udaka F. Wisconsin Card Sorting Test in Parkinson’s disease: diffusion tensor imaging. Acta neurologica Scandinavica. 2007;116(2):108–112. doi: 10.1111/j.1600-0404.2006.00795.x. [DOI] [PubMed] [Google Scholar]
- Muslimovic D, Post B, Speelman JD, Schmand B. Cognitive profile of patients with newly diagnosed Parkinson disease. Neurology. 2005;65(8):1239–1245. doi: 10.1212/01.wnl.0000180516.69442.95. [DOI] [PubMed] [Google Scholar]
- Oishi K, Faria A, Van Zijl PCM, Mori S. MRI atlas of human white matter. 2. London, UK: Elsevier Academic Press; 2011. [Google Scholar]
- Paolo AM, Axelrod BN, Troster AI, Blackwell KT, Koller WC. Utility of a Wisconsin Card Sorting Test short form in persons with Alzheimer’s and Parkinson’s disease. Journal of Clinical and Experimental Neuropsychology. 1996;18(6):892–897. doi: 10.1080/01688639608408310. [DOI] [PubMed] [Google Scholar]
- Reitan R. Trail Making Test. Manual for administration and scoring. Tucson, AZ: Reitan Neuropsychological Laboratory; 1992. [Google Scholar]
- Rae CL, Correia MM, Altena E, Hughes LE, Barker RA, Rowe JB. White matter pathology in Parkinson’s disease: The effect of imaging protocol differences and relevance to executive function. NeuroImage. 2012;62(3):1675–1684. doi: 10.1016/j.neuroimage.2012.06.012. [DOI] [PMC free article] [PubMed] [Google Scholar]
- Sager MA, Hermann B, La Rue A. Middle-aged children of persons with Alzheimer’s disease: APOE genotypes and cognitive function in the Wisconsin Registry for Alzheimer’s Prevention. Journal of Geriatric Psychiatry and Neurology. 2005;18(4):245–249. doi: 10.1177/0891988705281882. [DOI] [PubMed] [Google Scholar]
- Scheltens P, Barkhof F, Leys D, Pruvo JP, Nauta JJ, Vermersch P, Valk J, et al. A semiquantative rating scale for the assessment of signal hyperintensities on magnetic resonance imaging. Journal of the Neurological Sciences. 1993;114(1):7–12. doi: 10.1016/0022-510x(93)90041-v. [DOI] [PubMed] [Google Scholar]
- Stuss DT, Floden D, Alexander MP, Levine B, Katz D. Stroop performance in focal lesion patients: dissociation of processes and frontal lobe lesion location. Neuropsychologia. 2001;39(8):771–786. doi: 10.1016/s0028-3932(01)00013-6. [DOI] [PubMed] [Google Scholar]
- Smith SM, Jenkinson M, Johansen-Berg H, Rueckert D, Nichols TE, Mackay CE, Behrens TE, et al. Tract-based spatial statistics: voxelwise analysis of multi-subject diffusion data. NeuroImage. 2006;31(4):1487–1505. doi: 10.1016/j.neuroimage.2006.02.024. [DOI] [PubMed] [Google Scholar]
- Smith SM, Nichols TE. Threshold-free cluster enhancement: addressing problems of smoothing, threshold dependence and localisation in cluster inference. NeuroImage. 2009;44(1):83–98. doi: 10.1016/j.neuroimage.2008.03.061. [DOI] [PubMed] [Google Scholar]
- Zhan W, Kang GA, Glass GA, Zhang Y, Shirley C, Millin R, Schuff N, et al. Regional alterations of brain microstructure in parkinson’s disease using diffusion tensor imaging. Movement disorders. 2012;27(1):90–97. doi: 10.1002/mds.23917. [DOI] [PMC free article] [PubMed] [Google Scholar]