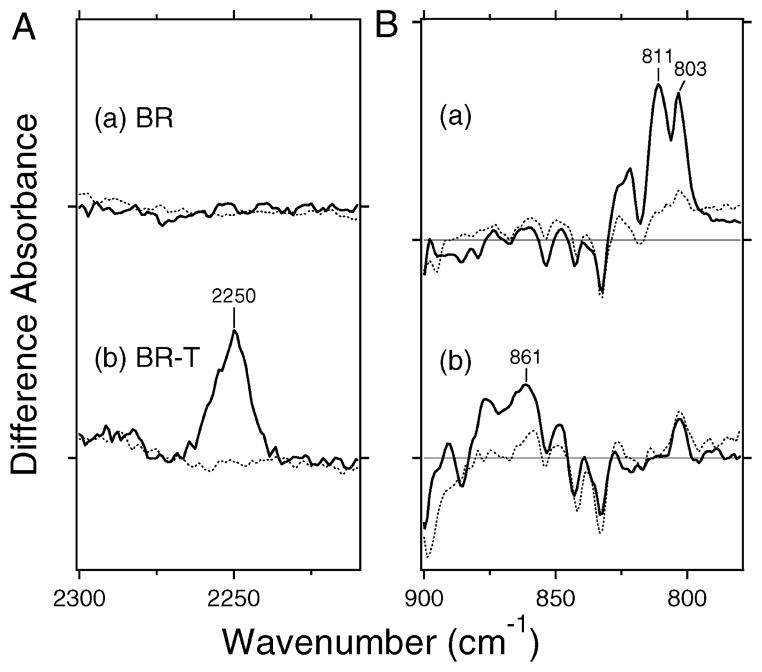
Figure 3.
(A) Difference spectra of BR (a) and BR-T (b) in the 2300–2210 cm−1 region. The solid line represents the spectrum for the C14D-labeled retinal, while the dotted line corresponds to that for the unlabeled retinal. Vertical amplitudes are normalized by the bands to wild-type SRII (Figure 2a) by the C–C stretch at 1204 (−) cm−1 (unlabeled retinal). Those for the C14D-labeled retinal are then normalized to those for the unlabeled retinal by the amide I bands at 1639 (−)/1623 (+) (a) and 1640 (−)/1623 (+) (b) cm−1 (see Figure S1 in detail). One division of the y-axis corresponds to 0.0003 absorbance unit. (B) Difference spectra of BR (a) and BR-T (b) in the 900–780 cm−1 region. The solid line represents the spectrum for the unlabeled retinal, while the dotted line corresponds to that for the C14D-labeled retinal. One division of the y-axis corresponds to 0.002 absorbance unit.

