

Abstract
The vertebrate nervous system is characterized by myelination, a fundamental biological process that protects the axons and facilitates electric pulse transduction. Damage to myelin is considered a major effect of autoimmune diseases such as multiple sclerosis (MS). Currently, therapeutic interventions are focused on protecting myelin integrity and promoting myelin repair. These efforts need to be accompanied by an effective imaging tool that correlates the disease progression with the extent of myelination. To date, magnetic resonance imaging (MRI) is the primary imaging technique to detect brain lesions in MS. However, conventional MRI cannot differentiate demyelinated lesions from other inflammatory lesions, and therefore cannot predict disease progression in MS. To address this problem, we have prepared a Gd-based contrast agent, termed MIC (Myelin Imaging Compound), which binds to myelin with high specificity. In this work, we demonstrate that MIC exhibits a high kinetic stability towards transmetallation with promising relaxometric properties. MIC was used for in vivo imaging of myelination following intracerebroventricular infusion in the rat brain. MIC was found to distribute preferentially in highly myelinated regions and was able to detect regions of focally induced demyelination.
Keywords: multiple sclerosis, myelination, magnetic resonance imaging, contrast agents, gadolinium
INTRODUCTION
In the vertebrate nervous system, rapid and efficient signal transduction of nerve impulses is fostered by the presence of myelin sheaths, which wrap around axons and provide electrical insulation. Myelin is composed of a complex mixture of lipids and proteins, with the lipids accounting for 70–85% of its dry weight and the remaining being composed of proteins.1 Disruption of myelination is a major event in many acquired or inherited neurodegenerative diseases such as MS and various leukodystrophies. MS is characterized by demyelination in the central nervous system (CNS), which affects an estimated 350,000 people in the US and 2 million people worldwide.2 Current diagnosis, prognosis, and therapeutic interventions of MS intimately depend on the ability to assess myelin changes in the brain. To date, MR imaging has been used as the first-line modality for non-invasive detection of brain lesions in MS. However, conventional MR imaging techniques do not provide information about the myelination status of the brain. The hyper-intensity observed on T2 weighed images of MS lesions is primarily related to increased water content and reflects a broad spectrum of tissue damage, which may be caused by not only demyelination but also inflammation, edema, Wallerian degeneration, or axonal loss.
As a result, conventional MRI does not permit differentiation between demyelination and inflammation. The lesion load detected by conventional MRI is often dissociated from disease progression. This dissociation was evidenced by a clinical study of interferon-β measured by conventional MRI parameters. In that study, the magnitude of the treatment effect on MRI and clinical outcomes is quantitatively different, with 38.9% of the treated group demonstrating confirmed progression in expanded disability status scale despite stabilization of total lesion volume and a reduction in new lesion activity of 57.3%. It concluded that “…the modest overall nature of the clinical–MRI correlations suggests that it would be unwise to rely on measurement based on T2 -weighted or Gd-enhanced lesions alone as the primary efficacy variables”.3
To address this problem, a number of advanced MRI methods are being developed, which promise to increase selectivity and specificity and to provide more detailed information about MS pathology. Among them, magnetization transfer (MT) has been shown to be sensitive to changes in myelin content.4,5 Since MT is dependent on the specific pulse sequence and hardware, “quantitative magnetization transfer” methods6–9 have also been developed that allow the quantification of the fractional size of the pool of protons whose diffusion is restricted by myelin, which could be ultimately related to the degree of myelination.10 Furthermore, the quantitative measurement of the fraction of water that is associated with myelin (myelin water fraction or MWF) has been used to obtain an indirect assessment of the level of myelination. The MR water signal in the nervous systems arises from three components with distinctively different T2: i) cerebrospinal fluid (>1.5 s), ii) intracellular and extracellular water (ca. 100 ms), and iii) MWF (20–50 ms). Quantification of the shortest T2 component fraction has been related to the distribution of myelin,11 however the measurement of the MWF remains technically challenging. Moreover, the presence of axon cytoskeletons and myelin membranes leads to orientationally restricted diffusion of water molecules. This is exploited in diffusion weighed imaging (DWI) and diffusion tensor imaging (DTI) for the assessment of anomalies in white matter diseases.12,13 In general, these new techniques have improved sensitivity and specificity for the detection of lesions with respect to traditional MR imaging and provide more quantitative information to extend our knowledge of MS processes. However, these new methods have yet to demonstrate a higher sensitivity then traditional MR to the detection of MS.
Alternatively, the development of MR contrast agents that can efficiently and selectively label myelin fibers in living organisms could improve the sensitivity of traditional and advanced MR methods for the detection of MS lesions. Until now, the diagnosis of demyelinating diseases like MS is obtained following a set of criteria recommended by the International Panel on MS Diagnosis, which combines a number of clinical and paraclinical observations. MRI, although playing a fundamental role in the diagnosis of MS, has not been accepted as a primary measure of disease activity because of its lack of specificity.
To date, clinical contrast agents such as Gd-DTPA (DTPA = diethylene triamine pentaacetic acid) are widely used for MR studies in MS patients. The use of these contrast agents is possible due to the fact that the blood-brain-barrier (BBB) is often disrupted in MS patient. Thus, Gd-DTPA enhancement increases the reliability and sensitivity of detecting active lesions. However, none of the clinical contrast agents exhibit any affinity and specificity for myelin, lesion enhancement by these agents is mainly indicative of disruption of the BBB. No information can be extracted from these images regarding the myelination status in detected lesions. Recently gadofluorine, a fluorinated T1 MR agent, has been described. Currently, it is being investigated for its ability to detect brain lesions with high sensitivity in MR images.14,15 Gadofluorine binds extracellular matrix proteins with high affinity. These proteins become accessible due to BBB or blood to nerve barrier (BNB) disruption resulting from inflammatory processes; thus, gadofluorine enhancement does not reflect the tissue myelination status. The lack of specificity for myelination hampers the use of MR for the unequivocal diagnosis of demyelinating diseases like MS. Subsequently, the use of MRI as a primary measure of disease activity still has not been accepted by the Federal Drug Administration (FDA). The development of myelin-targeting contrast agents is crucial in order to improve the myelin imaging specificity of MRI for efficacy evaluation of novel myelin repair therapies currently under development.
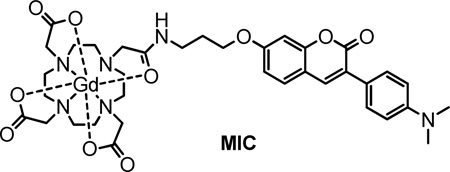
For this reason, we exploited the myelin-specific probes that have been identified in our laboratory16–23 to develop a myelin-targeting contrast agent through conjugation with a paramagnetic Gd-complex. Our previous structure-activity relationship studies of coumarin derivatives led us to identify a lead compound, named Case Imaging Compound (CMC), which readily crosses the BBB and selectively binds to myelin sheaths in vivo.17 We found that the structure of CMC can be selectively modified without adversely affecting its binding affinity and specificity for myelin. To develop a contrast agent for MR imaging, we explored the possibility of introducing a linker in the 3-position so that CMC could be conjugated to a gadolinium complex based on a DOTA derived monoamide macrocyclic ligand (DOTA = 1,4,7,10-tetraazacyclododecane-1,4,7,10-tetraacetic acid). The choice of this ligand was guided by the need to obtain a highly stable and inert gadolinium complex to avoid the release of toxic gadolinium aquo-ion. Macrocyclic ligands derived from DOTA are known to provide gadolinium complexes with a large formation constant and are particularly inert towards transmetallation with endogenous cations.24–26 Following these considerations, we have developed MIC (compound 10 Figure 1), the first Gd-based contrast agent that specifically binds to myelin. Compound 10 was prepared by conjugation of a gadolinium DOTA monoamide complex to CMC and exhibits promising MR properties.27
Figure 1.

Reaction scheme for the preparation of compound 10, a myelin targeted MR contrast agent.
We have recently shown that 10 accumulates preferentially in highly myelinated regions in mouse brain tissue blocks. In this report, we demonstrate the effectiveness of 10 to enhance highly myelinated brain regions in T1 weighed MR imaging of live rat models. Our studies show that 10 accumulates preferentially in myelinated regions after stereotaxic injection in the lateral ventricles, and that T1 shortening can be readily visualized through MR T1 mapping. Here, we report the full account of the synthesis of compound 10 and its use as a MR contrast agent for in vivo imaging of myelination.
RESULTS
Chemical synthesis
The synthesis of compound 10 is illustrated in Figure 1. A Perkin condensation of 1 and 2 followed by acid hydrolysis afforded the coumarin derivative 4 in 27% yield. A three-carbon linker was introduced to the 3-position of 4 by reaction of 4 with Boc-protected 3-bromopropylamine in acetonitrile at 70 °C in presence of cesium carbonate, which afforded 5 in 79% yield. Boc- deprotection under acidic conditions afforded 6 in 93% yield as a free amine after basic extraction. The lanthanide chelator was then introduced by reacting DOTA-tris-t-butyl ester (7) with 6 using an HBTU-mediated coupling (HBTU = O-(Benzotriazol-1-yl)-N,N,N′,N′-tetramethyluronium hexafluorophosphate). The protected ligand 8 was obtained in 66% yield. tert-Butyl deprotection in neat TFA provided the free ligand 9 in quantitative yield as a trifluoroacetate salt, which was then complexed with GdCl3 in water at pH 6 and 50 °C to give 10.
Transmetallation stability
To determine the transmetallation stability of 10, we used a method developed by Muller and coworkers to assess the resistance of gadolinium complexes against transmetallation in a highly competitive environment.28,29 Thus, a solution of 10 and ZnCl2 in phosphate buffer was incubated at 40 °C. Gadolinium phosphate is characterized by a very low solubility product (Ksp=10−25.6 M2).30 In the event that Zn(II) displaced the Gd(III) ions from the coordination cage, the Gd ions would rapidly precipitate as insoluble phosphate and its contribution to the observed longitudinal relaxation rate of solvent water protons would be negligible. For this reason, the transmetallation reaction could be followed by monitoring the proton longitudinal relaxation rate of the solution versus time. The relaxation rate of a 2.5 mM solution of 10 in presence of 2.5 mM ZnCl2 in phosphate buffer (50 mM, pH 7) incubated at 40 °C is approximately constant over a period of four days (Figure 2). This is comparable with the trend shown by other clinical macrocyclic complexes such as GdDOTA and GdHPDO3A (HP-DO3A = 10-(2-hydroxypropyl)-1,4,7-tetraazacyclododecane-1,4,7-triacetic acid).
Figure 2.

Evolution of the relative water proton paramagnetic longitudinal relaxation rate (R1(t)/R1(t=0)) of three commercial MR agents: GdDOTA (circle), GdHPDO3A (triangle), and GdDTPA (square) compared to 10 (diamond) (2.5mM). All agents are in a phosphate buffer solution (50 mM, pH 7.0) in presence of ZnCl2 (2.5mM). Figure is adapted in part from ref.29
Relaxometric characterization
The relaxivity of 10 at three magnetic field strengths was measured in water and compared to two clinical MR contrast agents, GdDOTA and GdDTPA (Table 1). The longitudinal relaxivity (r1) of 10 was determined by measuring the longitudinal relaxation rate of five solutions of compound 10 with concentrations in the range of 0–1 mM. The relaxation rates were fitted to Equation 1 to obtain the relaxivity of 10. The longitudinal relaxation rate of the prepared solutions was measured using a standard inversion-recovery technique paying attention to leave a relaxation delay of at least five times T1 between each successive scans. The longitudinal relaxivity of 10 measured at 0.47 and 1.41 T at 40 °C is 1.5–1.7 times higher than GdDOTA or GdDTPA. At 9.4 T and 20 °C, the relaxivity of 10 is approximately 1.3 times higher than the other Gd-complexes as shown in Table 1.
Table 1.
Longitudinal relaxivity with relative standard deviation of compound 10 and two commonly used Gd contrast agents, GdDOTA and GdDTPA, at three magnetic field strengths. Relaxivity values for GdDOTA and GdDTPA have been obtained from the literature.
| Magnetic Field Strength (T) |
10 r1 (s−1 mM−1) |
GdDOTA r1 (s−1 mM−1) |
GdDTPA r1 (s−1 mM−1) |
|---|---|---|---|
| 9.4 | 5.2±0.1a | 3.9 31 | 4.1 31 |
| 1.41 | 5.1±0.1b | 2.9±0.2c, 32 | 3.3±0.2c, 32 |
| 0.47 | 5.8±0.2b | 3.4±0.2 32 | 3.4±0.2 32 |
T=21°C;
T=40°C;
1.5 T, T=37°C.
In vitro staining of myelin
Compound 10 is a fluorescent compound with maximal excitation and emission at 340 nm and 423 nm, respectively. We thus evaluated myelin-binding properties of 10 through fluorescent staining in mouse brain tissue sections. Compound 10 selectively stains myelinated fibers in myelin-rich white matter regions such as the corpus callosum, striatum, and cerebellum after chemical staining of freshly frozen mouse brain sections (Figure 3A). Compound 10 staining was significantly lower in gray matter than in myelin-rich white matter. The observed staining pattern of compound 10 is consistent with that of immunohistochemical staining for myelin basic protein (MBP) (Figure 3B) and Luxol Fast Blue (LFB) staining of adjacent sections (Figure 3C), suggesting that 10 binds selectively to myelin membranes.
Figure 3.

(A) Compound 10 staining of a mouse brain section in vitro showing all the myelinated regions, which was consistent with immunohistochemical staining of MBP (B) and LFB (C) staining in an adjacent sections. (D) In vitro compound 10 staining of a shiverer mouse brain section showing remarkably reduced myelination in the corpus callosum, as confirmed by immunohistochemical staining of MBP (E) and LFB (F) staining in an adjacent section. For comparison, in vitro fluorescent tissue staining with CMC (G) and dMCMC (H), in wild-type mouse brain sections are presented. Stained areas can be identified in scheme I; 1=external capsule, 2=corpus callosum, 3=anterior commissure (anterior part), 4=caudate putamen (striatum) (reproduced with permission from ref 33). Scale bars =1 mm.
The binding of 10 to myelin was found to be proportional to the myelin content. This was revealed by staining brain tissue sections of C3Fe.SWV-Mbpshi/J shiverer mice, an autosomal recessive mutant with myelin deficiency in the CNS (Figure 3 D–F). Compound 10 staining was consistent with the hypomyelination that is characteristic of the shiverer mouse brain. For example, the fluorescent intensity in the corpus callosum region was remarkably lower than that in the wild-type control mice. The hypomyelination was also confirmed by immunohistochemical staining for MBP, suggesting that compound 10 distributes in the brain in proportion to the myelin content.
Compound 10 chemical staining of wild-type mouse brain tissue sections was compared with the staining of the parent myelin targeted agents, CMC and the dimethylamine derivative of CMC (dMCMC).17 The staining pattern observed with 10 was consistent with the patterns observed with CMC and dMCMC (Figure 3). This result suggests that structural modification of our previously identified myelin-targeting coumarin derivatives did not negatively alter the myelin-binding properties. This is important as it allows us to exploit small-molecule myelin-imaging probes to develop Gd-based contrast agents for MR imaging of myelination.
In order to determine the potential of compound 10 to monitor demyelination and remyelination processes, in vitro staining was performed using L-α-lysophosphatidylcholine (LPC)-treated rat models and cuprizone treated mouse models, two common animal models of demyelination and remyelination.
LPC is a toxic chemical that has been shown to induce focal demyelination followed by remyelination in rodents.34 A LPC solution was stereotaxically injected into the right external capsules (ec) of six Sprague-Dawley rats (Figure 4, white arrows). Three animals were sacrificed after seven days, a time that was sufficient for the development of a conspicuous demyelinated lesion. Three animals were sacrificed after 30 days, a period sufficient for spontaneous remyelination to occur. The brains were extracted and frozen sections were prepared. Chemical staining with compound 10 displays the presence of a large demyelinated region in the external capsule in rats that were sacrificed seven days post-LPC injection. Rats that were sacrificed 30 days post-LPC injection showed instead a normal myelination pattern in correspondence of the injection site. The demyelinated nature of the lesion was confirmed by immunohistochemical staining for MBP and by chemical staining with LFB on adjacent brain sections (Figure 4).
Figure 4.

Chemical staining with compound 10 of brain sections of LPC treated rats during demyelination (A) and remyelination (B). The correspondence of MIC fluorescence with myelin distribution within the brain was confirmed by immunohistochemical staining for MBP (C, demyelination; D, remyelination) and LFB staining (E, demyelination; F, remyelination). Stained areas can be identified in scheme G: 1=external capsule, 2=corpus callosum, 3=anterior commissure (anterior part), 4=caudate putamen (striatum) (reproduced with permission from ref35). Scale bars = 1 mm.
The ability of compound 10 to monitor demyelination and remyelination phenomena was further confirmed using cuprizone treated wild type mice. In this model of toxic demyelination, mice are fed with the copper chelator cuprizone, which induces oligodendrocyte cell death and consequently demyelination. In this model, remyelination start to occur only few days after the suspension of the cuprizone treatment. Chemical staining with compound 10 on brain sections prepared from mice that were fed with cuprizone for four weeks, close to the peak of demyelination, showed a large demyelinated area within the corpus callosum. The same region showed almost no abnormality in brain sections prepared from mice sacrificed ten days after the withdrawal of the cuprizone treatment (Figure 5).
Figure 5.

Chemical staining with compound 10 of brain sections of cuprizone treated mice during demyelination (A) and remyelination (B). The correspondence of MIC fluorescence with myelin distribution within the brain was confirmed by immunohistochemical staining for MBP (C, demyelination; D, remyelination) and LFB staining (E, demyelination; F, remyelination). Stained areas can be identified in scheme G, 1=external capsule, 2=corpus callosum, 3= internal capsule (reproduced with permission from ref 33). Scale bars = 1 mm.
In vivo MR imaging of myelin following intra-cerebroventricular administration
Compound 10 is a polar compound that is not permeable across the BBB. For this reason, we evaluated the brain biodistribution of 10 after intra-cerebroventricular infusion to bypass the BBB. Sprague-Dawley rats were anesthetized and 10 (2–10 UL, 20–100 nmol) was administered via stereotaxic injection to the lateral ventricles (LV). After injection, the rats were allowed to recover. Five to seven hours post injection, the animals were imaged using a spin-echo multiple TR saturation recovery method. T1 maps were generated using the QuickVol II plugin in ImageJ.36 Compound 10 induced a dramatic shortening of T1 that was clearly visible at a dose of 20 nmol (ca. 1 mg/kg).
The analysis of the T1 maps acquired 5–7 h post-injection reveals that 10 was selectively localized in the highly myelinated corpus callosum and striatum following diffusion from the site of injection (Figure 6). T1 maps acquired more than 24h post-injection continued to show a conspicuously visible corpus callosum, although characterized by a relatively longer T1, indicating that compound 10 had largely been cleared. Animals injected with 10 recovered fully after the injection procedure and did not show any motor or behavioral deficiency for up to 3 weeks post-injection. These studies suggest that, once delivered to the brain, 10 can selectively localize in different brain regions in proportion to myelin content.
Figure 6.

T1 maps (spin-echo multiple TR saturation recovery, TE=6.99 ms, TR=385–12500 ms, spatial resolution=0.195×0.195 mm/pixel, matrix size=256×256, 30 slices, slice thickness=0.5mm, 1 average) of a Sprague-Dawley rat brain proximal to the injection site 5h (A) and 28h (B) post-injection and relative anatomical MR images (C, 5h; D, 28h) (RARE, TE =11.3 ms, TR=5000 ms, spatial resolution=0.195×0.195 mm/pixel, matrix size 256×256, 30 slices, slice thickness=0.5mm, 1 average)
In situ staining of myelin
We studied the in situ staining with compound 10 following intraventricular injection in wild-type Sprague-Dawley rats. The rats that were used for MR imaging were euthanized and perfused to remove the blood. The brains were extracted and dissected to prepare frozen axial sections. Fluorescent microscopy showed that 10 was selectively localized to myelinated regions such as corpus callosum and striatum (Figure 6A). The fluorescence of 10 in the brain could be visualized up to six days post injection. The same sections were then subjected to immunohistochemical staining for MBP. As shown in Figure 6, the pattern of staining with compound 10 (blue) is consistent with the pattern of MBP immunochemical staining (red). Compound 10 fluorescence was primarily retained in myelin-rich white matter regions such as the corpus callosum and striatum. These data suggest that 10 can selectively label myelin fibers in situ and potentially be used to monitor myelin changes in the course of disease progression.
Imaging of demyelination
The sensitivity of compound 10-enhanced MR to detect demyelinated lesions was evaluated using an LPC-treated rat model. A LPC solution was stereotaxically injected into the right and left external capsules (ec) of the Sprague-Dawley rat brain. The demyelinated lesions were allowed to develop between 11 and 18 days post LPC injection, and compound 10 was stereotaxically injected in the lateral ventricles. T1 maps were then acquired 24h post-injection, which reveals that the retention of compound 10 is conspicuously reduced in the demyelinated lesion region (Figure 8 A–C). After MR imaging the rat brain was extracted and sectioned for fluorescent microscopy. As shown in Figure 8 D, compound 10 binding was significantly reduced in the demyelinated lesions, which resulted in significantly longer T1. The sections containing the demyelinated lesions were also subjected to immunohistochemical staining for MBP (Figure 8 E), which confirmed the presence of the demyelinated lesions.
Figure 8.

(A) Axial anatomical MR image of an LPC treated rat brain showing 11 day (arrow) and 18 day old (arrowhead) lesions in the external capsule (ec). (B) T1 map generated using a multiple TR spin echo sequence and showing longer T1 and less binding of compound 10 in the demyelinated lesion regions. (C) Overlay of MR images confirms the co-localization of the areas of longer T1 and the demyelinated lesions. (D) In situ fluorescent microscopy of brain tissue sections following in vivo compound 10-enhanced MR imaging (EX 340–380 nm; DM 400 nm; BA 435–485 nm). (E) Immunohistochemical staining of the same section for MBP (EX 548–580 nm; DM 595 nm; BA 600–660 nm). (F) Bright field image. Scale Bars A–C = 2.5 mm, scale bars D–F = 400 µm.
DISCUSSION
In most imaging methodologies that make use of contrast media, contrast is generated by the agent’s emission, [e.g. optical imaging, positron emission tomography (PET), single-photon emission computed tomography (SPECT)] or absorption of energy [e.g. computed tomography (CT) and ultrasound (US]. In the case of MRI, contrast is generated by a number of factors including the density of water protons and their longitudinal (R1) and transverse (R2) relaxation times. Paramagnetic agents can alter the proton relaxation rate of the solvent water protons. Gd(III) ions, thanks to their high magnetic moment and long electron relaxation time, are able to efficiently shorten R1 and R2 of the solvent water protons.37 The effectiveness with which a paramagnetic agent is able to shorten the relaxation rate of the solvent water protons, is given by a parameter called relaxivity (ri i=1,2) which represents the increase in relaxation rate of a water solution occurring after the addition of the agent, normalized to a concentration of 1 mM (Equation 1).37
| Equation 1 |
Gd-based contrast agents have been widely used in MR imaging. Gd(III) is the ion of choice for the preparation of MR contrast agents because of its high magnetic moment and slow electron relaxation rate. However, Gd(III) aqua ion is toxic because it forms insoluble phosphate, carbonate, and/or hydroxide complexes in blood at pH 7.4. Moreover it has been shown that Gd(III) is toxic to human cells in vitro38–40 and to rats41 in vivo, likely due to the inhibition of transmembrane currents through Ca(II) channels42,43 or by forming inorganic insoluble salt aggregates with anions such phosphates.44,45
For this reason, Gd(III) must be chelated with ligands that can provide complexes with a high thermodynamic and kinetic stability in order to avoid the release of the toxic Gd aqua ion. For the design of 10, we chose a macrocyclic ligand derived from DOTA over linear ligands derived from DTPA. Macrocyclic ligands are known to generate complexes that couple excellent thermodynamic stability26 to a high kinetic inertness towards dissociation and transmetallation while linear ligands, even when they provide complexes with a high formation constant, are more prone to dissociation and transmetallation.
A semi-quantitative method was used for the evaluation of the stability of MR contrast agents towards transmetallation with Zn(II) ions, which has previously been developed by Laurent et al.28,29 Among the various cations that could potentially compete with Gd(III) in physiological media, Zn(II) is the ion that is more likely to succeed because of its relatively high concentration in plasma (55–125 µmol/L) and relatively high formation constants with polyazapolycarboxylic ligands. Gd complexes with linear ligands derived from DTPA are more susceptible to transmetallation than macrocyclic ligands like DOTA and HP-DO3A. The longitudinal proton relaxation rate of the solutions of these macrocyclic ligands in the assay conditions remains unchanged over the course of more than four days. Similarly, the relaxation rate of a compound 10 solution in the same conditions showed no decrease suggesting a high kinetic stability towards transmetallation (Figure 2).
Small Gd complexes are normally classified as T1 agents because, by virtue of the usually small ratio r2/r1 (r2/r1≈1–2)46 when compared with T2 agents like superparamagnetic iron oxides (r2/r1> 4),47,48 they do not excessively broaden the water proton resonance. For this reason, they can be used to generate positive contrast images, where the image intensity is directly proportional to the agent’s local concentration. Relaxivity is not a constant and it depends on a number of external parameters, such as the applied magnetic field strength and temperature, and on molecular parameters including the number of coordinated water molecule(s) (q), the mean residence time (τM) of the coordinated water molecule(s), and the reorientational correlation time (τR). These molecular parameters can be fine-tuned in order to generate contrast agents with a much higher relaxivity than first generation agents like GdDOTA or GdDTPA.
The optimal combination of these parameters is field and temperature dependent. In general, the maximum achievable relaxivity at high field (B0 > 1.5T, r1 < 10 mM−1 s−1, q=1) is much lower than at low field (0.5–1.5T, r1 > 100 mM−1 s−1, q=1), but the range of values that can produce high relaxivity agents is much wider, making it easier to generate high field-high relaxivity agents. The relaxivity of compound 10 measured at three fields (0.47, 1.41 and 9.4 T) commonly used in clinical and preclinical studies is higher than the relaxivities of GdDTPA and GdDOTA, two commonly used MR contrast agents (Table 1). This higher relaxivity is most likely due to the higher molecular weight and the slower τR of 10.
In order to demonstrate that 10 can be used to image myelin, we investigated its myelin targeting capability by fluorescent tissue stainining on freshly frozen mouse brain sections. In vitro tissue staining on wild type brain sections showed that staining with compound 10 is related to myelin content, with high fluorescent intensity observed in myelinated white matter regions such as the corpus callosum and the striatum and low fluorescent intensity observed in myelin-deficient gray matter regions (Figure 3A), which was consistent with immunohistochemical staining of the same brain tissue sections (Figure 3B). The myelin-binding specificity of 10 was further determined by fluorescent tissue staining in myelin-deficient shiverer mice. Compared to staining in wild-type mouse brains, staining with compound 10 in shiverer mouse brain was significantly reduced due to dysmyelination in the brain (Figure 3 C–D).
An important property that a myelin probe needs to possess is the ability to monitor demyelination and remyelination processes. We examined compound 10 by using LPC rat model and cuprizone mouse model of demyelination and remyelination. These are two common models used to study demyelinating diseases. Both models develop demyelinated lesions that are followed by spontaneous remyelination. LPC is a neurotoxin that induces focal demyelination that peaks around 7 days post stereotactic injection. Cuprizone is another neurotoxin which induces characteristic demyelination in the corpus callosum following oral uptake for a period between 4 to 6 weeks. Tissue staining of brain sections with maximum demyelination showed that retention of compound 10 in the lesion regions was significantly decreased relative to remyelination and healthy controls as visualized by fluorescence microscopy. In contrast, tissue staining of brain sections with subsequent remyelination showed that retention of compound 10 in the affected regions was restored to nearly normal levels.
In our previous report, we showed that 10 could be used to provide in vitro myelin mapping of brain tissue blocks in MR images.27 In order to test the ability of 10 for in vivo imaging of myelination, we investigated the distribution of 10 within the brain in live animals. Compound 10 is a hydrophilic, highly water soluble gadolinium complex with a molecular weight (897 Da) that exceeds 500 Da, a value that is usually recognized as the upper limit for BBB permeability by passive diffusion. Thus, like other clinical contrast agents, 10 is not readily permeable across the BBB. The ability of 10 to detect demyelinated lesions in animal models of demyelinating diseases would depend on the disruption of the BBB. It is important to note that in MS the BBB is normally disrupted where brain lesions are present. Therefore, we expect 10 to be able to cross the compromised BBB similarly to GdDTPA. In the present study, we examined the distribution of compound 10 in the brain of wild type rats with an intact BBB. For this reason, we had to bypass the BBB in order to deliver 10 to brain parenchyma. To date, a number of different drug delivery methods have been devised such as trans-cranial brain delivery, administration of hyperosmolar solutions, use of solvents like DMSO and ethanol, or surfactants like Tween 80 or SDS, among others.49 We opted for the intracerebroventricular infusion route of delivery, which relies on the perfusion of the agent within the brain from the site of injection. As evidenced by T1 maps (Figure 6), compound 10 distributed preferentially in the highly myelinated white matter regions such as the corpus callosum and external capsule in a similar way to what we previously observed in the in vitro studies. Subsequently, the rats that were used for MR imaging were euthanized and the brains extracted and used to prepare frozen sections. Fluorescent microscopy of these tissue sections (Figure 7) showed that staining with compound 10 was consistent with immunohistochemical staining for MBP, which confirms that the distribution of 10 reflects the myelin content in the brain.
Figure 7.

In situ staining with compound 10 of myelin sheaths in the corpus callosum and striatum (A, blue) and MBP staining (B, red), which co-localize in the same sections (C, purple). (Ex 330–380 nm, DM 400 nm, BA 400 nm; scale bar = 400 µm).
To investigate the ability of 10 to detect demyelinated lesions, we studied its distribution in the brain of wild type rats with LPC induced lesions. LPC is a detergent able to induce focal demyelination in the CNS and PNS, followed by remyelination. In the present study, demyelinated lesions were generated by injecting a 1% LPC solution in the external capsule of wild type rat brains. T1 maps show that T1 values in the demyelinated lesions are longer than in adjacent regions in the external capsule, revealing a lower binding of 10 (Figure 8 A–C). The lower concentration of 10 in the demyelinated regions was confirmed by ex vivo fluorescent microscopy. The brain of the LPC rat models was used to prepare frozen sections that were stained with Cy3 labeled anti-MBP antibody. As shown in Figure 8 D–E, the demyelinated lesion, revealed by immunostaining, is co-localized with the area of reduced fluorescence of compound 10.
As expected for many Gd-chelated contrast agents, compound 10 itself is very hydrophilic and does not penetrate the intact BBB. In MS patients, however, the BBB is disrupted, making it possible for compound 10 to enter the brain. Thus, compound 10 could be used for clinical studies in a way similar to Gd-DTPA that is currently used in humans. Lesions detected by Gd-DTPA enhanced MR are not necessarily indicative of myelin pathology. Because Gd-DTPA does not bind to myelin, its uptake only reflects disruption of the BBB where lesions are formed. Compound 10 differs from Gd-DTPA because of its ability to bind myelin sheaths. Uptake of 10 could not only potentially identify disruption of the BBB but also help characterize the myelin content of the lesions. Because MIC binds to myelin specifically, it could provide additional information on the myelin integrity, which is urgently needed for accurate diagnosis and efficacy evaluation of myelin repair therapies currently under development.
CONCLUSION
Myelin damage is a hallmark of many acquired and inherited neurological diseases including MS and various leukodystrophies. To date, MRI has been the primary tool for diagnosing and monitoring the progression of myelin diseases. However, conventional MRI cannot differentiate demyelinated lesions from other inflammatory lesions and therefore the use of MRI as a primary measure of disease activity still has not been accepted by the FDA. Currently, therapeutic interventions are focused on protecting myelin integrity and promoting myelin repair. These efforts need to be accompanied by an effective imaging tool that correlates the disease progression with the extent of myelination. Therefore, there is an urgent need to improve the sensitivity of MRI to the myelination status in the CNS and PNS. We previously reported MIC (compound 10), a myelin specific MR contrast agent, and demonstrated its ability to bind myelin and to produce MR renderings of myelin distribution in mouse brains in vitro. In this report, we have demonstrated that compound 10 is capable of labeling highly myelinated fibers in the brain of living animals when administered by intraventricular injection. Furthermore, compound 10 can be used to detect areas of reduced myelination in a LPC rat model of focal demyelination.
EXPERIMENTAL SECTION
Materials and methods
All chemicals, unless otherwise stated, were purchased from commercial sources and used without further purification. All NMR spectra were acquired on an Inova 400 NMR or on an INOVA 600 NMR system (Varian) equipped with a 5 mm broadband probe. Analytical HPLCs were performed on an Agilent 1100 Series system equipped with a dual channel UV/VIS detector using a Phenomenex 5µ C18(2) 100A (250×4.56 mm, 5 µm) column (4.6 × 250 mm); eluent A: H2O/0.1% TFA, B: MeOH/0.1% TFA, Elution: 10% B 3m, 10% B to 100% B in 15 min; flow rate 1 mL/min). The purity of tested compounds as determined by analytical HPLC were ≥95%. Low resolution ESI-MS were acquired on a Finnigan LCQ Deca. High Resolution ESI-MS were acquired on a Waters Qtof API US instrument at the Chemical Instrumentation Center at Boston University. Relaxivity was measured at 9.4 T on a Varian Inova 400 NMR system equipped with a 5 mm broadband probe at 21 °C and at 0.47 T and 1.41 T on a Bruker minispec at 40 °C. pH Was measured using a PHM210 Standard pH meter (Radiometer Analytical) connected to a symphony pH glass electrode (VWR).
3-(4-(dimethylamino)phenyl)-2-oxo-2H-chromen-7-yl acetate (3)
Compound 1 (2.0 g, 14.5 mmol), 2 (2.6 g, 14.5 mmol), and sodium acetate (2.4 g, 29.0 mmol) were dissolved in acetic anhydride (30 mL) and refluxed overnight. After cooling to room temperature, the mixture was neutralized with 1M NaOH(aq). The solid then was collected and washed with EtOAc. The solid was transferred to an Erlenmeyer and suspended in EtOAc (20 mL). The suspension was refluxed for five minutes. Upon cooling, the suspension was filtered and the solid was dried under vacuum to give product 3 (1.7 g, 36 %) as a yellow solid.
1H NMR (400 MHz, CDCl3): ™2.35 (s, CH3 CO, 3H), 3.01 (s, NCH3, 6H), 6.74–6.79 (m, ArH, 2H), 7.04 (dd, ArH, J=2.1, 8.4 Hz, 1H), 7.12 (d, ArH, J=2.1 Hz, 1H), 7.51 (d, ArH, J=8.5 Hz, 1H), 7.65 (m, ArH, 2H), 7.70 (s, C=CHAr, 1H); 13C NMR (100 MHz, CDCl3): δ 21.07 (CH3CO), 40.22 (CH3N), 109.64 (CHarom), 111.80 (CHarom), 117.95 (Carom), 118.14 (CHarom), 121.87 (Carom), 127.42 (Carom), 127.97 (Carom), 129.23 (CHarom), 135.89 (CHarom), 150.67 (Carom), 151.88 (Carom), 153.30 (Carom), 160.58 (CO), 168.80 (CH3CO); HR ESI-MS (m/z): calcd, 346.1055; found, 346.1047 [M+Na]+.
3-(4-(dimethylamino)phenyl)-7-hydroxy-2H-chromen-2-one (4)
A solution of 3 (3.0 g, 9.3 mmol) in MeOH (20 mL) and 2N HCl(aq) (10 mL) was refluxed for 4h. After cooling to room temperature, the mixture was neutralized with 1M NaOH(aq). The solid was filtered and washed with EtOAc. The solid was transferred to an Erlenmeyer and suspended in EtOAc (20 mL). The suspension was refluxed for five minutes. Upon cooling, the suspension was then filtered and the solid was dried under vacuum to give product 4 (1.96 g, 75%) as a yellow solid.
1H NMR (400 MHz, d6-DMSO): δ2.94 (s, NCH3, 6H), 6.66–6.83 (m, ArH, 4H), 7.48–7.63 (m, ArH, 3H), 8.00 (s, C=CHAr, 1H); HR ESI-MS (m/z): calcd, 282.1130; found 282.1186 [M+H]+.
{3-[3-(4-Dimethylamino-phenyl)-2-oxo-2H-chromen-7-yloxy]-propyl}-carbamic acid tert-butyl ester (5)
To a solution of 4 (0.155 g, 0.55 mmol) and (3-bromo-propyl)-carbamic acid tert-butyl ester (0.164 mg, 0.69 mmol) in dry acetonitrile (5 mL) was added cesium carbonate (0.349 mg, 1.07 mmol). The reaction mixture was stirred at 70 °C and monitored by TLC (MeOH/DCM 2/98, Rf = 0.76) until completion (ca. 20 h). The solvent was removed under reduced pressure and the residue was triturated and then decanted, first with water (2×10 mL) and subsequently with diethyl ether (2×5 mL). The residual solid was dried under reduced pressure to yield compound 5 (0.186g, 79%) as a yellow-orange solid.
1H NMR (400 MHz, CDCl3): δ1.43 (s, CCH3, 9H), 1.99 (m, CH2CH2CH2, 2H), 2.97 (s, NCH3, 6H), 3.32 (m, NCH2, 2H), 4.03 (t, OCH2, J= 5.99 Hz, 2H), 4.88 (t b, NH, 1H), 6.71–6.82 (m, ArH, 4H), 7.35 (d, ArH, J=8.49, 1H), 7.58–7.63 (m, ArCH2, and C=CHAr, 3H); 13C NMR (100 MHz, CDCl3): δ28.29 (CCH3), 29.29 (CH2CH2CH2), 37.59 (NCH2), 40.23 (NCH3), 66.05 (OCH2), 79.11 (CCH3), 100.71 (CH), 111.84 (CH), 112.53 (CH), 113.69 (C), 122.46 (C), 124.57 (C), 128.24 (CH), 129.01 (CH), 136.90 (CH), 150.34 (C), 154.42 (C), 155.89 (CO), 160.89 (C), 161.13 (CO); ESI-MS (m/z): calcd, 439.22; found 439.12 [M+H]+.
7-(3-Amino-propoxy)-3-(4-dimethylamino-phenyl)-chromen-2-one (6)
Compound 5 (0.25 g, 0.57 mmol) was dissolved in trifluoroacetic acid and stirred at room temperature for 12h. The slightly cloudy solution was filtered to remove any insoluble impurity before the solvent was evaporated under reduced pressure. The residue was dissolved in dichloromethane (25 mL) and extracted with 0.2M NaOH(aq) (3×25 mL) to yield 6 (106 mg, 93%) as a glassy yellow solid.
1H NMR (400 MHz, CD3OD): δ 2.19 (dt, CH2CH2CH2, J=7.3, 5.8 Hz, 2H), 3.18 (t, NCH2, J=7.3 Hz, 2H), 3.27 (s, NCH3, 6H), 4.2 (t, OCH2, J=5.8 Hz, 2H), 6.91–6.96 (m, ArH, 2H), 7.57–7.62 (m, ArH, 3H), 7.85–7.90 (m, ArH, 2H), 8.04 (s, C=CHAr, 1H). 13C NMR (150 MHz, 60 °C, DMSO-d6): δ 26.38 (CH2CH2CH2), 35.84 (NCH3), 42.62 (NCH2), 65.44 (OCH2), 100.66 (CH), 112.68 (CH), 113.06 (C H), 116.34 (2XC), 122.31 (C), 129.13 (CH), 129.31 (CH), 139.30 (CH), 146.13 (C), 154.30 (C), 159.68 (CO), 161.02 (CO); ESI-MS (m/z): calcd, 339.17; found 339.19 [M+H]+.
[4,10-Bis-tert-butoxycarbonylmethyl-7-({3-[3-(4-dimethylamino-phenyl)-2-oxo-2H-chromen-7-yloxy]-propylcarbamoyl}-methyl)-1,4,7,10-tetraaza-cyclododec-1-yl]-acetic acid tert-butyl ester (8)
A solution of 6 (0.075 g, 0.222 mmol), DOTA-tris-(t-Bu) ester (7, 0.102 g, 0.177 mmol), HOBT (0.041 g, 0.222 mmol), HBTU (0.101 g, 0.266 mmol), and DIPEA (0.046 g, 0.355 mmol) in dry DMF (10 mL) was stirred at room temperature for 20 h (TLC MeOH/DCM 1/9, Rf=0.66). The solvent was removed under reduced pressure and the residue was triturated with water and then decanted (2×10 mL). The yellow residue was dissolved in DCM (15 mL) and the solution dried over Na2SO4. The solvent was removed under reduced pressure and the residue dissolved in a minimum amount of DCM and purified by preparative TLC (MeOH/DCM 12/88). After isolation, the product was recovered by rinsing the silica with the same eluent. Evaporation of the solvent gave 8 (0.104 g, 66 %) as a yellow solid.
1H NMR (400 MHz, CDCl3): δ 1.44 (s, b, CCH3, 18H), 1.46 (s, CCH3, 9H), 2.04 (m, CH2CH2CH2, 2H), 3.00 (s, NCH3, 6H), 3.40 (m, NCH2, 2H), 4.06 (t, OCH2, J=6.3 Hz, 2H), 1.5–3.7 (b, CH2 macrocycle, CH2 acetic arms, 24 H), 6.62 (t, NH, J=6.0 Hz, 1H), 6.74–6.78 (m, ArH, 3H), 6.87 (dd, ArH, J=2.42, 8.62 Hz, 1H), 7.40 (d, ArH, J=7.4 Hz, 1H), 7.62 (m, ArH, 2H), 7.67 (s, C=CH, 1H). 13C NMR (100 MHz, CDCl3): δ 27.81 (CCH3), 27.84 (CCH3), 28.73 (CH2CH2CH2), 36.48 (CONHCH2), 40.27 (NCH3), 48.13 (NCH2, ring, broad), 52.41, (NCH2, ring, broad), 55.45 (NCH2CO, broad), 55.57 (NCH2CO), 55.68 (NCH2CO), 66.36 (CH2O), 81.65 (CMe3), 81.71(CMe3), 101.03 (CH arom), 111.88 (CH arom), 112.30 (CH arom), 113.65 (C arom), 122.50 (C arom), 124.38 (C arom), 128.51 (CH arom), 129.03 (CH arom), 137.23 (CHCCO), 150.38 (C arom), 154.36 (C arom), 161.16 (C arom), 161.30 (CCOO), 171.74 (CH2CO), 172.28 (CH2CO, broad), 172.48 (CH2CO).
[4,10-Bis-carboxymethyl-7-({3-[3-(4-dimethylamino-phenyl)-2-oxo-2H-chromen-7-yloxy]-propylcarbamoyl}-methyl)-1,4,7,10-tetraaza-cyclododec-1-yl]-acetic acid (9)
A solution of 8 (0.052 g, 0.058 mmol) in TFA (2mL) was stirred at room temperature for 24h. TFA was removed under reduced pressure and the residue dissolved in water (2 mL). The slightly cloudy solution was filtered and the solvent was evaporated to give 9·TFA as a bright yellow solid (0.048 g, quant.).
1H NMR (400 MHz, D2O): δ 1.82 (m, CH2CH2CH2, 2H), 3.20 (s, NCH3, 6H), 2.7–4.3 (b, CH2 macrocycle, CH2 acetic arms, OCH2, NCH2, 28H), 6.57 (d, J=2.3 Hz, ArH, 1H), 6.66 (dd, J=2.3 Hz, J=9.7 Hz, ArH, 1H), 7.27 (d, J= 8.8 Hz ArH, 1H), 7.55 (d, AB system, J= 8.9 Hz ArH, 2H), 7.62 (d, AB system, J= 8.9 Hz, ArH, 2H), 7.68 (s, C=CH, 1H); ESI-MS (m/z): calcd, 725.35; found, 725.33 [M+H]+.
Gadolinium (III) [4,10-Bis-carboxymethyl-7-({3-[3-(4-dimethylamino-phenyl)-2-oxo-2H-chromen-7-yloxy]-propylcarbamoyl}-methyl)-1,4,7,10-tetraaza-cyclododec-1-yl]-acetate (10)
To a solution of 9 (0.042 g, 0.058 mmol) in water (10 mL) was added a solution of GdCl3 in water (5.3 mM, 12.5 mL, 0.067 mmol) while maintaining the pH at 6.0 by addition of NaOH(aq) 1M. The solution was stirred at 50 °C for 12 h. The pH was raised to 9.0 and the solution was filtered through a 0.2 µm filter and the pH was lowered to 7.0 by adding HCl. The solution was loaded on a Hypersep C-18 cartridge and the stationary phase was washed extensively with water. The product was recovered after gradient elution with MeOH/H2O from 1:9 to 3:2. The fractions containing the product were evaporated under reduced pressure to give 10 (0.039 g, 68%) as a yellow solid. HR-ESI-MS (m/z): calcd 880.2520; found 880.2501 [M+H]+; a correct Gd isotope pattern was observed.
Animal handling
All animal experiments were performed in accordance with guidelines approved by the Institutional Animal Care and Use Committee of Case Western Reserve University (Protocol 2010-0006, 2010-0007). Two-month-old Swiss-Webster R/J mice were purchased from Harlan Laboratories, Indianapolis, IN. Two-month-old C57BL/6 mice and C3Fe.SWV-Mbpshi/J shiverer mice were obtained from The Jackson Laboratory, Bar Harbor, ME. Sprague Dawley rats were purchased from Harlan Laboratories, Haslett, MI.
Preparation of frozen sections
Mice were deeply anesthetized with isoflurane and perfused via the ascending aorta with 1×PBS followed by 4% paraformaldehyde in PBS. Brains were removed and incubated for 24 hours in 4% paraformaldehyde in PBS at 4 °C then in 30% sucrose at 4 °C until submerged. Frozen sections were used for fluorescence microscopy. For preparation of fresh frozen sections, the cryoprotected tissues were first frozen in OCT on dry ice before axial sectioning (20 µm) with a cryostat at −20 °C.
In vitro staining
Frozen sections or floating sections mounted on superfrost slides (Fisher Scientific) were incubated with an aqueous solution of compound 10 (100 µM) for 20 min at room temperature. Excess compound 10 was removed by briefly rinsing the sections in PBS before cover slipping with Vectashield mounting medium (Vector Laboratories; Burlingame, CA). Sections were then examined using epifluorescence microscopy with a Leica DM5000B microscope equipped with an HCX PL FLUOTAR 1.25×/0.04 objective and using the A4 filter (360/40 nm band pass excitation, 400 nm dichromatic mirror, 470/40 nm band pass suppression). In some cases, tissue sections were double stained with anti-myelin basic protein (MBP) monoclonal antibody (MAb) (see below), in which case the cover slipping and Vectrashield were omitted.
Immunohistochemistry
For immunohistochemistry, sections mounted on slides were incubated in a solution containing anti-MBPMAb primary antibody (rat anti- MBP, 1:300; Chemicon, Temecula, CA) diluted in 1% normal donkey serum overnight at 4C. Following three rinses with PBS, sections were incubated in donkey anti-rabbit Rhodamine Red- X-conjugated secondary antibody or goat anti-rat IgG Texas-red-conjugated secondary antibody (Jackson ImmunoResearch Laboratories; West Grove, PA) (diluted 1:200 in PBS with 1% normal donkey serum) for 1 hr at 37 °C, then washed three times for 5 min each with PBS. Sections were then examined using epifluorescence microscopy with a Leica DM5000B microscope equipped with an HCX PL FLUOTAR 1.25×/0.04 objective and using the T×2 filter (560/40 nm band pass excitation, 595 nm dichromatic mirror, 645/75 nm band pass suppression).
Luxol Fast Blue Staining for myelin
Frozen sections or floating sections mounted on superfrost slides (Fisher Scientific) were washed in phosphate buffer saline (PBS) for 5 minutes, in 35% ethanol for 5 min and 70% ethanol for 5 min. The sections were then incubated in a LFB solution (0.1%) at 60 °C overnight. The sections were washed sequentially with 95% ethanol, 70% ethanol, 35% ethanol, distilled water, and a water solution of lithium carbonate (0.05%) for 5 min for each step. The washing procedure was then repeated in reverse and the sections were washed with water, 35% ethanol, 70% ethanol and 95% ethanol for 5 min for each step. The entire washing procedure was repeated, if necessary, until gray matter is colorless and white matter appears blue.
The sections were then washed for 3 times for 5 min with fresh 95% ethanol, three times with 100% ethanol, and then twice with xylenes. The stained sections were analyzed in bright field with a Leica DM5000B microscope equipped with an HCX PL FLUOTAR 1.25×/0.04 objective.
Intracerebroventricular injection of compound 10
Sprague Dawley rats were anesthetized by IP injection of 200–250 µL of rodent cocktail [9 parts ketamine (100mg/ml) + 9 parts xylazine (20mg/ml) + 3 parts acepromazine (10 mg/ml) +79 parts sterile saline] and were fixed to a rat head restraining stereotaxic surgical table. The skull was shaved and a 3-cm longitudinal incision was made on the scalp. A burr hole was created using the spherical dental burr over the site of the intended injection. A water solution of compound 10 (10 mM, 2–10 µL) was injected into the brain through a 50 uL syringe equipped with a 28 gauge needle. After injection the incision was sutured and the animals allowed torecover consciousness while warmed over a heating pad. The injection sites are located in the lateral ventricle. Typical coordinates for the injection sites relative to the bregma are: A= −0.5±0.1 mm, ML = 2.3±0.1 mm, DV = 3.5±0.1 mm.
Induction of LPC lesions
One Sprague Dawley rat was anesthetized by IP injection of 225 uL of rodent cocktail [9 parts ketamine (100mg/ml) + 9 parts xylazine (20mg/ml) + 3 parts acepromazine (10 mg/ml) +79 parts sterile saline]. The skull was shaved and a 3-cm longitudinal incision was made on the scalp. A burr hole was created using the spherical dental burr over the site of the intended injection. 6 uL of a 1% LPC solution was injected at a rate 0.25 µL/min. The injections coordinates were AP=0.0 mm, ML= ±2.0 mm, DV=3.2mm, corresponding to the external capsule. After the injections the incision was sutured and the animals allowed to recover while being warmed over a heating pad.
For in vitro chemical and immunohistochemical studies, the lesions were allowed to develop for 7 days (demyelination stage) or 30 days (remyelination stage). For MR imaging, the lesions were allowed to develop for 11–18 days before the injection of compound 10.
Cuprizone mouse model
Brain sections from cuprizone mouse models were kindly provided by Dr. Liping Liu (Cleveland clinic). Briefly, C57BL/6J were fed with 0.2% cuprizone (w/w). Mice used to prepare sections in the demyelinated stage were euthanized after 4 weeks. Mice used to prepare sections in the remyelinating stage were fed with cuprizone for 6 weeks, subsequently allowed to remyelinate for 10 days, and then euthanized. The brains were used to prepare floating sections (30 µm) according to standard procedures.
MR Imaging
All MR experiments were performed at 9.4 T (Bruker ‘BIOSPEC’, Bruker, Germany) using a 60 mm-diameter volume coil. Anesthesia was maintained by mask inhalation of isoflurane vaporized at concentrations of up to 4% in the induction phase, at 1.5% during the imaging experiments. Prior to measurement of the longitudinal relaxation time, axial images of the rat brain were acquired, using a multislice RARE pulse sequence (TE =11.3 ms, TR =5000ms, spatial resolution=0.195×0.195 mm/pixel, matrix size 256×256, 30 slices, slice thickness=0.5mm, 1 average), for the identification of the region of interest (ROI). T1 measurements were carried out using a spin-echo multiple TR saturation recovery method with at least 10 TRs (TE=6.99 ms, TR=385–12500 ms, spatial resolution=0.195×0.195 mm/pixel, Matrix size=256×256, 30 slices, slice thickness=0.5mm, 1 average). T1 maps were generated using the QuickVol II plug-in in ImageJ.36
ACKNOWLEDGMENT
We gratefully acknowledge the financial support through grants from the Department of Defense (MS090082), National Multiple Sclerosis Society, and NIH/NINDS (R01 NS061837). We thank Drs. Richard Ransohoff and Liping Liu (Cleveland Clinic) for providing floating sections of cuprizone mouse brains.
Abbreviations
- BA
barrier filter
- BBB
blood brain barrier
- BNB
blood to nerve barrier
- CMC
Case Myelin Compound
- CNS
central nervous system
- CT
computed tomography
- DM
dichroic mirror
- DOTA
1,4,7,10-tetraazacyclododecane-1,4,7,10-tetraacetic acid
- DTPA
diethylene triamine pentaacetic acid
- DWI
diffusion weighed imaging
- ESI-MS
electrospray ionization- mass spectrometry
- HBTU
O-Benzotriazole-N,N,N’,N’-tetramethyl-uronium-hexafluoro-phosphate
- HP-DO3A
10-(2-hydroxypropyl)-1,4,7-tetraazacyclododecane-1,4,7-triacetic acid
- HPLC
high-performance liquid chromatography
- LFB
Luxol Fast Blue
- LPC
L-α-lysophosphatidylcholine
- MBP
myelin basic protein
- MIC
myelin imaging compound
- MRI
magnetic resonance imaging
- MS
multiple sclerosis
- MT
magnetization transfer
- MWF
myelin water fraction
- PBS
phosphate buffered saline
- PET
positron emission tomography
- RARE
rapid acquisition with refocused echoes
- SPECT
single-photon emission computed tomography
- US
ultrasound.
Footnotes
Part of this work was reported as a communication in the J. Am. Chem. Soc. (2011).
REFERENCES
- 1.Quarles RH, MacKlin WB, Morell P. Myelin formation, structure and biochemistry. In: Siegel GJ, Albers RW, Brady S, Price D, editors. Basic neurochemistry: molecular, cellular, and medical aspects. Burlington, MA: Elsevier Academic; 2006. pp. 51–72. [Google Scholar]
- 2.Hauw JJ, Delaere P, Seilhean D, Cornu P. Morphology of demyelination in the human central nervous system. J. Neuroimmunol. 1992;40:139–152. doi: 10.1016/0165-5728(92)90128-8. [DOI] [PubMed] [Google Scholar]
- 3.Molyneux PD, Barker GJ, Barkhof F, Beckmann K, Dahlke F, Filippi M, Ghazi M, Hahn D, MacManus D, Polman C, Pozzilli C, Kappos L, Thompson AJ, Wagner K, Yousry T, Miller DH. Clinical-MRI correlations in a European trial of interferon beta-1b in secondary progressive MS. Neurology. 2001;57:2191–2197. doi: 10.1212/wnl.57.12.2191. [DOI] [PubMed] [Google Scholar]
- 4.Deloire-Grassin MS, Brochet B, Quesson B, Delalande C, Dousset V, Canioni P, Petry KG. In vivo evaluation of remyelination in rat brain by magnetization transfer imaging. J. Neurol. Sci. 2000;178:10–16. doi: 10.1016/s0022-510x(00)00331-2. [DOI] [PubMed] [Google Scholar]
- 5.Dousset V, Grossman RI, Ramer KN, Schnall MD, Young LH, Gonzalez-Scarano F, Lavi E, Cohen JA. Experimental allergic encephalomyelitis and multiple sclerosis: lesion characterization with magnetization transfer imaging. Radiology. 1992;182:483–491. doi: 10.1148/radiology.182.2.1732968. [DOI] [PubMed] [Google Scholar]
- 6.Henkelman RM, Huang X, Xiang QS, Stanisz GJ, Swanson SD, Bronskill MJ. Quantitative interpretation of magnetization transfer. Magn. Reson. Med. 1993;29:759–766. doi: 10.1002/mrm.1910290607. [DOI] [PubMed] [Google Scholar]
- 7.Morrison C, Henkelman RM. A model for magnetization transfer in tissues. Magn. Reson. Med. 1995;33:475–482. doi: 10.1002/mrm.1910330404. [DOI] [PubMed] [Google Scholar]
- 8.Sled JG, Pike GB. Quantitative Interpretation of Magnetization Transfer in Spoiled Gradient Echo MRI Sequences. J. Magn. Reson. 2000;145:24–36. doi: 10.1006/jmre.2000.2059. [DOI] [PubMed] [Google Scholar]
- 9.Sled JG, Pike GB. Quantitative imaging of magnetization transfer exchange and relaxation properties in vivo using MRI. Magn. Reson. Med. 2001;46:923–931. doi: 10.1002/mrm.1278. [DOI] [PubMed] [Google Scholar]
- 10.Narayanan S, Francis Simon J, Sled John G, Santos AC, Antel S, Levesque I, Brass S, Lapierre Y, Sappey-Marinier D, Pike GB, Arnold Douglas L. Axonal injury in the cerebral normal-appearing white matter of patients with multiple sclerosis is related to concurrent demyelination in lesions but not to concurrent demyelination in normal-appearing white matter. NeuroImage. 2006;29:637–642. doi: 10.1016/j.neuroimage.2005.07.017. [DOI] [PubMed] [Google Scholar]
- 11.Moore GR, Leung E, MacKay AL, Vavasour IM, Whittall KP, Cover KS, Li DK, Hashimoto SA, Oger J, Sprinkle TJ, Paty DW. A pathology-MRI study of the short-T2 component in formalin-fixed multiple sclerosis brain. Neurology. 2000;55:1506–1510. doi: 10.1212/wnl.55.10.1506. [DOI] [PubMed] [Google Scholar]
- 12.Rovaris M, Filippi M. Diffusion tensor MRI in multiple sclerosis. J. Neuroimaging. 2007;17(Suppl 1):27S–30S. doi: 10.1111/j.1552-6569.2007.00133.x. [DOI] [PubMed] [Google Scholar]
- 13.van Zijl PCM, Nagae-Poetscher L, Mori S. Quantitative Diffusion Imaging. In: Filippi M, Stefano ND, Dousset V, McGowan JC, editors. MR imaging in white matter diseases of the brain and spinal cord. New York: Springer; 2005. pp. 63–81. [Google Scholar]
- 14.Bendszus M, Ladewig G, Jestaedt L, Misselwitz B, Solymosi L, Toyka K, Stoll G. Gadofluorine M enhancement allows more sensitive detection of inflammatory CNS lesions than T2-w imaging: a quantitative MRI study. Brain. 2008;131:2341–2352. doi: 10.1093/brain/awn156. [DOI] [PubMed] [Google Scholar]
- 15.Wessig C. Detection of blood-nerve barrier permeability by magnetic resonance imaging. Methods Mol. Biol. 2011;686:267–271. doi: 10.1007/978-1-60761-938-3_12. [DOI] [PubMed] [Google Scholar]
- 16.Stankoff B, Wang Y, Bottlaender M, Aigrot M-S, Dolle F, Wu C, Feinstein D, Huang G-F, Semah F, Mathis CA, Klunk W, Gould RM, Lubetzki C, Zalc B. Imaging of CNS myelin by positron-emission tomography. Proc. Natl. Acad. Sci. U. S. A. 2006;103:9304–9309. doi: 10.1073/pnas.0600769103. [DOI] [PMC free article] [PubMed] [Google Scholar]
- 17.Wang C, Popescu DC, Wu C, Zhu J, Macklin W, Wang Y. In situ fluorescence imaging of myelination. J. Histochem. Cytochem. 2010;58:611–621. doi: 10.1369/jhc.2010.954842. [DOI] [PMC free article] [PubMed] [Google Scholar]
- 18.Wang C, Wu C, Popescu DC, Zhu J, Macklin WB, Miller RH, Wang Y. Longitudinal near-infrared imaging of myelination. J. Neurosci. 2011;31:2382–2390. doi: 10.1523/JNEUROSCI.2698-10.2011. [DOI] [PMC free article] [PubMed] [Google Scholar]
- 19.Wang C, Wu C, Zhu J, Miller RH, Wang Y. Design, synthesis, and evaluation of coumarin-based molecular probes for imaging of myelination. J. Med. Chem. 2011;54:2331–2340. doi: 10.1021/jm101489w. [DOI] [PMC free article] [PubMed] [Google Scholar]
- 20.Wang Y, Wu C, Caprariello AV, Somoza E, Zhu W, Wang C, Miller RH. In vivo quantification of myelin changes in the vertebrate nervous system. J. Neurosci. 2009;29:14663–14669. doi: 10.1523/JNEUROSCI.4082-08.2009. [DOI] [PMC free article] [PubMed] [Google Scholar]
- 21.Wu C, Tian D, Feng Y, Polak P, Wei J, Sharp A, Stankoff B, Lubetzki C, Zalc B, Mufson EJ, Gould RM, Feinstein DL, Wang Y. A novel fluorescent probe that is brain permeable and selectively binds to myelin. J. Histochem. Cytochem. 2006;54:997–1004. doi: 10.1369/jhc.5A6901.2006. [DOI] [PMC free article] [PubMed] [Google Scholar]
- 22.Wu C, Wang C, Popescu DC, Zhu W, Somoza EA, Zhu J, Condie AG, Flask CA, Miller RH, Macklin W, Wang Y. A novel PET marker for in vivo quantification of myelination. Bioorg. Med. Chem. 2010;18:8592–8599. doi: 10.1016/j.bmc.2010.10.018. [DOI] [PMC free article] [PubMed] [Google Scholar]
- 23.Wu C, Wei J, Tian D, Feng Y, Miller RH, Wang Y. Molecular Probes for Imaging Myelinated White Matter in CNS. J. Med. Chem. 2008;51:6682–6688. doi: 10.1021/jm8003637. [DOI] [PMC free article] [PubMed] [Google Scholar]
- 24.Aime S, Anelli PL, Botta M, Fedeli F, Grandi M, Paoli P, Uggeri F. Synthesis, characterization, and 1/T1 NMRD profiles of gadolinium(III) complexes of monoamide derivatives of DOTA-like ligands. X-ray structure of the 10-[2-[[2-hydroxy-1-(hydroxymethyl)ethyl]amino]-1-[(phenylmethoxy)methyl]-2-oxoethyl]-1,4,7,10-tetraazacyclododecane-1,4,7-triacetic acid-gadolinium(III) complex. Inorg. Chem. 1992;31:2422–2428. [Google Scholar]
- 25.Jurkin D, Gildehaus FJ, Wierczinski B. Dissociation kinetics determination of yttrium(III)-polyaminocarboxylates using free-ion selective radiotracer extraction (FISRE) J. Labelled Compd. Radiopharm. 2009;52:33–40. [Google Scholar]
- 26.Kumar K, Chang CA, Francesconi LC, Dischino DD, Malley MF, Gougoutas JZ, Tweedle MF. Synthesis, Stability, and Structure of Gadolinium(III) and Yttrium(III) Macrocyclic Poly(amino carboxylates) Inorg. Chem. 1994;33:3567–3575. [Google Scholar]
- 27.Frullano L, Wang C, Miller RH, Wang Y. A Myelin-Specific Contrast Agent for Magnetic Resonance Imaging of Myelination. J. Am. Chem. Soc. 2011;133:1611–1613. doi: 10.1021/ja1040896. [DOI] [PMC free article] [PubMed] [Google Scholar]
- 28.Laurent S, Vander Elst L, Henoumont C, Muller RN. How to measure the transmetallation of a gadolinium complex. Contrast Media & Molecular Imaging. 2010;5:305–308. doi: 10.1002/cmmi.388. [DOI] [PubMed] [Google Scholar]
- 29.Laurent S, Vander L, Copoix F, Muller RN. Stability of MRI paramagnetic contrast media: a proton relaxometric protocol for transmetalation assessment. Invest. Radiol. 2001;36:115–122. doi: 10.1097/00004424-200102000-00008. [DOI] [PubMed] [Google Scholar]
- 30.Liu X, Byrne RH. Rare earth and yttrium phosphate solubilities in aqueous solution. Geochim. Cosmochim. Acta. 1997;61:1625–1633. [Google Scholar]
- 31.de Sousa Paulo L, Livramento Joao B, Helm L, Merbach Andre E, Meme W, Doan B-T, Beloeil J-C, Prata Maria IM, Santos Ana C, Geraldes Carlos FGC, Toth E. In vivo MRI assessment of a novel GdIII-based contrast agent designed for high magnetic field applications. Contrast Media Mol Imaging. 2008;3:78–85. doi: 10.1002/cmmi.233. [DOI] [PubMed] [Google Scholar]
- 32.Rohrer M, Bauer H, Mintorovitch J, Requardt M, Weinmann H-J. Comparison of magnetic properties of MRI contrast media solutions at different magnetic field strengths. Invest. Radiol. 2005;40:715–724. doi: 10.1097/01.rli.0000184756.66360.d3. [DOI] [PubMed] [Google Scholar]
- 33.Franklin KBJ, Paxinos G. The mouse brain in stereotaxic coordinates. 3rd ed. San Diego: Elsevier Academic Press Inc; 2007. [Google Scholar]
- 34.Ford CC, Ceckler TL, Karp J, Herndon RM. Magnetic resonance imaging of experimental demyelinating lesions. Magn. Reson. Med. 1990;14:461–481. doi: 10.1002/mrm.1910140305. [DOI] [PubMed] [Google Scholar]
- 35.Paxinos G, Watson C. The rat brain - In stereotaxic coordinates. 6th ed. San Diego: Elsevier Academic Press Inc; 2007. [Google Scholar]
- 36.Schmidt KF, Ziu M, Schmidt N, Ole, Vaghasia P, Cargioli TG, Doshi S, Albert MS, Black PML, Carroll RS, Sun Y. Volume reconstruction techniques improve the correlation between histological and in vivo tumor volume measurements in mouse models of human gliomas. J. Neurooncol. 2004;68:207–215. doi: 10.1023/b:neon.0000033364.43142.bf. [DOI] [PubMed] [Google Scholar]
- 37.Caravan P, Ellison JJ, McMurry TJ, Lauffer RB. Gadolinium(III) Chelates as MRI Contrast Agents: Structure, Dynamics, and Applications. Chem. Rev. 1999;99:2293–2352. doi: 10.1021/cr980440x. [DOI] [PubMed] [Google Scholar]
- 38.Behra-Miellet J, Gressier B, Brunet C, Dine T, Luyckx M, Cazin M, Cazin J-C. Free gadolinium and gadodiamide, a gadolinium chelate used in magnetic resonance imaging: Evaluation of their in vitro effects on human neutrophil viability. Methods Find. Exp. Clin. Pharmacol. 1996;18:437–442. [PubMed] [Google Scholar]
- 39.Husztik E, Lazar G, Parducz A. Electron microscopic study of Kupffer-cell phagocytosis blockade induced by gadolinium chloride. Br. J. Exp. Pathol. 1980;61:624–630. [PMC free article] [PubMed] [Google Scholar]
- 40.Itoh N, Kawakita M. Characterization of gadolinium(3+) and terbium(3+) binding sites on calcium-magnesium adenosine triphosphatase of sarcoplasmic reticulum. J. Biochem. 1984;95:661–669. doi: 10.1093/oxfordjournals.jbchem.a134655. [DOI] [PubMed] [Google Scholar]
- 41.Spencer AJ, Wilson SA, Batchelor J, Reid A, Rees J, Harpur E. Gadolinium chloride toxicity in the rat. Toxicol. Pathol. 1997;25:245–255. doi: 10.1177/019262339702500301. [DOI] [PubMed] [Google Scholar]
- 42.Biagi BA, Enyeart JJ. Gadolinium blocks low- and high-threshold calcium currents in pituitary cells. Am. J. Physiol. 1990;259:C515–C520. doi: 10.1152/ajpcell.1990.259.3.C515. [DOI] [PubMed] [Google Scholar]
- 43.Lansman JB. Blockade of current through single calcium channels by trivalent lanthanide cations. Effect of ionic radius on the rates of ion entry and exit. J. Gen. Physiol. 1990;95:679–696. doi: 10.1085/jgp.95.4.679. [DOI] [PMC free article] [PubMed] [Google Scholar]
- 44.Boyd Alan S, Zic John A, Abraham Jerrold L. Gadolinium deposition in nephrogenic fibrosing dermopathy. J. Am. Acad. Dermatol. 2007:27–30. doi: 10.1016/j.jaad.2006.10.048. [DOI] [PubMed] [Google Scholar]
- 45.Vorobiov M, Basok A, Tovbin D, Shnaider A, Katchko L, Rogachev B. Iron-mobilizing properties of the gadolinium-DTPA complex: clinical and experimental observations. Nephrol. Dial. Transplant. 2003;18:884–887. doi: 10.1093/ndt/gfg064. [DOI] [PubMed] [Google Scholar]
- 46.Caravan P, Farrar CT, Frullano L, Uppal R. Influence of molecular parameters and increasing magnetic field strength on relaxivity of gadolinium- and manganese-based T1 contrast agents. Contrast Media Mol Imaging. 2009;4:89–100. doi: 10.1002/cmmi.267. [DOI] [PMC free article] [PubMed] [Google Scholar]
- 47.Allkemper T, Bremer C, Matuszewski L, Ebert W, Reimer P. Contrast-enhanced blood-pool MR angiography with optimized iron oxides: effect of size and dose on vascular contrast enhancement in rabbits. Radiology. 2002;223:432–438. doi: 10.1148/radiol.2232010241. [DOI] [PubMed] [Google Scholar]
- 48.Josephson L, Lewis J, Jacobs P, Hahn PF, Stark DD. The effects of iron oxides on proton relaxivity. Magn. Reson. Imaging. 1988;6:647–653. doi: 10.1016/0730-725x(88)90088-4. [DOI] [PubMed] [Google Scholar]
- 49.Pardridge WM. The blood-brain barrier: bottleneck in brain drug development. NeuroRx. 2005;2:3–14. doi: 10.1602/neurorx.2.1.3. [DOI] [PMC free article] [PubMed] [Google Scholar]