Abstract
Purpose
To study the anisotropic characteristics of both multi-component T2 and T1ρ relaxation times in tendon.
Materials and Methods
T2 and T1ρ were measured in tendon by NMR spectroscopy at different orientations and by microscopic MRI at the magic angle. A number of experimental issues in the multi-component relaxation measurements were investigated, including the effects of echo spacing, the resolution of MRI experiments, the influence of the specimen orientations, and the strengths of different spin-lock frequencies in T1ρ experiments.
Results
Both the values and fractions of T2 in tendon showed significant orientational dependence. The values and fractions of T1ρ strongly depended on both the specimen orientation and the spin-lock strength. The imaging resolution (35 – 280 µm) had little influence in the T2 experiments. Both the echo spacings (0.6 – 3.0 ms) in the T2 experiment and the spin-lock strengths (0.5 – 5 kHz) in the T1ρ experiment affected the quantification of the multi-component relaxation. Up to three T2 and T1ρ components were resolved in tendon.
Conclusion
Multi-component relaxations could be attributed to different populations of water in the tissue. The transitions between a mono-component and multi-component result call for the caution in interpreting the relaxation results.
Keywords: tendon, T2 relaxation, T1ρ relaxation, multi-component
INTRODUCTION
Tendon, an important connective tissue that joins muscle and bone to provide force transmission, largely consists of a highly ordered collagen structure and water molecules (1). Most collagens in tendon are the type-I fibrils that are oriented in parallel with the long axis of the tendon tissue. Water, as the principal contributor to the signals of Nuclear Magnetic Resonance (NMR) and Magnetic Resonance Imaging (MRI), has its motional behavior depending not only on its content but also on its interaction with the collagens. When the collagens are highly ordered and the interaction is strong, the water motion can become highly anisotropic (2–5). As a result, it is possible to have multiple pools of water molecules in a biological tissue, each pool having its unique dynamic environment.
The relaxation parameters (e.g., the spin-lattice relaxation time T1, the spin-spin relaxation time T2, the spin-lattice relaxation time in the rotating frame T1ρ) are known in NMR and MRI to provide sensitive measures to the water dynamics. A number of NMR and MRI techniques have been used to investigate the structure and motion of water in tendon (3,5–16), where the multi-component relaxation is commonly associated with different molecular populations. For example, Peto et al (7) noticed that the decay of the transverse magnetization of tendon could be fitted by a four-component decay. Fathima et al (17) suggested that the tri-exponential functions in native collagen samples corresponded to the tightly bound water, weakly bound water, and free water. Zheng et al (5) also observed three different relaxation components in tendon by NMR spectroscopy measurement. Recently, spectroscopic imaging at the ultrashort echo time was used (18,19) to measure the T2 components in tissue, where a bi-component model was used in the analysis. A model of multiple water hydration compartments, each with different correlation time and different degree of proton motional restriction, had also been suggested on the tendon collagen specimens by Cameron and Fullerton (20).
In common MRI scanners, tendon often yields little signal unless the acquisition sequence is purposely tailored to have very short echo times or the tendon is oriented at approximately 55° with respect to the main magnetic field B0 (18,21,22). Since the angle of 54.7° is commonly referred to as the magic angle in NMR/MRI theory, the MRI signal enhancement due to the minimization of the residual dipolar interaction at/around 55° has been termed as the magic angle effect in the MRI literatures of skeletal tissues (including tendon, articular cartilage and ligaments) (21,23–25). Since the orientational dependency of the MRI signal depends strongly on the orientational structure of macromolecules, the anisotropic characteristics of the NMR/MRI signal can be used to investigate the interaction of water molecules with the extensive hydrogen-bonded network around collagen molecules.
Although there have been several studies on the multi-component T2 relaxation in connective tissue, the nature of multi-component T1ρ relaxation in tissues is still poorly understood (16,18,26). In this project, both microscopic MRI (µMRI) and NMR spectroscopy were used to study the anisotropic characteristics of both multi-component T1ρ and T2 relaxations. A number of experimental issues in the multi-component relaxation measurements were investigated, including the effects of echo spacing (0.6 ms to 3 ms), the resolution of MRI experiments (35 µm to 280 µm), the influence of the specimen orientations (0°, 30°, 45°, 55°), and the strengths of different spin-lock frequencies in T1ρ experiments (0.5 kHz to 5 kHz). We aimed to provide a coherent baseline for the complex and subtle issues that can influence the measurement of multi-component relaxation in an organized biological tissue.
MATERIALS AND METHODS
Tendon Preparation
Three canine Achilles tendons were harvested from mature and musculoskeletally healthy dogs that were used for an unrelated biomedical study. These dogs came from a research lab that had provided canine tissue to our studies for more than ten years. The handling of the animal subjects was approved by the institutional review committee. The samples were immersed in physiological saline (154 mM NaCl in deionized water) with 1% protease inhibitor (Sigma, Missouri), and stored at −20 °C before the experiments.
Microscopic MRI
Microscopic MRI experiments were conducted at room temperature on a Bruker AVANCE II NMR spectrometer equipped with a 7-Tesla/89-mm vertical-bore superconducting magnet and micro-imaging accessory (Billerica, MA). A homemade 5-mm solenoid coil was used for the experiments. The orientation of the tendon block (the long axis of the tendon tissue) with respect to B0 was set at 55° (the magic angle) for MRI experiments (16,23). T2 imaging experiments were performed using a Carr-Purcell-Meiboom-Gill (CPMG) magnetization-prepared T2 imaging sequence (5,27). The echo spacing in the CPMG T2-weighting segment was 1 ms. The number of echo times was 48, resulting in 48 delays from 2 to 400 ms. The T1ρ imaging sequence was nearly identical to the T2 imaging sequence, except that it was led by a T1ρ-weighting segment, which had a 90° radio-frequency (rf) pulse followed by a spin-lock pulse. The power of the spin-lock pulse varied from 0.5 to 5 KHz. The strength of the spin-lock field was calibrated by the strength of the 90° rf pulse, which had a typical length of 6.5 µs. The lengths of the spin-lock pulses were equal to the 48 echo times in the T2 imaging experiments. The 2D imaging parameters were consistent for all experiments: the echo time and repetition time was 3.9 ms and 2 s respectively; the number of scans was 12; and the field of view (FOV) was 4.5 mm×4.5 mm. T2 experiments were acquired at four different transverse pixel resolutions (280 µm, 140 µm, 70 µm, and 35 µm). The slice thickness was 1 mm. A minimum SNR of 400 was achieved from all experiments.
NMR Spectroscopy
NMR spectroscopy experiments were conducted on the same NMR instrument. The tendon specimens in the spectroscopy experiments were surface-blotted dried to remove excess surface water and subsequently immersed in Fluorinert FC-77 Liquid (3M, St. Paul, MN), which had similar susceptibility to tendon and low water solubility (27). The T2 and T1ρ experiments were conducted at four specimen orientations in the magnetic field (0°, 30°, 45°, 55°) with ± 3° error. The bulk T2 relaxation by NMR spectroscopy was measured by the standard CPMG sequence, which was similar to that of the µMRI experiments except without the 2D imaging pulses. Sixty data points were acquired for each of the four echo-spacings (0.6 ms, 1 ms, 2 ms, 3 ms) at the magic angle and one echo-spacing (1 ms) at other angles. The repetition time was 5 s; the number of dummy scans was 8; and a minimum SNR of about 3000 was achieved for all experiments. The parameters of T1ρ spectroscopy experiments were similar to T2 spectroscopy experiments, while the length of spin-lock pulse equaled to the 60 echo times in the CPMG experiments. In addition, an inversion-revocery pulse sequence with 16 data points was used for the T1 relaxation time measurement at 14 different orientations. Other details have been well documented in the literature (16).
Multi-component T2 and T1ρ relaxation analysis
The non-negative-least-squares (NNLS) method (27–29) was implemented in the Matlab codes (Mathworks, Natick, MA) and used to calculate the distribution profiles of T2 and T1ρ relaxation times. In the MRI data analysis, the central region of 6 pixels by 6 pixels was averaged to improve the signal-to-noise ratio. In the NNLS analysis of the T2 and T1ρ spectrum, any T2 or T1ρ component with a value below or above two constant thresholds (1.5 ms and 250 ms) was ignored to eliminate the dependence of the calculation on the experimental noises (30–32). The use of the NNLS meant that the results in the experiments were calculated without a priori assumptions about the number of T2 and T1ρ components and any initial guesses of the solution.
RESULTS
T1, T2 and T1ρ of Tendon by NMR Spectroscopy
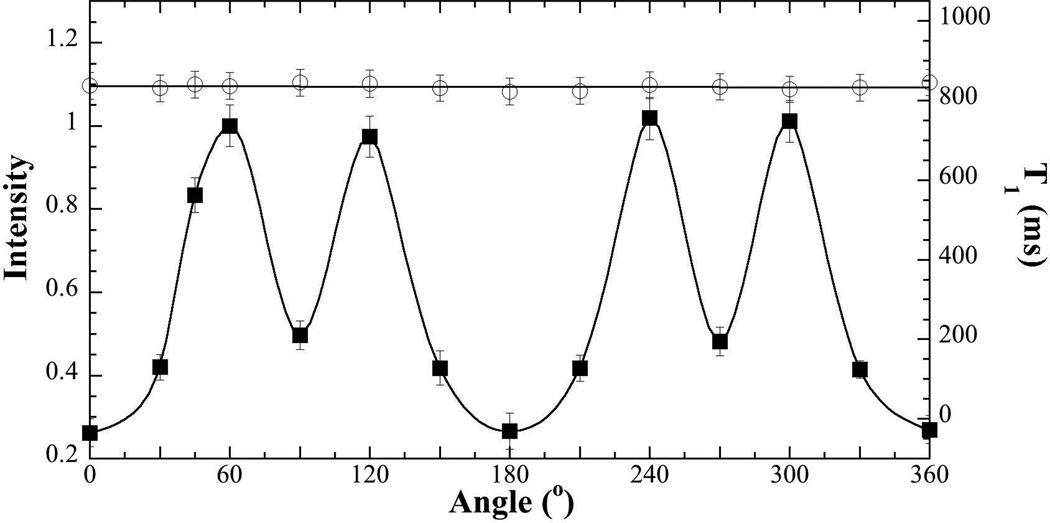
The dependence of the NMR signal on the specimen orientation in the magnetic field B0 was shown in Fig 1, where the 0° angle referred to the orientation of the long axis of the tendon being parallel with B0. Although the signal intensity was strongly anisotropic, T1 in tendon was isotropic.
Fig 1.
The NMR signal intensity (solid squares) and bulk T1 relaxation time (open circles) of tendon as the function of the specimen orientation in the magnetic field B0, where the long axis of the specimen is in parallel with B0 at 0°. The error bars are the standard deviations of the measurement.
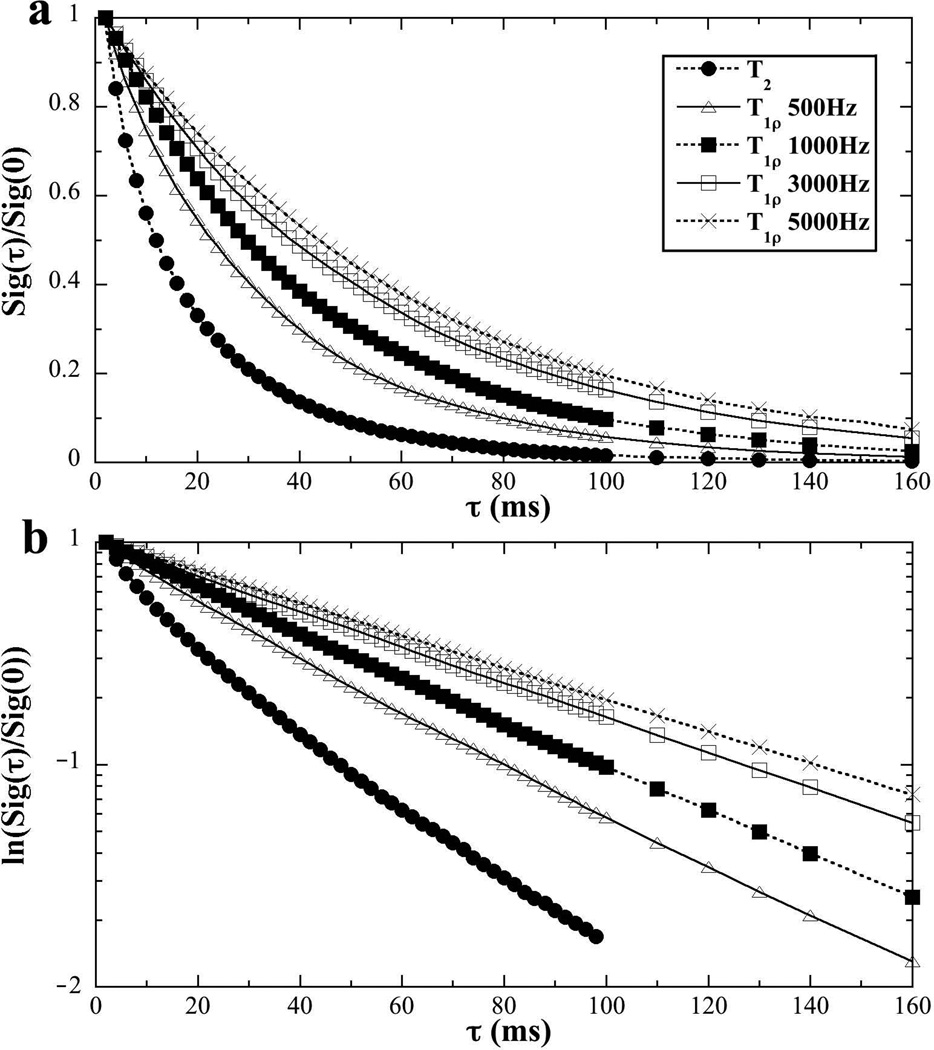
Fig 2 illustrated the nature of the multi-component relaxation experiments by a set of T2 and T1ρ results from NMR spectroscopy, where the T2 data can be considered as the T1ρ at the spin-lock frequency of zero. The linear scale data in Fig 2a showed that the signal decay became slower when the spin-lock frequency (i.e., power) became higher. A visually convenient way to distinguish whether the data had single or multiple components was to plot the same data in a natural log scale, shown in Fig 2b, where any deviation from a single straight line would suggest the existence of multi-components in relaxation. This dependency of the relaxation values on the spin-lock frequencies is commonly referred to as the T1ρ dispersion phenomenon in the literatures. The sample in Fig 2 was oriented at 55°; at other specimen orientations, the signal decay showed similar T1ρ dispersion trend (not shown).
Fig 2.
The normalized signals of tendon from NMR spectroscopy at different spin-lock frequencies in the linear (a) and natural log (b) scales. (The specimen orientation was at 55°.)
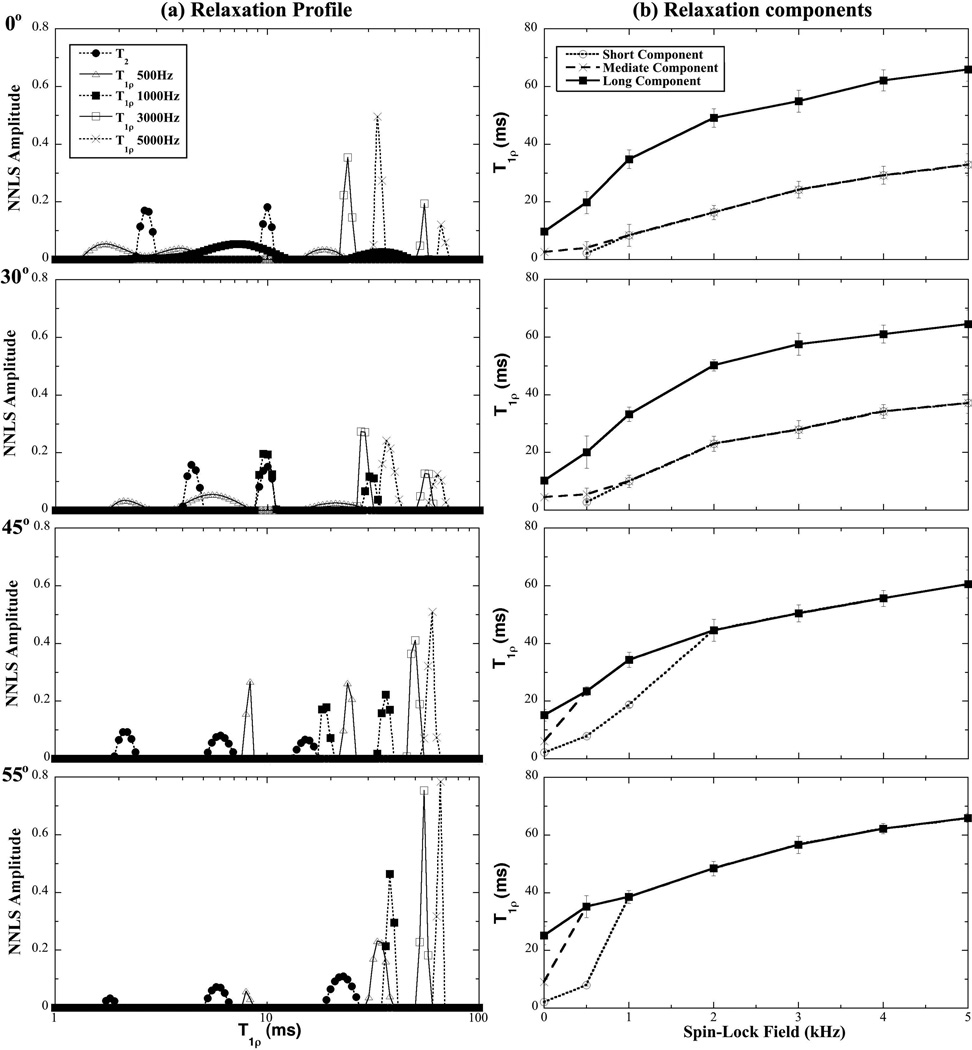
Fig 3 summarizes the orientational dependences of T2 and T1ρ data in tendon at four different angles (0°, 30°, 45°, 55°), where the relaxation profiles are shown in Fig 3a and the trends of the relaxation components are shown in Fig 3b. It is clear that the numbers and values of the relaxation components depended strongly on the specimen orientations and, in the T1ρ case, the spin-lock frequencies. The general trends in these data were, smaller specimen angles (e.g. 0° and 30°) resulting in more relaxation components, and lower spin-lock frequency (e.g., 500Hz) resulting in more relaxation components. Specifically, (1) T2 showed multi-components regardless of the specimen orientation: two T2 components at 0° and 30°, and three T2 components at 45° and 55°; (2) When the spin-lock frequency was weak (e.g., 500 Hz), T1ρ showed three components at either 0° or 30°, and two components at either 45° or 55°; (3) When the spin-lock frequency was increased, T1ρ still had two detectable components at 0° and 30° (even the spin-lock frequency was at 5 kHz), but reduced to one component at 45° and 55° when the spin-lock frequency was higher than 2 kHz.
Fig 3.
(a) The T2 and T1ρ distribution profiles of tendon at four different orientations (0°, 30°, 45°, 55°) by the NNLS calculation using the NMR spectroscopy results. (b) The trends of the relaxation components as the function of the spin-lock frequencies.
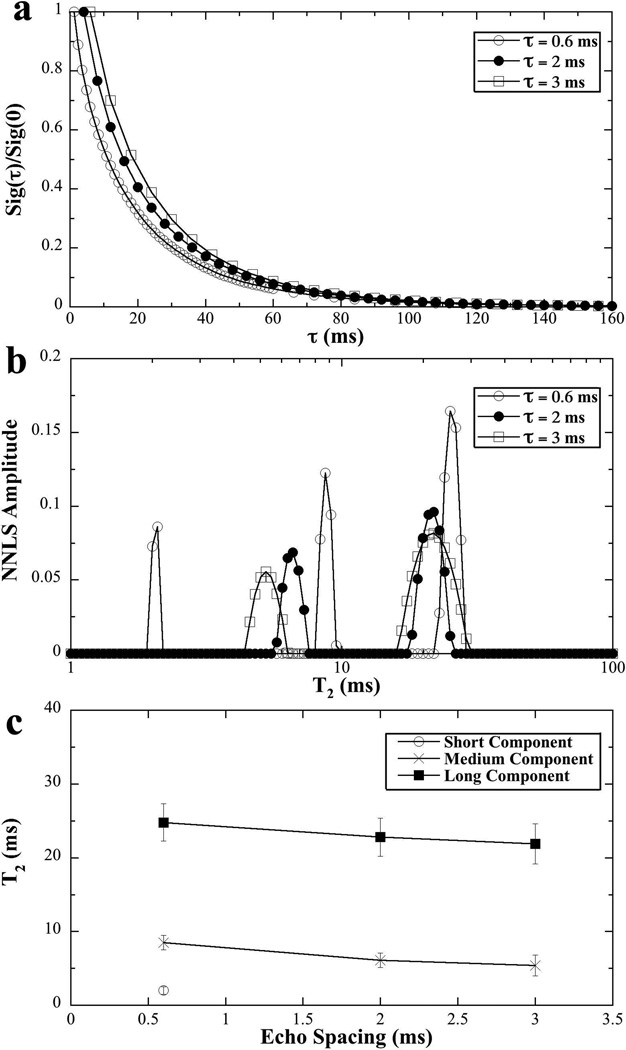
The T2 relaxation as functions of the echo spacing (τ = 0.6 ms, 2 ms, 3 ms) was also investigated by NMR spectroscopy (when the specimens were set at the magic angle). The data was summarized in Fig 4. It’s interesting to observe the three T2 components in tendon when the echo spacing was short (τ = 0.6 ms), which was similar to the comprehensive result in Fig 3 where the echo spacing was 1 ms. When the echo spacing was increased to 2 ms or more, the rapid decay component disappeared, so the number of T2 components was reduced to two.
Fig 4.
The T2 results of tendon at different τ (echo times) in NMR spectroscopy.
T2 and T1ρ of Tendon by µMRI
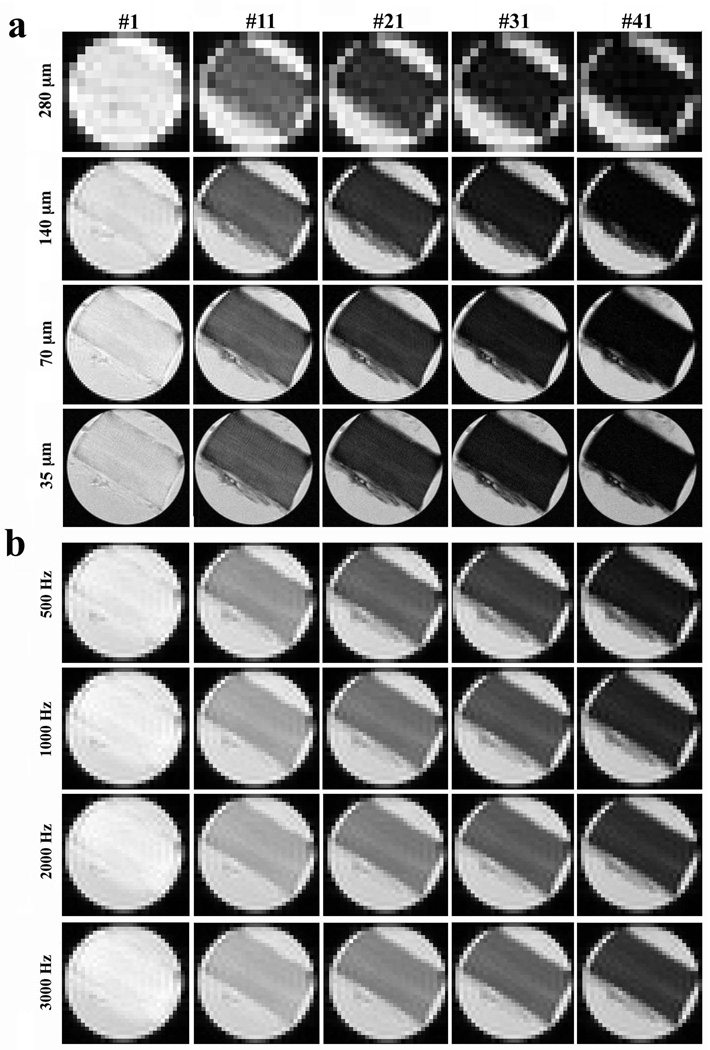
Fig 5a shows the MRI intensity images of tendon in a T2 experiment at four different resolutions; Fig 5b shows the MRI intensity images of tendon in a T1ρ experiment at four different spin-lock powers. Both experiments were carried out at the magic angle. Three general features could be identified from these intensity images. First, all image intensities appeared reasonably uniform. Second, the image intensity decreased when the T2 or T1ρ weighting was increased (indicated by a larger sequential number at the top margin). Third, the image intensity increased when the spin-lock power was increased.
Fig 5.
The proton intensity images from µMRI where each specimen was imaged 48 times, each at a different T2 or T1ρ weighting. All intensity images were displayed using the same maximum (32767) and minimum (0) values on the usual gray scale. The direction of the polarizing magnetic field B0 was vertically up. The fibril orientation of the specimen was set at 55° to B0. The images in (a) were for T2 experiment at different pixel resolutions. The images in (b) were for T1ρ experiment at different spin-lock frequencies (and at a fixed resolution of 140 µm).
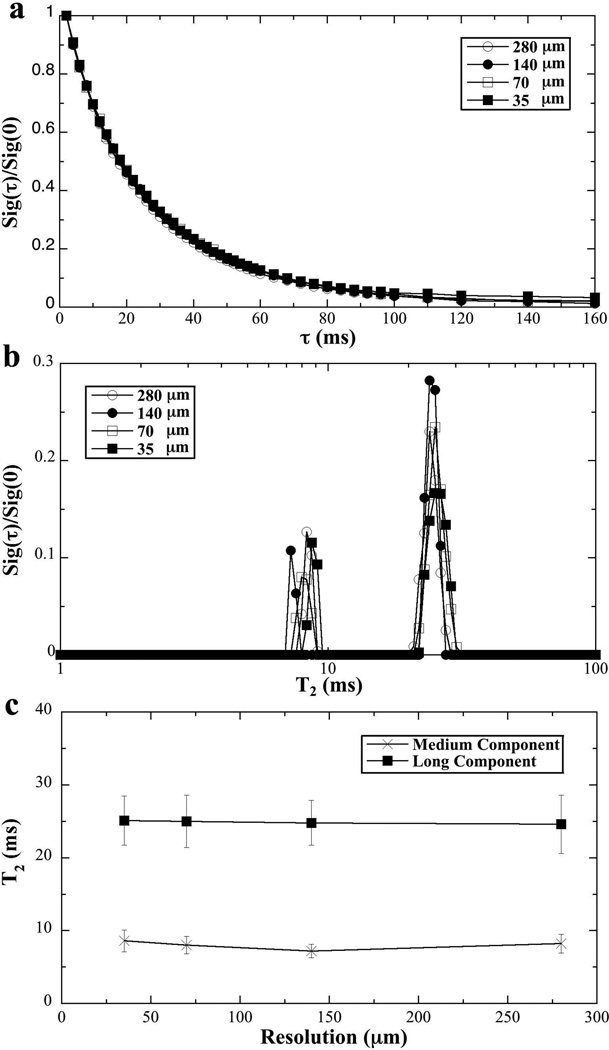
Fig 6a and 6b show the normalized signal decay and NNLS analysis for the T2 imaging experiments at four different resolutions (35 µm to 280 µm). The decay curves were highly consistent among four resolutions, indicating that the multi-component relaxation experiment is not sensitive towards the image resolution (using our magnetization-prepared spin-echo sequences). The NNLS analysis for the µMRI data at the four different resolutions showed consistent results in the T2 relaxation profiles – each having two T2 components (Fig 6b). Comparing with the three component results in NMR spectroscopy, the longer echo time in imaging and the use of imaging gradients likely caused the loss of the shortest T2 component (the most left peak in Fig 3a) that was found in the NMR spectroscopy experiment.
Fig 6.
The T2 results of tendon from µMRI experiments at different image resolutions.
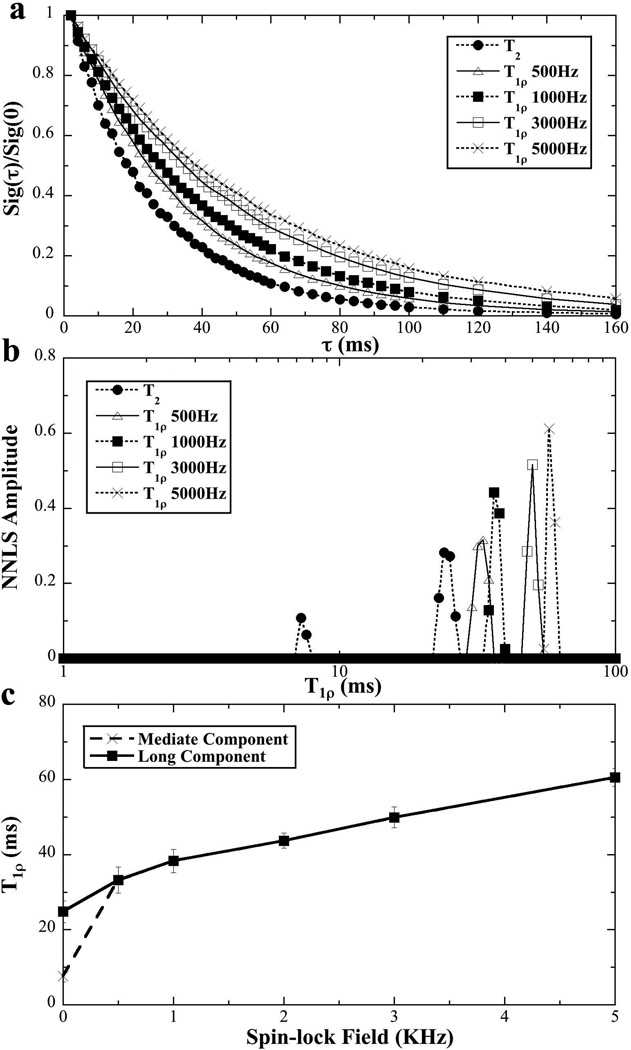
Since the structure of tendon was morphologically uniform (as seen in Fig 5) and the SNR was better when the resolution was lower, all T2 and T1ρ imaging experiments were carried out at the 140-µm resolution. Fig 7 summarizes the µMRI T2 and T1ρ results at different spin-lock frequencies (0.5 kHz to 5 kHz). It is clear that the signal decays slower when the spin-lock frequency is increased (T1ρ dispersion), which is consistent with the NMR spectroscopy results shown in Fig 3. Compared to three distinct T1ρ components in NMR spectroscopy, only two T1ρ components were found in µMRI experiments – the rapid decay component was likely lost due to the same reasons stated above. When the spin-lock frequency was at 0.5 kHz or higher, any T1ρ relaxation curve could be fitted well by a single exponential component, which was shown by NNLS in Fig 7b – c.
Fig 7.
The T1ρ dispersion results of tendon from µMRI experiments at different spin-lock frequencies.
Table 1 summarized the NNLS calculations for the multi-component T2 and T1ρ results by both NMR spectroscopy and µMRI. In the pixel-by-pixel NNLS analysis, additional minor components occasionally appeared in the T2 and T1ρ distribution profiles (especially in the imaging experiments). Since these additional components were small (less than 3% in population) and not consistent (either absent or having a variable value between 1 ms and 10 ms in this group of tendon specimens), these inconsistent components were attributed to the influence of experimental noise or sample inhomogeneity, hence not included in the summary. It is clear from Table 1 that T1ρ values increased when the spin-lock frequency increased, with T2 (regardless of τ value) being the lowest. The number and the fractional concentration of the relaxation components are not only related to the echo spacing, but also to the spin-lock frequency.
Table 1.
NMR spectroscopy and MRI results of relaxation times (ms) and component fraction (%)
| T1ρ Dispersion |
NMR | MRI | ||||||||
|---|---|---|---|---|---|---|---|---|---|---|
| 0° | 30° | 45° | 55° | 55° | ||||||
| ms | % | ms | % | ms | % | ms | % | ms | % | |
| T2 (0.6ms) |
2.0±0.5 | 16.0±2.2 | ||||||||
| 8.5±1.0 | 30.1±3.1 | |||||||||
| 24.8±2.5 | 53.9±3.9 | |||||||||
| T2 (1ms) |
2.2±1.6 | 35.3±3.1 | 1.8±0.8 | 9.1±1.8 | ||||||
| 2.6±1.7 | 57.1±4.9 | 4.5±2.0 | 51.3±4.3 | 6.1±2.0 | 38.3±4.0 | 6.8±1.2 | 31.8±2.9 | 7.2±0.9 | 23.4±3.0 | |
| 9.7±2.2 | 42.9±3.5 | 10.2±2.6 | 48.7±5.2 | 15.1±2.8 | 26.4±2.7 | 24.7±2.8 | 59.1±3.6 | 24.8±3.1 | 76.6±4.8 | |
| T2 (2 ms) |
6.1±1.0 | 29.0±3.1 | ||||||||
| 22.8±2.6 | 71.0±4.0 | |||||||||
| T2 (3 ms) |
5.4±1.4 | 27.3±3.5 | ||||||||
| 21.9±2.7 | 72.7±4.4 | |||||||||
| T1ρ (500 Hz) |
2.2±1.7 | 46.5±4.5 | 2.8±1.8 | 19.6±3.5 | ||||||
| 4.1±2.2 | 30.5±2.8 | 5.5±2.2 | 51.3±4.9 | 7.9±1.8 | 40.8±4.4 | 8.0±1.4 | 13.1±2.7 | 33.2±3.5 | 100 | |
| 19.8±3.9 | 23.0±3.0 | 20.1±5.6 | 29.1±3.2 | 23.4±3.4 | 59.2±5.7 | 34.7±3.0 | 86.9±4.2 | |||
| T1ρ (1000 Hz) |
8.4±3.8 | 78.5±4.4 | 10.0±2.2 | 69.1±5.4 | 18.8±3.2 | 41.1±4.9 | 38.8±3.3 | 100 | 38.3±3.1 | 100 |
| 34.8±3.2 | 21.5±3.7 | 33.2±3.5 | 30.9±4.1 | 34.3±4.2 | 58.9±5.1 | |||||
| T1ρ (3000 Hz) |
24.2±3.3 | 79.6±5.0 | 27.9±3.7 | 67.4±4.5 | 50.4±5.3 | 100 | 56.6±3.1 | 100 | 49.9±3.8 | 100 |
| 54.9±4.0 | 20.4±3.1 | 57.5±5.0 | 32.6±3.4 | |||||||
| T1ρ (5000 Hz) |
32.9±3.9 | 80.6±4.8 | 37.1±3.8 | 66.2±4.3 | 61.6±4.8 | 100 | 65.9±4.1 | 100 | 60.5±4.9 | 100 |
| 65.9±4.4 | 19.4±3.6 | 64.4±5.3 | 33.8±2.7 | |||||||
DISCUSSION
The measurement of multi-component T2 and T1ρ relaxation times in connective tissues is not trivial because of a number of interdependent complications, which include a variety of experimental subtleties, the complex nature of the relaxation mechanisms, and the multifaceted structures of connective tissues. In this NMR spectroscopy and µMRI project, several critical aspects related to the multi-component T2 and T1ρ relaxation times were investigated in the context of canine tendon. These aspects included: (1) the influence of the echo spacing in the T2 experiments (from 0.6 ms to 3 ms); (2) the influence of the spin-lock frequencies on the T1ρ relaxation (from 0.5 kHz to 5 kHz); (3) the influence of the specimen orientation in the magnetic field (0°, 30°, 45°, 55°) on both T2 and T1ρ relaxation; and (4) the influence of the image resolution in µMRI T2 experiments (from 35 µm to 280 µm). These aspects cover most of the adjustable parameters in any practical experiment.
Isotropy of T1 relaxation in tendon
It is clear that the NMR signal intensity was strongly orientational dependent (Fig 1), where the ratio between the maximum and minimum intensities was about 5:1, close to the 6:1 ratio observed by Krasnosselskaia et al at a lower field (2 Tesla) (13). T1 relaxation in tendon, however, showed little orientational dependency (Fig 1). There was a small variation in the T1 values as the function of specimen orientation (~ 2%), which was not statistically significant. This isotropic T1 result is different from a 4% orientational variation observed by Krasnosselskaia et al (13), but is consistent with the similar results observed in articular cartilage by MRI (23). This isotropic T1 result demonstrated that the anisotropic motion of the water in native tendon lacked the high frequencies that were able to stimulate transitions between the energy levels.
Anisotropy of multi-component T2 relaxation in tendon
T2 relaxation measures the loss of the phase coherence among the nuclear spins after they are tipped to the transverse plane. In the radial zone of articular cartilage that also contains a well-organized collagen structure, T2 was found to be strongly anisotropic and followed the geometric factor in the spin Hamiltonian, (3cos2θ - 1) (23). The anisotropies of multi-component T2 relaxation (both value and population) in tendon is therefore expected (4,6,8,33,34), which has been confirmed in this project. The trends of all T2 components found in this project are that the values become larger when the specimen is oriented closer to the magic angle, which agree with the observation of Peto et al (33). For T2 measurement at the magic angle where the dipolar interaction is minimized, the T2 values for the two long components are the longest. The shortest component of T2 by NMR spectroscopy was challenging to detect because it could only be measured by the first several data points in the decaying signal. They were undetectable at 0° and 30° and became detectable at 45° and 55°. We believe this shortest T2 component in tendon is anisotropic, from below our detection limit (less than 1.5 ms) when the sample was at 0° and 30° to the detectable ranges at 45° and 55°. This conclusion agrees with the previous observation for the anisotropy of the shortest T2 component in tendon (6,8).
NMR spectroscopy results at different echo spacings showed three components when the spacing was 1 ms or less, and two components when the echo spacing was longer than 1 ms. This result illustrates the need of short echo time in the multi-component experiments (such as UTE experiments (18,19)), and the reason why one could only see two components in imaging experiments due to its relatively long echo times hence missing the shortest one. The effective echo time (TE) in our imaging segment was 3.9 ms, which limited the identification of the rapidly relaxing component by MRI.
Anisotropy of multi-component T1ρ relaxation in tendon
T1ρ refers to the spin-lattice relaxation time in the rotating frame and is known to be sensitive to the slow motion interactions between water and macromolecules (proteins) in biological tissues (16,35). Compared to the T2 relaxation, T1ρ relaxation has one additional variable, the dispersion characteristic that depends upon the strength of the spin-lock field. From the data summarized in Table 1, it is clear that the value and population of T1ρ components are strongly dependent on the spin-lock strength, which have several features. For example, the values of the three T1ρ components increase with the increase of the spin-lock field and with the closer orientation to the magic angle. Hence the bottom right corner of Table 1 (where the dipolar interaction is the least and the spin-lock field is the strongest) has the smallest number of T1ρ components and the largest T1ρ values. At the magic angle, T1ρ relaxation at a sufficient spin-lock field (> 1000 Hz) has only one high-value T1ρ component in both NMR and MRI experiments. This transition between multiple components and a single component implies that there are sufficient exchange processes that are able to mask the difference between different pools of water molecules when the dipolar interaction is minimized (at the magic angle).
In comparison, the top left corner of Table 1 (where the dipolar interaction is the most and the spin-lock field is the weakest) should have the biggest number of T1ρ components and the smallest T1ρ values. The lack of the shortest component in T2 at 0° was not due to the lack of this pool of water but due to the detection inability (a relatively long echo time in the experiments). This undetectable pool of the bound water by T2 measurement appeared in T1ρ measurement when spin-lock strength was set at 0.5 kHz, which illustrated a strategy in this type of measurement, using T1ρ at a spin-lock strength for the detection of the rapid decay components in connective tissue. Note that in most clinical MRI, the highest possible spin-lock frequency in any T1ρ measurement is about 0.5 kHz, which means that the T1ρ values in clinical MRI are still under the inference of a weak dipolar interaction (hence still possessing a weak orientational dependency).
Association of multi-component relaxation with different molecular populations
Three distinct components were found in tendon by the NMR experiments when the dipolar interaction was minimized (near and at the magic angle, c.f. Table 1). Following the customary approaches in the literature (7), one can associate the three relaxation components with the strongly bound water (tightly bound to the collagens), the loosely bound water (weakly bound to collagens or other macromolecules such as proteoglycans), and the lattice water (the slowly relaxing component), respectively. Comparing with the heterogeneously structured articular cartilage, where the tissue has three distinct depth-dependent collagen orientations across the tissue thickness (23,36), tendon is commonly considered to have just one major fibril orientation, which can be recognized by the uniformity of the tendon images (Fig 5) and the orientational dependence of the NMR intensity (Fig 1). The fact that three components of relaxation can be measured in tendon confirms the existence of multiple molecular populations in the tissue.
It should be pointed out that the population in Table 1 is a relative measure in the NNLS calculation, which considers the total detectable signals as 100%. In the event that one component is too short to measure (e.g., in the T2 case at small angles such as 0° and 30°), the remaining two components become the total signal. Consequently, the populations between T2 at 30° and T2 at 45° are not numerically comparable. In addition, different experimental conditions (e.g., the orientation at the magic angle, or the use of a high spin-lock frequency) can manipulate the exchange process between different pools of water molecules, hence changing the population characteristics for each pool of water molecules. When the three components can be differentiated (e.g., T1ρ at 0°), the two short components had more than 75% of the total population, which agreed with the assessments in the literatures (4,8,33). A more precise description of the molecular environment in each water population requires additional work.
In conclusion, the isotropic T1 and anisotropic T2 and T1ρ in tendon are likely the indications of slow macromolecular motion, possibly related to highly constrained and heterogeneous motions of the water molecules in the collagen matrix of tendon. The transition between a mono-component and multi-component in this and other recent studies (16) demands the caution in interpreting the multi-component relaxation results, where several experimental factors can influence the measurable values and numbers of the relaxation parameters. One might also be able to use this feature in the clinical MRI study of connective tissues, where the tissue environment is altered due to tissue degradation, such as the loss of proteoglycans and the orientation change of the collagens. The fact that the tendon’s relaxation does not depend upon the imaging resolution demonstrates that the high-resolution results from this µMRI project can equally be applied to the clinical MRI research, where the imaging resolution is coarser.
ACKNOWLEDGEMENT
Yang Xia is grateful to the National Institutes of Health for the R01 grants (AR 045172 and AR 052353). The authors are indebted to Drs. Cliff Les and Hani Sabbah (Henry Ford Hospital, Detroit) for providing the canine tendon specimens, Mr Farid Badar (Dept of Physics, Oakland University) for helping with the tissue harvest and the experiments, and Ms Carol Searight (Dept of Physics, Oakland University) for editorial comments.
REFERENCES
- 1.Kannus P. Structure of the tendon connective tissue. Scand J Med Sci Sports. 2000;10:312–320. doi: 10.1034/j.1600-0838.2000.010006312.x. [DOI] [PubMed] [Google Scholar]
- 2.Schneider M, Demco DE, Blumich B. 1H NMR imaging of residual dipolar couplings in cross-linked elastomers: dipolar-encoded longitudinal magnetization, double-quantum, and triple-quantum filters. J Magn Reson. 1999;140:432–441. doi: 10.1006/jmre.1999.1863. [DOI] [PubMed] [Google Scholar]
- 3.Navon G, Eliav U, Demco DE, Blumich B. Study of order and dynamic processes in tendon by NMR and MRI. J Magn Reson Imaging. 2007;25:362–380. doi: 10.1002/jmri.20856. [DOI] [PubMed] [Google Scholar]
- 4.Fullerton GD, Rahal A. Collagen structure: the molecular source of the tendon magic angle effect. J Magn Reson Imaging. 2007;25:345–361. doi: 10.1002/jmri.20808. [DOI] [PubMed] [Google Scholar]
- 5.Zheng S, Xia Y. Multi-components of T2 relaxation in ex vivo cartilage and tendon. J Magn Reson. 2009;198:188–196. doi: 10.1016/j.jmr.2009.02.005. [DOI] [PMC free article] [PubMed] [Google Scholar]
- 6.Fullerton GD, Cameron IL, Ord VA. Orientation of tendons in the magnetic field and its effect on T2 relaxation times. Radiology. 1985;155:433–435. doi: 10.1148/radiology.155.2.3983395. [DOI] [PubMed] [Google Scholar]
- 7.Peto S, Gillis P, Henri VP. Structure and dynamics of water in tendon from NMR relaxation measurements. Biophys J. 1990;57:71–84. doi: 10.1016/S0006-3495(90)82508-X. [DOI] [PMC free article] [PubMed] [Google Scholar]
- 8.Takamiya H, Kusaka Y, Seo Y, et al. Characteristics of proton NMR T2 relaxation of water in the normal and regenerating tendon. Jpn J Physiol. 2000;50:569–576. doi: 10.2170/jjphysiol.50.569. [DOI] [PubMed] [Google Scholar]
- 9.Haken R, Blumich B. Anisotropy in tendon investigated in vivo by a portable NMR scanner, the NMR-MOUSE. J Magn Reson. 2000;144:195–199. doi: 10.1006/jmre.2000.2040. [DOI] [PubMed] [Google Scholar]
- 10.Eliav U, Navon G. Multiple quantum filtered NMR studies of the interaction between collagen and water in the tendon. J Am Chem Soc. 2002;124:3125–3132. doi: 10.1021/ja011791n. [DOI] [PubMed] [Google Scholar]
- 11.Fechete R, Demco DE, Blumich B, Eliav U, Navon G. Anisotropy of collagen fiber orientation in sheep tendon by 1H double-quantum-filtered NMR signals. J Magn Reson. 2003;162:166–175. doi: 10.1016/s1090-7807(02)00200-8. [DOI] [PubMed] [Google Scholar]
- 12.Takeuchi M, Sekino M, Iriguchi N, Ueno S. Spin-spin relaxation and apparent diffusion coeffecient of mangetically oriented collagen gels. IEEE T Magn. 2004;40:2976–2978. [Google Scholar]
- 13.Krasnosselskaia LV, Fullerton GD, Dodd SJ, Cameron IL. Water in tendon: orientational analysis of the free induction decay. Magn Reson Med. 2005;54:280–288. doi: 10.1002/mrm.20540. [DOI] [PubMed] [Google Scholar]
- 14.Du J, Chiang AJ, Chung CB, et al. Orientational analysis of the Achilles tendon and enthesis using an ultrashort echo time spectroscopic imaging sequence. Magn Reson Imaging. 2010;28:178–184. doi: 10.1016/j.mri.2009.06.002. [DOI] [PubMed] [Google Scholar]
- 15.Ruberti JW, Sokoloff JB. Theory of the short time mechanical relaxation in articular cartilage. J Biomech Eng. 2011;133 doi: 10.1115/1.4005174. 104504. [DOI] [PubMed] [Google Scholar]
- 16.Wang N, Xia Y. Dependencies of multi-component T2 and T1rho relaxation on the anisotropy of collagen fibrils in bovine nasal cartilage. J Magn Reson. 2011;212:124–132. doi: 10.1016/j.jmr.2011.06.031. [DOI] [PMC free article] [PubMed] [Google Scholar]
- 17.Fathima NN, Baias M, Blumich B, Ramasami T. Structure and dynamics of water in native and tanned collagen fibers: Effect of crosslinking. Int J Biol Macromol. 2010;47:590–596. doi: 10.1016/j.ijbiomac.2010.08.003. [DOI] [PubMed] [Google Scholar]
- 18.Du J, Carl M, Diaz E, et al. Ultrashort TE T1rho (UTE T1rho) imaging of the Achilles tendon and meniscus. Magn Reson Med. 2010;64:834–842. doi: 10.1002/mrm.22474. [DOI] [PubMed] [Google Scholar]
- 19.Diaz E, Chung CB, Bae WC, et al. Ultrashort echo time spectroscopic imaging (UTESI): an efficient method for quantifying bound and free water. NMR Biomed. 2012;25:161–168. doi: 10.1002/nbm.1728. [DOI] [PubMed] [Google Scholar]
- 20.Cameron I, Fullerton G. Interfacial water compartments on tendon/collagen and in cells. Phase Transitions in Cell Biology. 2008:43–50. [Google Scholar]
- 21.Peh WC, Chan JH. The magic angle phenomenon in tendons: effect of varying the MR echo time. Br J Radiol. 1998;71:31–36. doi: 10.1259/bjr.71.841.9534696. [DOI] [PubMed] [Google Scholar]
- 22.Oatridge A, Herlihy AH, Thomas RW, et al. Magnetic resonance: magic angle imaging of the Achilles tendon. Lancet. 2001;358:1610–1611. doi: 10.1016/S0140-6736(01)06661-2. [DOI] [PubMed] [Google Scholar]
- 23.Xia Y. Relaxation anisotropy in cartilage by NMR microscopy (µMRI) at 14-µm resolution. Magn Reson Med. 1998;39:941–949. doi: 10.1002/mrm.1910390612. [DOI] [PubMed] [Google Scholar]
- 24.Xia Y, Moody JB, Alhadlaq H. Orientational dependence of T2 relaxation in articular cartilage: A microscopic MRI (µMRI) study. Magn Reson Med. 2002;48:460–469. doi: 10.1002/mrm.10216. [DOI] [PubMed] [Google Scholar]
- 25.Du J, Pak BC, Znamirowski R, et al. Magic angle effect in magnetic resonance imaging of the Achilles tendon and enthesis. Magn Reson Imaging. 2009;27:557–564. doi: 10.1016/j.mri.2008.09.003. [DOI] [PubMed] [Google Scholar]
- 26.Lattanzio PJ, Marshall KW, Damyanovich AZ, Peemoeller H. Characterization of proteoglycan depletion in articular cartilage using two-dimensional time domain nuclear magnetic resonance. Magn Reson Med. 2005;54:1397–1402. doi: 10.1002/mrm.20692. [DOI] [PubMed] [Google Scholar]
- 27.Zheng S, Xia Y. On the measurement of multi-component T2 relaxation in cartilage by MR spectroscopy and imaging. Magn Reson Imaging. 2010;28:537–545. doi: 10.1016/j.mri.2009.12.006. [DOI] [PMC free article] [PubMed] [Google Scholar]
- 28.Whittall KP, Mackay AL. Quantitative Interpretation of Nmr Relaxation Data. J Magn Reson. 1989;84:134–152. [Google Scholar]
- 29.Lawson CL, Hanson RJ. Solving least squares problems: Society for Industrial Mathematics. 1995 [Google Scholar]
- 30.Santyr GE, Henkelman RM, Bronskill MJ. Variation in Measured Transverse Relaxation in Tissue Resulting from Spin Locking with the Cpmg Sequence. J Magn Reson. 1988;79:28–44. [Google Scholar]
- 31.Saab G, Thompson RT, Marsh GD. Multicomponent T2 relaxation of in vivo skeletal muscle. Magn Reson Med. 1999;42:150–157. doi: 10.1002/(sici)1522-2594(199907)42:1<150::aid-mrm20>3.0.co;2-5. [DOI] [PubMed] [Google Scholar]
- 32.Oh J, Han ET, Pelletier D, Nelson SJ. Measurement of in vivo multi-component T2 relaxation times for brain tissue using multi-slice T2 prep at 1.5 and 3T. Magn Reson Imaging. 2006;24:33–43. doi: 10.1016/j.mri.2005.10.016. [DOI] [PubMed] [Google Scholar]
- 33.Peto S, Gillis P. Fiber-to-field angle dependence of proton nuclear magnetic relaxation in collagen. Magn Reson Imaging. 1990;8:705–712. doi: 10.1016/0730-725x(90)90005-m. [DOI] [PubMed] [Google Scholar]
- 34.Zheng S, Xia Y. Effect of phosphate electrolyte buffer on the dynamics of water in tendon and cartilage. NMR Biomed. 2009;22:158–164. doi: 10.1002/nbm.1294. [DOI] [PMC free article] [PubMed] [Google Scholar]
- 35.Li X, Benjamin Ma C, Link TM, et al. In vivo T1rho and T2 mapping of articular cartilage in osteoarthritis of the knee using 3 T MRI. Osteoarthritis Cartilage. 2007;15:789–797. doi: 10.1016/j.joca.2007.01.011. [DOI] [PMC free article] [PubMed] [Google Scholar]
- 36.Xia Y, Farquhar T, Burton-Wurster N, Lust G. Origin of cartilage laminae in MRI. J Magn Reson Imaging. 1997;7:887–894. doi: 10.1002/jmri.1880070518. [DOI] [PubMed] [Google Scholar]


