Abstract
Purpose
To develop a tissue fixation method that preserves in vivo manganese enhancement for ex vivo magnetic resonance imaging (MRI). The needs are clear as conventional in vivo manganese enhanced MRI (MEMRI) applied to live animals is time-limited, hence limited in spatial resolution and signal-to-noise ratio. Ex vivo applications can achieve superior spatial resolution and signal-to-noise ratio through increased signal averaging and optimized radiofrequency coil designs. A tissue fixation method that preserves in vivo Mn2+ enhancement post-mortem is necessary for ex vivo MEMRI.
Materials and Methods
T1 measurements and T1-weighted MRI were performed on MnCl2 administered mice. The mice were then euthanized and the brains were fixed using one of two brain tissue fixation methods - aldehyde solution or focused beam microwave irradiation (FBMI). MRI was then performed on the fixed brains.
Results
T1 values and T1-weighted signal contrasts were comparable between in vivo and ex vivo scans on aldehyde fixed brains. FBMI resulted in the loss of Mn2+ enhancement.
Conclusion
Aldehyde fixation, not FBMI, maintained in vivo manganese enhancement for ex vivo MEMRI.
Keywords: MRI, manganese enhanced MRI, ex vivo MRI, tissue fixation, aldehyde, focused beam microwave irradiation
Introduction
Manganese enhanced MRI (MEMRI) is a valuable tool for the evaluation of brain structure and function(1). Imaging using MEMRI as an in vivo technique is limited in spatial resolution and signal sensitivity due to restricted scan time. This can be overcome if MEMRI is carried out ex vivo to achieve ultra-high resolution (pixel size of 100 μm or less in all dimensions) and improved signal-to-noise ratio compared to in vivo scans. This is achieved through increased signal averaging and the use of radiofrequency (RF) coils optimized to brain size. However maintenance of in vivo Mn2+ distribution post-mortem is critical to the success of ex vivo MEMRI studies.
In this study, we tested two tissue fixation techniques to assess which one could preserve Mn2+ induced MRI signal enhancement in the brain. One group of fixation methods included the use of three aldehyde solutions that have been previously used for brain calcium and manganese detection(2-5). The second technique employed focused beam microwave irradiation (FBMI). This technique uses a brief high power microwave pulse for rapidly heating brain tissue. This serves to partially denature proteins and halt enzyme activity, thereby minimizing enzyme dependent post-mortem metabolic changes(6,7).
Materials and Methods
Animals
The animal procedures were approved by the Institutional Animal Care and Use Committee at the University of Nebraska Medical Center. Seventeen NOD/scid-γcnull mice (NSG, male, weight = 28.5 ± 2.4 grams, age = 1 year) from a breeding colony in our institution were used in the study. NSG mice are widely used for the evaluation of human disease pathobiology and therapeutic interventions as they can readily be reconstituted with human cells.
MnCl2 Administration
Fourteen of the 17 mice were administered MnCl2 systemically. The mouse was placed on an electrically heated tail vein injection platform (Braintree Scientific, MA), and was anesthetized by inhalation of isoflurane in 100% oxygen. Breathing rate, cardiac rate and blood oxygen saturation were continuously monitored. Anesthesia level was varied from 0.5% to 1.5% isoflurane to maintain the respiration rate between 40-80 per minute. The MnCl2·4H2O (Sigma-Aldrich, St Louis, MO) was added to saline to make a 120 mM MnCl2 solution. This MnCl2 solution was administered at the dose of 120 mg/kg bodyweight using intravenous injections through the tail vein. Injection of the MnCl2 was accomplished gradually using a syringe pump (Harvard Apparatus, MA) at the rate of 125 μL/hour. The mice were observed for up to two hours after injection for any side effect of MnCl2. If tremor or convulsions was observed and persisted longer than three minutes or lethargy was observed within 24 hours prior to MRI, the mouse was euthanized.
In Vivo MRI
MRI was performed 24 hours after MnCl2 administration in the 14 mice(1). The remaining three mice were scanned for baseline measurements without MnCl2 infusion. MRI was performed in a Bruker Bioscan 7 Tesla/21 cm bore diameter small animal scanner (Bruker, Billerica, MA) with a custom-built surface coil as the RF signal receiver. Each mouse was anesthetized by inhalation of isoflurane in 100% oxygen at the flow rate of 1 L/minute. Anesthesia level was varied during the acquisition from 0.5% to 1.5% isoflurane to maintain the respiration rate between 40-80 per minute. T1 measurement was performed using a fast spin echo sequence with variable TRs from 250 to 14000 ms with RARE factor = 4, TE = 8 ms, 12 axial slices, slice thickness = 0.5 mm contiguous, 176 × 156 in-plane matrix with isotropic in-plane pixel size = 100 μm × 100 μm. Three-dimensional T1-wt MRI was acquired using a spin echo sequence with: TR/TE = 600/8 ms, averages = 4, 176 × 128 × 128 matrix, 100 μm isotropic pixel size.
Aldehyde Fixation
After MRI, nine MnCl2 injected mice were euthanized, and the brains were then fixed. Three aldehyde solutions were used for groups of three animals, and included 4% paraformaldehyde (PFA) and 0.1% glutaraldehyde (GA) (Fixative I), 1.5% GA (Fixative II) and 3% GA (Fixative III). All aldehyde solutions were made in phosphate buffered saline (PBS). Mice were first anesthetized using isoflurane, and then the thoracic cavity was surgically opened for transcardiac perfusion using Tyrode's solution (Sigma-Aldrich, St Louis, MO) adjusted to pH 7.4 with sodium bicarbonate. The animal was perfused using approximately 30 ml of solution followed by 100 ml of one of the three fixatives. The brain was then removed from the skull and post-fixed in the same fixative for 12 hours, and then transferred to PBS.
Microwave Fixation
Following MRI, FBMI was used on five MnCl2 injected mice. A 10 kW Muromachi Microwave Fixation System (Stoelting Co, Wood Dale, IL, USA) was used to fix the brains. The mouse was first anesthetized using isoflurane as previously described and then placed in a dedicated animal holder to constrain its head at the proper microwave targeting area. The animal was irradiated at 4.9 kW in 0.58 seconds, which halted cerebral metabolism and stabilized tissue relaxivities as shown in a previous study(6). Following microwave fixation, the brain was harvested and suspended in perfluorocarbon oil (Fomblin, Fisher Scientific, Pittsburg, PA) for MRI.
Brain Immersions
The three mice without MnCl2 infusion were anesthetized with isoflurane as previously described, and perfused first using Tyrode's solution, and then Fixative I. The brain was removed from the skull and post-fixed in Fixative I for 12 hours. The brain was then transferred to 5 ml of 0.24 mM MnCl2 solution(8). The immersion lasted seven days before MRI, a time at which the Mn2+ concentration had reached equilibrium in the brain(8).
Ex Vivo MRI
After aldehyde fixation or FBMI, brains were scanned again to assess ex vivo relaxation times and to acquire MR images. Brains fixed using aldehyde were scanned using MRI less than 48 hours after euthanasia. FBMI fixed brains were scanned immediately after fixation. For brains immersed in MnCl2, MRI was performed after seven days of immersion. MRI were performed using the same scanner as for in vivo MRI with a custom-built solenoid coil. The brain was placed in a glass tube filled with Fomblin. For the brains from mice with in vivo injected MnCl2, the acquisition parameters used for relaxation measurements and T1-wt MRI were the same as those used for in vivo imaging. For the mouse brains immersed in MnCl2, T1 measurement was performed using a fast spin echo sequence with TRs from 140 to 6000 ms with TE = 8 ms. The slice thickness, matrix and pixel size were the same for both in vivo and ex vivo measurements. The 3D T1-wt MRI for the MnCl2 immersed mouse brains was also acquired using a spin echo sequence with TR/TE = 60/8 ms, averages = 4, 176 × 128 × 128 matrix, 100 μm isotropic pixel size.
Statistical Analyses
Based on Paxinos mouse brain atlas(9), brain structures including cerebral cortex (CTX), caudoputamen (CP), thalamus (TH), hypothalamus (HY) and midbrain (MB) were outlined manually on the T1 maps using the ROI function in Analyze (AnalyzeDirect, KS). Point ROI measurements were used on the sub-structures of hippocampus (HIP) including pyramidal layer (Py), the granular layer of dentate gyrus (GrDG), and Cornu ammonis (CA) regions, and the cortical layers of cerebellum (CB) including the granular layer (GrCBX) and other layers (CBX-other). ANOVA was used for the relaxation time comparison between neurostructures, and paired t-test was used to determine the significance of changes in relaxation times on each neurostructure caused by different fixation methods. For the point measurements on HIP and CB cortex, Mann-Whitney rank sum test was used to compare the T1 values on different sub-structures. In all the statistical analyses, p < 0.05 was used for rejecting the null hypotheses.
Results
No significant differences of T1 values were found between the brains fixed with any of the aldehyde solutions. Thus all were grouped together for statistical analysis and designated as aldehyde fixation.
T1 values and T1-wt MRI of Major Neurostructures
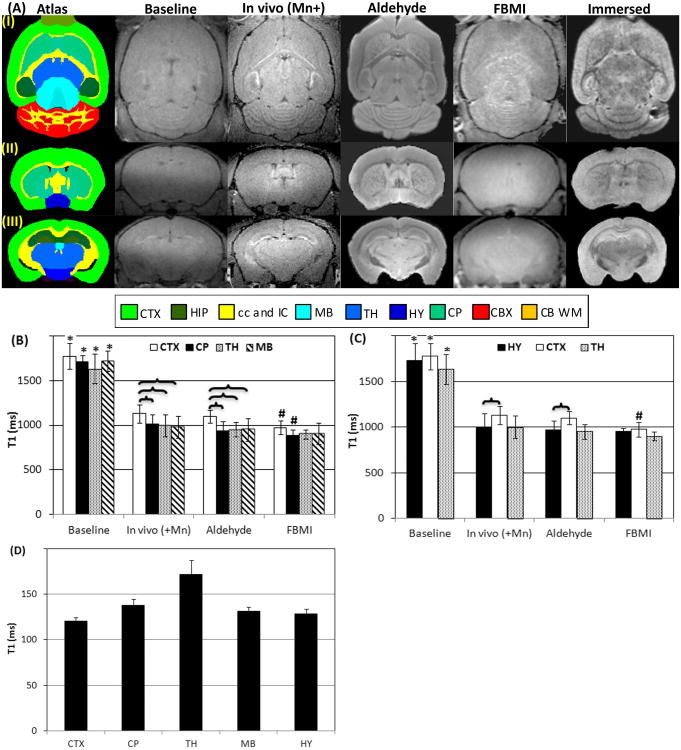
Figure 1A shows the T1-wt images of baseline in vivo scans, Mn2+ enhanced in vivo scans, and brains fixed using aldehyde and FBMI. Diagrams from the mouse brain atlas created by the UCLA Laboratory of Neuroimaging (LONI) were included as the neurostructure reference. As shown in Figure 1A, T1-wt signal enhancement was seen on in vivo MEMRI, most notably within HIP and CB. The T1 values were significantly decreased by Mn2+ administration for CTX, CP, TH, MB and HY compared to baseline scans (Figure 1A, B and C). The Mn2+ enhancement of ex vivo MRI in the aldehyde fixed brains was statistically equivalent to in vivo MEMRI including the pattern of in vivo signal contrast between structures. The T1 measurements showed that CTX had a significantly higher T1 value compared to the adjacent brain regions on both in vivo MRI and aldehyde fixed brains (Figure 1B) leading to considerable contrast between these structures on T1-wt MRI (Figure 1A). The structures of CP, TH and MB had similar T1 values (Figure 1B). From the coronal view in Figure 1A (Row II and III), HY showed more enhanced T1-wt signal than on CTX but comparable to TH. The comparison of T1 values of these structures showed that HY had shorter T1 than CTX (Figure 1C).
Figure 1.
(A) Row (I): Axial slices include the structures of CTX, CP, TH, MB and cerebellum; Row (II): Coronal slices show CTX, CP and HY; Row (III): Coronal slices show CTX, HIP, TH and HY. From left to right: Column 1 is the mouse brain atlas from UCLA LONI; Column 2 shows the baseline MRI; Column 3 is the in vivo MRI of a Mn2+ infused mouse; Column 4 is the ex vivo MRI of a mouse fixed using an aldehyde fixative; Column 5 is an animal fixed by FBMI; and Column 6 is the ex vivo MRI of a MnCl2 immersed brain. (B) T1 values on CTX, CP, TH and MB measured in baseline MRI, in vivo manganese enhanced MRI (in vivo (+Mn)), ex vivo MRI of animals fixed using chemicals and FBMI. (C) T1 values on HY, CTX and TH. (D) T1 values in MnCl2 immersed brains.
*: significant difference between baseline scans and in vivo manganese enhanced measurements
#: significant difference between in vivo manganese enhanced measurements and ex vivo scans after fixation
 : significant difference between two structures.
Abbr. in Figure 1: CB WM - cerebellar white matter, CBX - cerebellar cortex, cc – corpus callosum, CP – caudoputamen, CTX - cerebral cortex, HIP – hippocampus, HY – hypothalamus, IC – internal capsule, MB – midbrain, TH - thalamus
Fixation by FBMI resulted in signal contrast loss for each of the major brain structures as illustrated in Figure 1A. None of the brain regions could be differentiated one from the other. The relaxation measurements on CTX and CP showed significant T1 decreases in FBMI mice compared to in vivo MEMRI, with negligible difference in T1 among neurostructures (Figure 1B and C). It was also noted in Figure 1A that no Mn2+ enhancement of signal contrast could be observed on sub-structures of HIP and CB cortical layers.
The T1 values of the brains immersed in the MnCl2 solution were less than 200 ms as shown in Figure 1D. The brains showed different signal contrast among the structures compared to both in vivo and ex vivo aldehyde fixed MEMRI. As seen in Figure 1A, CTX and HY showed higher signal intensity when compared to CP and TH, respectively. The relaxation time measurements confirmed this observation, showing shorter T1 on CTX and HY than on CP and TH (Figure 1D).
T1 values and T1-wt MRI of Sub-structures of HIP and CBX
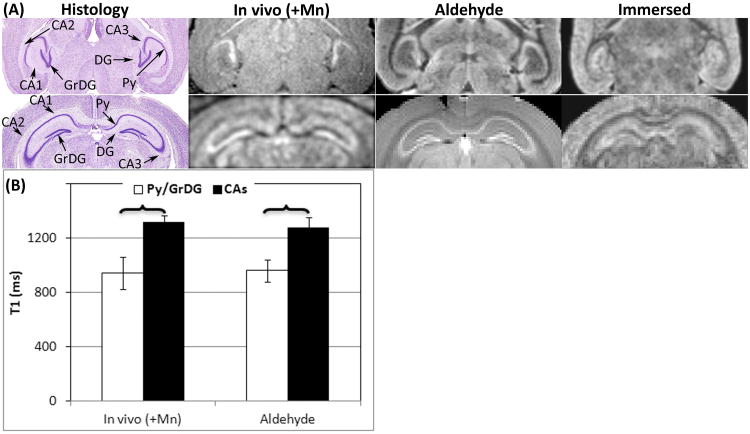
The T1-wt signal enhancement of sub-structures of HIP and CBX observed on in vivo MRI was preserved in ex vivo aldehyde fixed brains. The sub-structures of HIP and CB are shown in Figures 2 and 3, respectively. The Mn2+ enhanced in vivo MRI were compared to ex vivo MRI of brains fixed by aldehyde or FBMI, and to brains immersed in MnCl2. The signal enhancement on GrDG of HIP was preserved on ex vivo MRI of aldehyde fixed brains (Figure 2A). The characteristic arrowhead shaped GrDG was enhanced when compared to surrounding tissue and is readily detected on both in vivo and ex vivo MRI. Similar enhancement was also observed on the Py of the CA regions (Figure 2A). T1 values of Py/GrDG and CA regions of HIP were calculated (Figure 2B). Statistical differences were consistent in MnCl2 enhancement between the Py/GrDG and CA regions in in vivo images and aldehyde fixed brains. In addition, there was no statistically significant difference between in vivo and aldehyde fixed brains in these regions (data not shown). The T1 measurements were not performed on mice fixed using FBMI due to difficulty in identification of sub-hippocampal structures (Figure 1A).
Figure 2.
(A) Row (I): Axial view of HIP; Row (II): Coronal view of HIP. From left to right: Column 1 is the histology of HIP from the mouse brain in stereotaxic coordinates; Column 2 shows the in vivo MEMRI; Column 3 is the ex vivo MRI of an aldehyde fixed brain; Column 4 is the ex vivo MRI of a MnCl2 immersed brain. (B) T1 values on sub-structures of HP including Py/GrDG and CAs measured in in vivo MEMRI (in vivo (+Mn)), ex vivo MRI of aldehyde fixed brains.
 : significant difference between two structures.
Abbr. in Figure 2: HIP – hippocampus, Py - pyramidal layer, GrDG - granular layer of dentate gyrus
Figure 3.
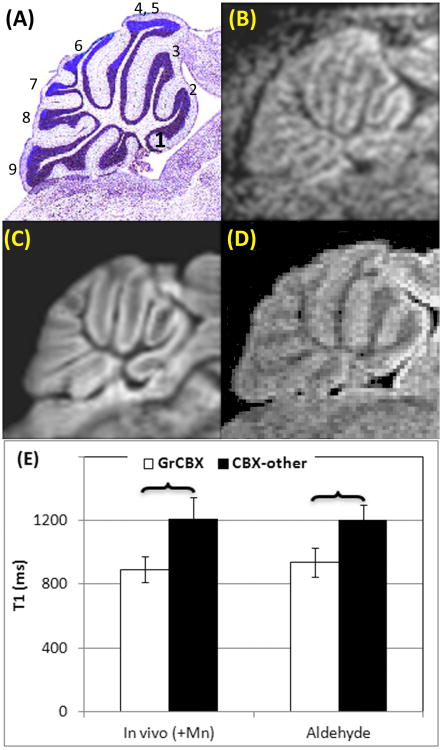
Sagittal slices of CB. (A): Histology from Paxinos mouse brain atlas. The first to tenth cerebellar lobules were identified and numbered. (B): In vivo MEMRI. (C): Ex vivo MRI of an aldehyde fixed brain. (D): Ex vivo MRI of a brain immersed in MnCl2. (E) T1 values on sub-structures of CBX including GrCBX and other layers measured from in vivo MEMRI (in vivo (+Mn)), ex vivo MRI of brains fixed using aldehyde.
 : significant difference between two structures.
Abbr. in Figure 3: CB – cerebellum, CBX - cerebellar cortex, CBX-other - layers of cerebellar cortex other than granular layer, GrCBX - granular layer of cerebellar cortex
On in vivo MEMRI, GrCBX was enhanced including all CB lobules (Figure 3A - C). It is also of note that the CB molecular and Purkinji cell layers were less enhanced. This signal enhancement pattern was preserved in ex vivo MRI of the Mn2+ infused mice fixed using aldehydes, as shown in Figure 3C. The T1 measurements of GrCBX versus other layers of the CBX were performed and included in Figure 3E. The T1 values of GrCBX and other layers in in vivo MRI were maintained in ex vivo MRI of aldehyde fixed brains. This signal enhancement was lost in the animals fixed using FBMI (Figure 1A).
The signal intensity pattern of HP in the brains immersed in MnCl2 was distinct from in vivo scans or aldehyde fixed brains (Figure 2A). The signal intensity on CA regions was enhanced. However, it was difficult to identify sub-hippocampal structures and as a result, T1 measurements were not performed. The cerebral cortex of all the cerebellar lobules was enhanced on the ex vivo MRI of the immersed brains similar to the in vivo MRI (Figure 3D). However the granular layer was not enhanced making it difficult to identify the individual CBX components.
In summary, aldehyde fixed brains had no significant difference on T1 values of major neurostructures and sub-structures in HIP and CB as compared to in vivo measurements. The T1-wt signal contrast among the structures of the aldehyde fixed brains was comparable to the contrast of in vivo scans. On the other hand, FBMI caused significantly decreased T1 on CTX and CP, and the contrast between the structures and sub-structures was diminished.
Discussion
The results of relaxation measurements and T1-wt MRI indicate that in vivo localization of Mn2+ in brain tissue was preserved by aldehyde fixation. Our results suggest that aldehyde fixation arrests passive diffusion of Mn2+ out of neurons. The reaction of formaldehyde with proteins is based on classical carbonyl-amine reactions. Amines and related nucleophiles react with formaldehyde to generate methylene bridging (-CH2-) resulting in fixation. Glutaraldehyde forms aminomethyls and then further condenses with other groups, such as phenolics, imidazoles, indoles, sulfhydryl of cysteine and also in the formation of bridged linkages. It is possible that the ion channel proteins were cross-linked by the fixatives, regardless of mechanisms, thereby preventing Mn2+ and other ions from leaving neurons.
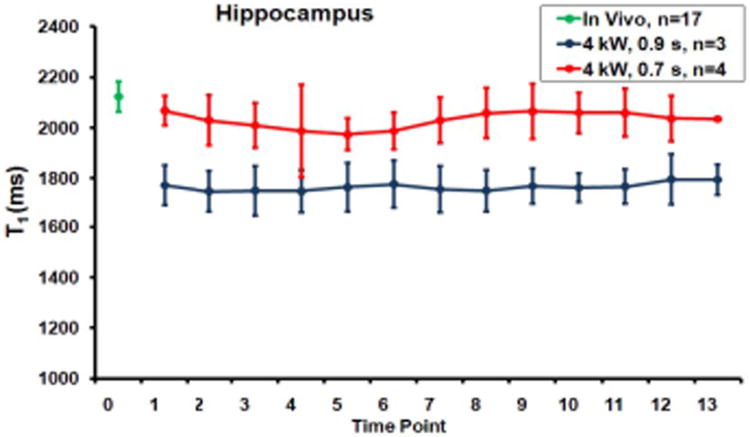
The results showed that microwave fixation caused significant redistribution of Mn2+ to equalize the T1 shortening among different anatomical regions. In another study(6), we investigated the FBMI effect on relaxation times on a group of younger mice of the same strain without Mn2+ administration. Both low (4 kW, 0.7 ms) and high (4 kW, 0.9 ms) FBMI fixations were tested in this study. The study has found that T2 in brain tissue was unaltered by FBMI at either high or low irradiation energies. However, T1 was reduced at the higher energy. T1 values remained constant for the duration of the measurement after the fixation. Figure 4 demonstrated the T1 values of HIP before and after FBMI fixation. Measures from other regions of interest show similar trends. These results suggested that the observed T1 decease on CTX and CP in Figure 1B and C resulted directly from FBMI fixation. However the effects of FBMI on Mn2+ distribution in brain tissue may also contribute to the T1 decrease. Mn2+ may be dislocated by FBMI from original in vivo cellular distribution. The loss of signal contrast on T1-wt images was prominent, supporting the theory that the FBMI resulted in the dislocation of Mn2+ and the dispersion of Mn2+ from certain neurostructures such as HIP to other brain tissue. The instant heating by FBMI may have fixed open ion channels in the membrane and thus allowed the Mn2+ dispersion.
Figure 4.
T1 value from the hippocampus of mice with no Mn2+ treatment before (green point) and after 0.7 s FBMI (red) and 0.9 s FBMI (blue). Time points are in intervals of 1.17 hours. Time 0 represents the in vivo measures prior to FBMI.
The measurements of relaxation times and MRI on brains immersed in MnCl2 generated similar results as in a previous study(8). Contrary to ex vivo MRI of aldehyde fixed brains, the immersed brains showed lower T1 in CTX than CP and TH. Since this is a diffusion limited process with the likely binding of Mn2+ to macromolecules on the external portion of the cell membrane, this result suggests that the cortex has more external macromolecular binding sites for Mn2+ than CP and TH.
This study demonstrated that with appropriate fixation, in vivo Mn2+ enhancement can be preserved in fixed brains. Although in vivo MEMRI has been used to study brain functions and neuronal pathways, our study demonstrates the feasibility of using aldehyde fixation to preserve distribution of Mn2+ for the study of brain function and neuronal pathways ex vivo. Only two fixation methods were evaluated in this study. Additional brain fixation methods will be evaluated in future studies for the ability to maintain ex vivo Mn2+ enhancement. Mice were perfused before aldehyde fixation in this study. The possible effect of perfusion on Mn2+ distribution also requires further investigation.
In conclusion, we have demonstrated that aldehyde fixation can preserve Mn2+ enhancement, permitting ex vivo MEMRI on brain tissue to achieve higher spatial resolution and SNR using longer scan time. In contrast, FBMI resulted in the loss of structure specific Mn2+ enhancement. The structural and chemical integrity of brain tissue may change with time after aldehyde fixation; therefore the Mn2+ distribution in brain tissue may as well. The temporal evolution of Mn2+ distribution requires further study.
Acknowledgments
Dr. Larisa Poluektova in the Department of Pharmacology and Experimental Neuroscience provided advice and technical assistance on MnCl2 administration, animal euthanasia and brain fixation. The authors consulted Dr. Fang Yu in the College of Public Health in UNMC for the statistical analysis in this study. The authors are also thankful for the technical assistance provided by Melissa Mellon, Erin McIntyre and Jennifer Reed, and editing provided by Bruce Berrigan.
Funding support: This study is partially supported by NIH grants K25MH089851 and P01 NS43985, and funding from the Nebraska Research Initiative
References
- 1.Silva AC, Lee JH, Aoki I, Koretsky AP. Manganese-enhanced magnetic resonance imaging (MEMRI): methodological and practical considerations. NMR Biomed. 2004;17(8):532–543. doi: 10.1002/nbm.945. [DOI] [PubMed] [Google Scholar]
- 2.Henriksson J, Tjalve H. Manganese taken up into the CNS via the olfactory pathway in rats affects astrocytes. Toxicol Sci. 2000;55(2):392–398. doi: 10.1093/toxsci/55.2.392. [DOI] [PubMed] [Google Scholar]
- 3.Buchs PA, Stoppini L, Parducz A, Siklos L, Muller D. A new cytochemical method for the ultrastructural localization of calcium in the central nervous system. J Neurosci Methods. 1994;54(1):83–93. doi: 10.1016/0165-0270(94)90162-7. [DOI] [PubMed] [Google Scholar]
- 4.Mizuhira V, Hasegawa H. Microwave fixation and localization of calcium in synaptic terminals using x-ray microanalysis and electron energy loss spectroscopy imaging. Brain Res Bull. 1997;43(1):53–58. doi: 10.1016/s0361-9230(96)00428-5. [DOI] [PubMed] [Google Scholar]
- 5.Mizuhira V, Hasegawa H, Notoya M. Microwave fixation and localization of calcium in synaptic vesicles. J Neurosci Methods. 1994;55(2):125–136. doi: 10.1016/0165-0270(94)90205-4. [DOI] [PubMed] [Google Scholar]
- 6.Boska MD, McIntyre E, Mellon ML, Gendelman HE. Mouse Brain Structure and Metabolic Stability Follows Focused Beam Microwave Irradiation. Stockholm, Sweden: ISMRM; 2010. [Google Scholar]
- 7.de Graaf RA, Chowdhury GM, Brown PB, Rothman DL, Behar KL. In situ 3D magnetic resonance metabolic imaging of microwave-irradiated rodent brain: a new tool for metabolomics research. J Neurochem. 2009;109(2):494–501. doi: 10.1111/j.1471-4159.2009.05967.x. [DOI] [PMC free article] [PubMed] [Google Scholar]
- 8.Huang S, Liu C, Dai G, Kim YR, Rosen BR. Manipulation of tissue contrast using contrast agents for enhanced MR microscopy in ex vivo mouse brain. Neuroimage. 2009;46(3):589–599. doi: 10.1016/j.neuroimage.2009.02.027. [DOI] [PMC free article] [PubMed] [Google Scholar]
- 9.Paxinos G, Franklin KBJ. The mouse brain in stereotaxic coordinates. San Diego: Academic Press; 2001. xxv, 1 v. (various pagings) [Google Scholar]


