Abstract
Osteoporosis is a major health problem affecting the aging population, especially in patients 65 years of age and older. The imbalance between bone formation and bone resorption is generally accepted as the essential mechanism leading to osteoporosis. In addition to the abnormal activation of osteoclast-mediated bone resorption, the dysfunction of bone marrow stromal cells (BMSCs) in mediating bone formation has been accepted as a major contributor to the progression of senile osteoporosis. Results: In our study, senile osteoporotic hBMSCs displayed a decreasing capacity for proliferation and osteoblast differentiation, which was associated with the downregulation of integrin α2. Forced ectopic integrin α2 expression using a lentivirus vector reversed the dysfunction of senile osteoporotic hBMSCs. Additionally, the overexpression of integrin α2 upregulated the levels of Runx2 and Osterix. Mechanically, Western blot analyses revealed that integrin α2 phosphorylated ERK1/2 and the inactivation of ERK by PD98059 suppressed the osteoblastic differentiation of hBMSCs, suggesting that integrin α2 promotes osteoblast proliferation through the activation of ERK1/2 MAPK. Conclusion: Taken together, our results show that hBMSCs obtained from senile osteoporotic patients gradually lose their capability to differentiate along the osteogenic lineage and proliferate, which might be associated with the abnormal regulation of the integrin α2/ERK/Runx2 signaling pathway undergoing senile osteoporosis.
Keywords: Osteoporosis, human bone marrow stromal cells, integrin, ERK pathway
Introduction
Osteoporosis is defined by low bone mass and deteriorating bone structure, which lead to increased bone fragility and susceptibility to fracture [1-4]. This disease is classified as primary type 1 (postmenopausal osteoporosis), type 2 (senile osteoporosis), or secondary (steroid- or glucocorticoid-induced osteoporosis, among others). An imbalance between osteoblast-mediated bone formation and osteoclast-mediated bone resorption in the marrow microenvironment results in the pathogenesis of osteoporosis [5,6]. Multiple endogenous and exogenous factors have been shown to be involved in regulating bone remodeling [7-10]. Although osteoporosis risks may be prevented by lifestyle changes [11], catastrophic effects on disability and mortality, accompanied by osteoporotic fractures, still severely impact the life quality of the aging population, especially in patients 65 years of age and older. Several studies have been conducted to determine the mechanisms of postmenopausal osteoporosis and glucocorticoid-induced osteoporosis [12-14]. These studies have shown that estrogenic hormones and glucocorticoids play important roles in postmenopausal and glucocorticoid-induced osteoporosis, respectively. However, the key regulating factor(s) and the underlying mechanism of male senile osteoporosis are not clearly defined or fully understood. Therefore, we have focused on the molecular mechanism underlying male senile osteoporosis to seek more effective therapeutic targets, irrespective of estrogen and glucocorticoid influences.
A previous study showed that defective bone formation during the process of bone remodeling seemed to be the principal pathophysiological mechanism responsible for age-related bone loss [15]. Bone marrow mesenchymal cells (BMSCs) in the marrow pool are the major source of osteogenitor cells that contribute to bone remodeling in adults. Therefore, understanding the factors that regulate the osteogenic differentiation of BMSCs and strengthening the osteogenic differentiation potential of BMSCs are essential for improving strategies for osteoporosis therapy.
The adhesion and differentiation capacity of cells are initiated and mediated by the activation of α and β transmembrane integrins, which are the principle mediators of the molecular dialogue between cells and their extracellular matrix (ECM) environment [16-18]. Previous studies have revealed that αV, α5β1, αvβ3, and β3/β5 integrins are involved in the interaction between osteoblasts and the ECM and affect osteoblast function and bone remodeling [19-21]. Osteoblast mineralization was reduced significantly during osteogenesis following perturbation with α5 or β1 integrin subunit antibodies by approximately 20% and 45%, respectively, with αVβ3 integrin by nearly 65%, and with α2β1 integrin by nearly 95% [22]. Moreover, integrin α2β1, α5β1, and αVβ3 were found to activate intracellular signaling cascades and, subsequently, to up-regulate the expression of alkaline phosphatase (ALP) and osteocalcin (OCN) during osteogenic differentiation in hBMSCs [23-25]. However, whether there are any defects of integrins in the pathophysiology of senile osteoporosis and the regulatory role of individual integrins in hBMSCs remain unclear. Thus, our study focused on integrin α2, which was down-regulated in senile osteoporotic hBMSCs. We found that integrin α2 promotes the osteogenic differentiation of hBMSCs through the ERK path way.
Methods
Bone marrow processing, cultivation, and osteogenic differentiation of hBMSCs
Bone marrow aspirates were obtained from the posterior iliac crest of 4 normal donors (ND) (69.25±2.87 yr) and 4 osteoporosis patients (OP) (69.5±2.08 yr) following written consent from the participants (ethical approval for this procedure was obtained from the ethics committee of the Fourth Military Medical University, 20110405-5). Detailed information regarding the hBMSC donors is provided in Supplementary Table 1. The patient-derived cells were first separated with Ficoll-Paque PLUS (GE Healthcare, Uppsala, Sweden) and subsequently cultured in DMEM (low glucose) supplemented with 10% FBS at 37°C in 95% humidified air and 5% CO2. Two days after seeding, the nonadherent cells were removed by changing the medium; thereafter, the medium was changed every 3-4 days. At confluence, the cells were detached using 0.25% trypsin in 1 mM tetrasodium EDTA, centrifuged, resuspended in complete medium for re-seeding, and grown in new culture flasks. hBMSCs at population passage 3 were used in the following experiments.
Table 1.
Characteristics of hBMSC donors from iliac crest
| Subject | Age | Sex | T-SCORE |
|---|---|---|---|
| P1 | 67 | M | -2.7 |
| P2 | 72 | M | -3 |
| P3 | 69 | M | -3.2 |
| P4 | 70 | M | -3.2 |
| C1 | 66 | M | -0.9 |
| C2 | 69 | M | -0.5 |
| C3 | 73 | M | -0.3 |
| C4 | 69 | M | -0.5 |
(hBMSC: human bone marrow stromal cell, M: male, F: female).
To induce osteoblast differentiation, the cells were cultured in osteogenic differentiation medium (10% fetal bovine serum (FBS, Hyclone), 100 nM dexamethasone, 45 mM L-ascorbic acid, and 10 mM β-glycerophosphate (Sigma)). The medium was changed every 2-3 days for 3 weeks.
Cell counting assay
To analyze cell proliferation, the cells (1×10⁴/well) were cultured in 6-well plates for 8 days. The cells were enzymatically dissociated and counted using a hemocytometer on days 2, 4, 6, and 8.
MTT assay
For the MTT assay, the cells (1×10³/well) were seeded into 96-well culture plates. Following the manufacturer’s recommended incubation time, cell viability was assessed using 3-(4, 5-dimethylthiazol-2-yl)-2, 5-diphenyl tetrazolium bromide (MTT, Sigma) dye according to the standard protocol. The amount of MTT formazan product was analyzed spectrophotometrically at a wavelength of 490 nm (Bio-Rad). Each individual experiment was repeated at least 3 times.
Colony formation assay
Colony formation assays were performed in 6-well culture plates at a cell seeding density of 1,000. After 14 days, the cells were washed with PBS and fixed with methanol at room temperature for 20 min. The colonies were stained with 0.1% crystal violet (Sigma) and counted. The cultures were fed twice weekly, and colonies of more than 30 cells were scored. All experiments were performed in triplicate.
Alkaline phosphate (ALP) staining and activity assay
ALP staining was performed according to the manufacturer’s instructions using an ALP staining kit (Sigma). The stained cells were photographed using an Olympus digital camera. For the ALP activity assay, cell layers were washed twice with ice-cold PBS, harvested in 1 mL 50 mM Tris–HCl (pH 7.6), sonicated twice on ice, and then centrifuged at 1,000 g for 15 min at 4°C. The supernatant was used to determine the total intracellular protein concentration and ALP activity using p-nitrophenylphosphate as the substrate. The absorbance was read at 405 nm using a microplate reader. ALP activity was expressed as the production of nanomoles of p-nitrophenylphosphate per μg of cell protein per min. Each experiment was repeated 3 times.
Alizarin red staining
To detect mineral deposition, alizarin red staining was performed on hBMSCs. Briefly, the cells were fixed in 4% formaldehyde for 45 min at 4°C. The cells were washed with distilled water, exposed to alizarin red (2% aqueous solution, Sigma) for 10 min at room temperature, and then washed again with distilled water. Finally, the cells were observed and photographed under phase-contrast microscopy.
Quantitative real-time RT-PCR (qRT-PCR)
Total RNA was extracted with TRIzol (Invitrogen, Carlsbad, CA, USA), and cDNAs were synthesized with Superscript II Reverse Transcriptase (Invitrogen) according to the manufacturer’s recommendations. Quantitative RT-PCR (qRT-PCR) was performed using SYBR Premix Ex TaqTM II kit (TaKaRa, Japan). Relative transcript levels were analyzed in a 20 μL reaction volume on 96-well plates using a BIORAD CFX96 real-time PCR system. GAPDH was used as an internal control. Using the relative quantitative method (2ΔΔCT), the expression levels of the PCR products of interest relative to those in the control group were calculated. The primers are listed in Supplementary Table 2. All reactions were conducted in duplicate, and all experiments were repeated at least 3 times.
Table 2.
Primer sets for qRT-PCR
| Gene | Accession numbers | Primer squence (forward/reverse, 5’-3’) |
|---|---|---|
| intergrin β1 | NM_002211.3 | CAG ATC CAA CCA CAG CAG |
| CCA AAT CGT CTT TCA TTG AG | ||
| intergrin β3 | NM_000212.2 | TAG GGT TGT GGA CTT AGC AT |
| GGA GCA AAG TTC AGG TCA C | ||
| intergrin α2 | NM_002203.3 | CTC CCA GAG CCT CTC CTT T |
| TAC GAC GCC ATC TGC TCT C | ||
| intergrin α5 | NM_002205.2 | CAG CAG GAC AGG GTT ACT G |
| GCT CCT GAG TGG CAG ACA G | ||
| intergrin αv | NM_002210.3 | GAT TAT GCC AAG GAT GAT C |
| CGC TCC TGT TTC ATC TCA | ||
| Runx2 | NM_001024630.3 | AAG AAG GAC AGA CAG AAG C |
| AGG TGG CAG TGT CAT CAT C | ||
| osterix | NM_152860.1 | TAG TGG TTT GGG GTT TGT TTT ACC GC |
| AAC CAA CTC ACT CTT ATT CCC TAA GT | ||
| GAPDH | NM_002046.4 | GGA CAC AAT GGA TTG CAA GG |
| TAA CCA CTG CTC CAC TCT GG |
Lentivirus production
The human cDNAs of wild-type integrin α2 were subcloned into the pReceiver-Lv154R lentivirus vector (GeneCopoeia). The recombinant viral vector encoding α2 (Lv-α2) and the packaging plasmids (Lv-ctr) were both extracted using a plasmid extraction kit and were co-transfected into HEK293T cells according the manufacturer’s instructions (Invitrogen). Viral supernatants were collected after 48 h, centrifuged at 1500 × g for 5 min, filtered through a 0.45 μm filter, aliquoted, and stored at -80°C. The viral titer was determined by serial dilution and infection of hBMSCs. hBMSCs isolated from senile osteoporotic patients were infected with Lv-α2 or empty control vector Lv-ctr for 6 h, respectively. Forty-eight hours after infection, the cells were selected with G418 for 10 days, and the resistant clones were pooled and confirmed as integrin α2-positive BMSCs by Western blotting.
Western blot analysis
Cell lysates containing 60 μg of protein were separated by SDS-PAGE electrophoresis and transferred to activate PVDF membranes (Millipore Corp, Bedford, MA). The membranes were blocked for 1 h in defatted milk (5% in Tris-buffered saline with TWEEN-20 (TBST) buffer) and incubated with the following antibodies: anti-integrins α2 (R&D Systems, Minneapolis, MN), anti-Runx2 (Santa Cruz Biotechnology, Santa Cruz, CA), anti-osterix (Santa Cruz), anti-ERK1/2, anti-phospho-ERK1/2, anti-JNK, anti-phospho-JNK, anti-p38, anti-phospho-p38, anti-Akt, and anti-phospho-Akt (Cell Signaling, Danvers, MA, USA). Anti-β-actin (Santa Cruz) was used as a loading control. Next, the blots were incubated in horseradish peroxidase-conjugated secondary antibodies (Santa Cruz). After washing, the blots were developed by using a chemiluminescence detection system (Millipore). The protein bands were analyzed with an image analysis system (Bio-Rad).
Statistical analysis
Statistical analyses were performed with SPSS 16.0 software (SPSS, Chicago, IL). All data are presented as the mean±SD. Univariate analyses were conducted using Student’s t test and the Mann-Whitney U test. Differences between the means of the treatment groups were determined with ANOVA. A value of p<0.05 was considered statistically significant.
Results
Proliferation and osteogenic differentiation of hBMSCs from senile osteoporotic donors is impaired
hBMSCs were isolated from NDs and OPs with an average age of 69.375 years. As shown in Figure 1, hBMSCs from NDs and OPs shared a similar fibroblast-like spindle shape. We also observed that osteoporotic hBMSCs were less confluent than control cells. FACS analyses showed that osteoporotic hBMSCs were positive for CD44 and CD105 and negative for CD34 and CD45, similar to control donor cells.
Figure 1.
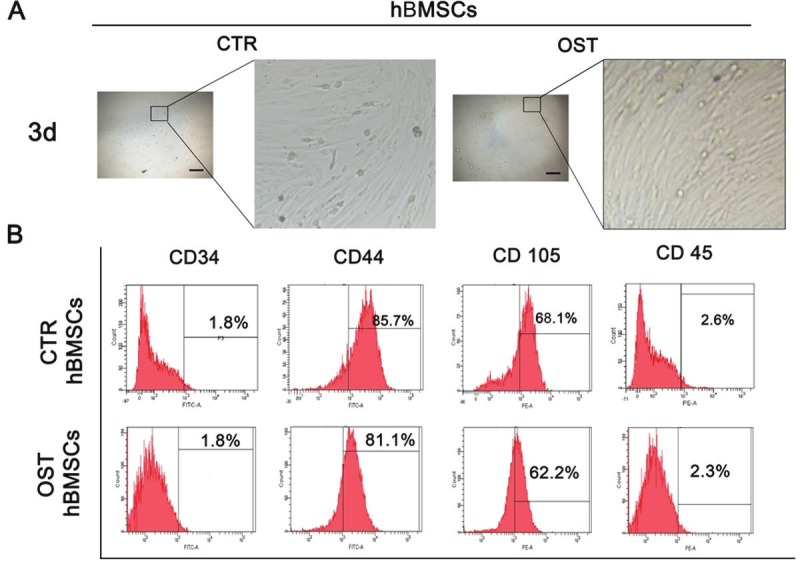
Characterization of BMSCs. A: hBMSCs isolated from normal donors and osteoporotic patients have similar typical fibroblast-like morphology after cultured 3 days in vitro. Left, scar bar, 10 μm, magnification 10×. Right, the enlargement of left frame. B: Surface markers examined by flow cytometry. The BMSCs isolated from two groups showed the similar expression pattern, which are positive for CD44, CD105, and negative for CD34 and CD45.
Furthermore, we evaluated and compared the proliferative and osteogenic differentiation capabilities of hBMSCs isolated from NDs and OPs. Based on MTT analysis and cell counts, the cell growth rate of osteoporotic BMSCs was significantly slower than that of hBMSCs from normal donors, and this prominent difference persisted for 8 days of cell culture (Figure 2A and 2B, p<0.001). The colony formation assay showed similar results (Figure 2C, p<0.01).
Figure 2.
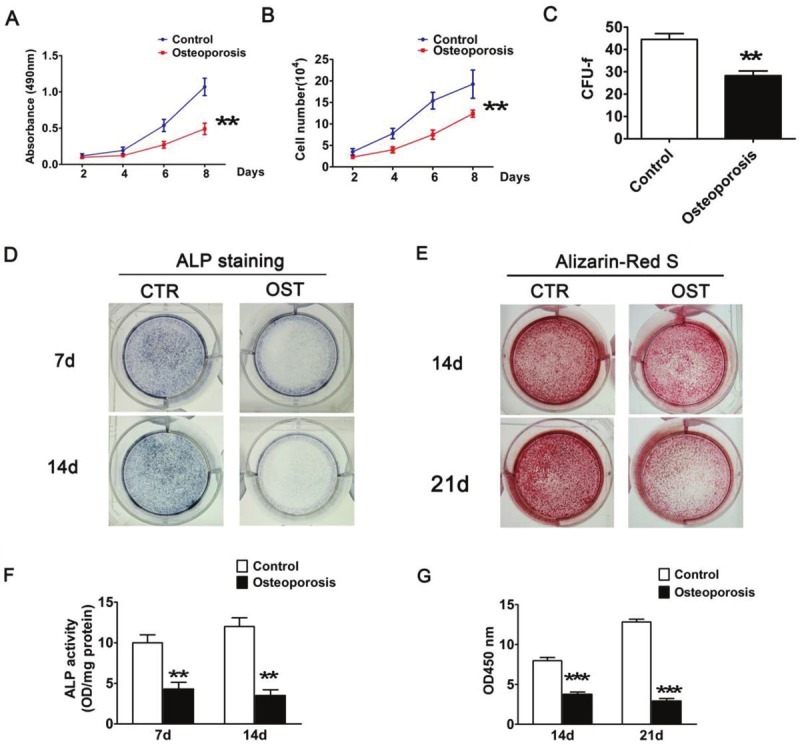
Proliferation and multipotency analyses of hBMSC. A: MTT assay and (B) Cell Counting assay was performed for cell proliferation after 2, 4, 6 and 8 days culture with passages 3-5 cells of respective hBMSC. The results show the cell growth rate of osteoporotic BMSCs was significantly slower than normal donors. C: CFU-f numbers in BMSCs isolated from two groups. After14 days, colonies were stained with crystal violet and counted. D, F: ALP activity assay identified osteoblastic differentiation of hBMSCs. After 7 and 14 days, cells were stained and collected to determine ALP activity. E: Alizarin-Red S staining after osteogenic differentiation for 14 and 21 days in osteogenic medium. G: Quantification of E was performed by optic density (O.D.) measurement at O.D. 450 nm (n=3). Each experiment was performed in triplicate, and results represent the mean±SD of three independent experiments. The asterisks indicate a significant difference (**, p<0.01; ***, p<0.001) between normal donors and osteoporotic patients.
In the osteogenic induction medium, the hBMSCs could undergo osteogenic differentiation and, ultimately, mineralize. We evaluated and compared the osteogenic differentiation ability of hBMSCs from OP and ND groups by ALP activity detection and alizarin red S staining. As shown in Figure 2D and 2E, after 7 and 14 days of subculture, ALP staining and activity assay showed that hBMSCs from NDs displayed a significantly higher ALP level compared to those from OPs. In contrast to the increased ALP activity in normal hBMSCs at day 14, the ALP activity of osteoporotic hBMSCs was somewhat decreased (p<0.01). Similarly, alizarin red S staining showed a defect in the mineralization ability of osteoporotic hBMSCs (Figure 2E and 2G). Taken together, these findings indicate that, under similar culture conditions, the proliferation capacity of hBMSCs isolated from OPs is retarded and that these cells gradually lose the ability to differentiate into the osteogenic lineage during osteoporosis.
Integrin α2 is down-regulated in hBMSCs from senile osteoporotic donors undergoing osteogenic differentiation
To explore the possible contribution of integrins to the inhibited osteogenesis of osteoporotic hBMSCs, we performed qPCR to detect the expression levels of α2, α5, αv, β1, and β3 integrin subunits (Figure 3A). On day 3 of osteogenic differentiation, there was weak or absent expression of the α2 and β1 chains in senile osteoporotic hBMSCs.
Figure 3.
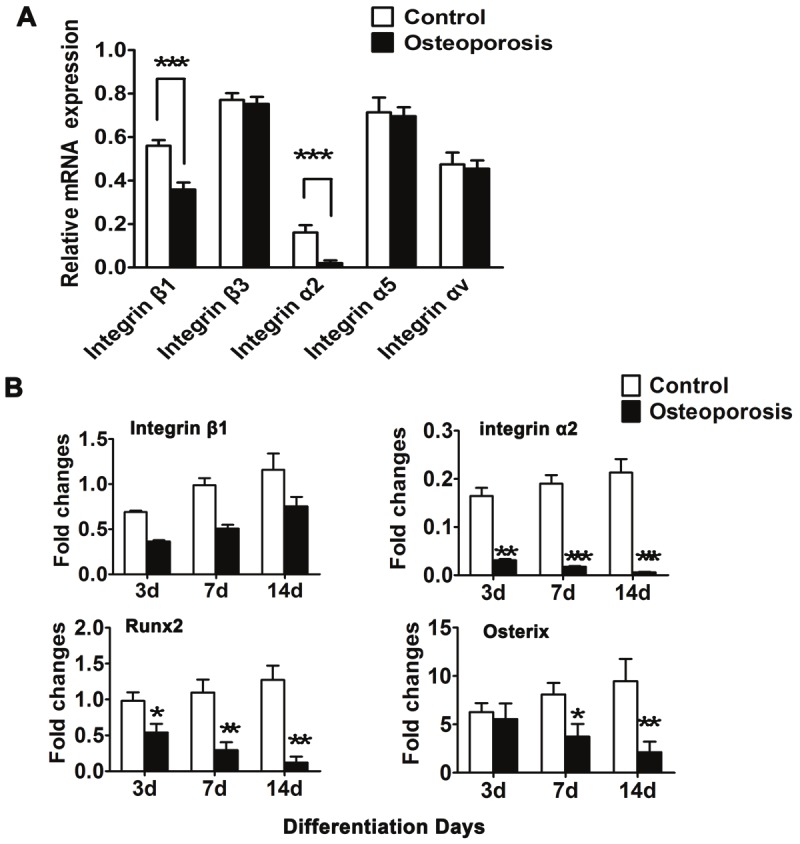
Integrin α2 was down-regulated in osteogenesis of osteoporotic hBMSCs. A: Quantitative RT-PCR for mRNA levels of various integrin subunits. The expression of α2 and β1 was remarkably decreased in osteoporotic hBMSCs. B: The expression pattern of integrin α2, β1 and osteogenic master genes, Runx2 and Osterix is detected in hBMSCs isolated with differentiation from 3 days to 14 days. Results are shown as the relative expression to GAPDH (mean±SD), and significance is determined by Student’s t-test. (*, p<0.05; **, p<0.01 and ***, p<0.001).
Furthermore, we examined the expression level of integrin α2 and β1 and osteogenic markers such as Runt-related transcription factor 2 (Runx2) and Osterix (Osx) in hBMSCs derived from 2 groups cultured in osteogenic differentiation medium. As shown in Figure 3B, along with the differentiation time course, integrin β1 expression increased but varied between these groups. Conversely, the expression level of integrin α2 was significantly reduced in osteoporotic hBMSCs compared with the normal group during osteogenic differentiation, which was consistent with the change in the trend of the osteogenesis-related genes (Runx2 and Osx), suggesting that the down-regulation of integrin α2 might be involved in the functional paralysis of osteoporotic hBMSCs. Thus, integrin α2 might play an important role in the retardative osteogenesis of osteoporotic hBMSCs though mediating the regulation of Runx2 and Osx.
Forced integrin α2 expression promotes cell growth and osteogenic differentiation of hBMSC from senile osteoporotic donors
We used lentiviral vectors to restore integrin α2 expression in osteoporotic hBMSCs. Stable over-expressing integrin α2 clones (LV-α2) were identified by Western blotting (Figure 4A). We also found that the high level of integrin α2 in Lv-α2 hBMSCs was accompanied by increases in Runx2 and Osx expression. Furthermore, we examined the effect of integrin α2 overexpression on cell proliferation. The MTT assay showed that forced integrin α2 expression promotes cell growth (Figure 4B, p<0.01). We also investigated the effect of integrin α2 on the osteogenic differentiation of hBMSCs. Compared to Lv-ctr cells, the ALP activity of Lv-α2-infected cells was shown to be increased by an average of 43.6% (at 3 days), 58.03% (at 7 days), and 60.42% (at 14 days) during osteogenic differentiation (Figure 4C and 4D, p<0.01). Moreover, the evaluation of calcium nodules demonstrated that infection of Lv-α2 enhanced the mineralization of OP-hBMSCs (Figure 4E). Quantitative analysis of alizarin red S staining showed that forced integrin α2 expression significantly promoted osteogenesis by 40.83% (at 14 days) and 54.79% (at 21 days) compared to the control (Figure 4F, p<0.001). These results indicate that integrin α2 promotes the proliferation and osteogenic differentiation of osteoporotic hBMSCs.
Figure 4.
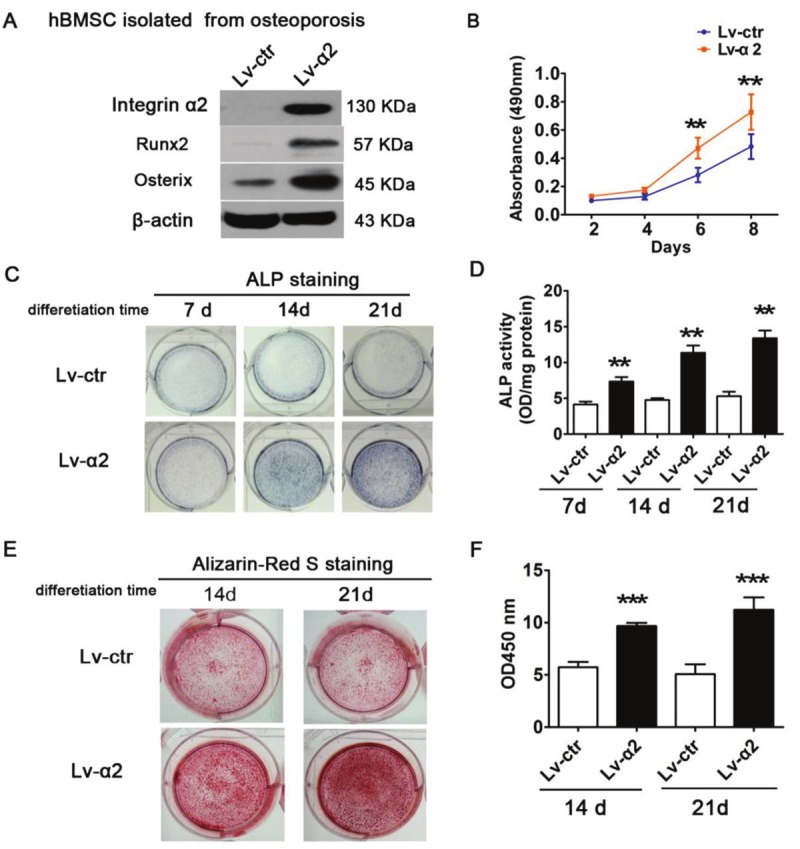
Influence of integrin α2 on cell proliferation and osteoblastic differentiation in osteoporotic hBMSCs. A: Enforced integrin α2 upregulated the expression of Runx2 and osterix. B: MTT assay showed that over-expressing integrin α2 promoted cell growth. C: ALP staining and (D) ALP activity assays in Lv-integrin α2 and control cells after culturing for 7, 14 and 21 days. E: Integrin α2-overexpressing and control cells were induced for mineralization on days 14 and days 21 by Alizarin red staining. F: Quantitative analysis of (E). Each assay was performed in three independent experiments. Data are expressed as mean±SD from all experiments, as indicated **, p<0.01 and ***, p<0.001.
The ERK pathway is required for integrin α2-mediated osteoblastic differentiation of senile osteoporotic hBMSCs
To gain further insight into the potential mechanism underlying the osteogenic differentiation mediated by integrin α2, we examined the phosphorylation status of downstream integrin targets, including ERK, JNK, P38, and Akt, by Western blotting. Upon the stimulation of osteogenic differentiation, compared with the Lv-ctr, the phosphorylation of ERK1/2 of Lv-α2-infected hBMSCs was rapidly activated within 30 min and then decreased to almost undetectable levels after 1 h. In contrast, the phosphorylation levels of JNK, P38, and AKT were not changed. These results suggest that integrin α2 activated ERK1/2 MAPK, thus promoting cell proliferation and survival (Figure 5A). We used PD98059, a MEK inhibitor, to block the activity of phosphorylated ERK1/2 in Lv-α2-infected hBMSCs (Figure 5B). We found that the elevated RUNX2 in Lv-α2-infected hBMSCs was obviously reduced by PD98059 (Figure 5B). Furthermore, ALP activity and alizarin red S staining showed that integrin α2-mediated osteogenic differentiation and mineralization were significantly inhibited by PD98059 during osteogenesis (Figure 5C and 5D).
Figure 5.
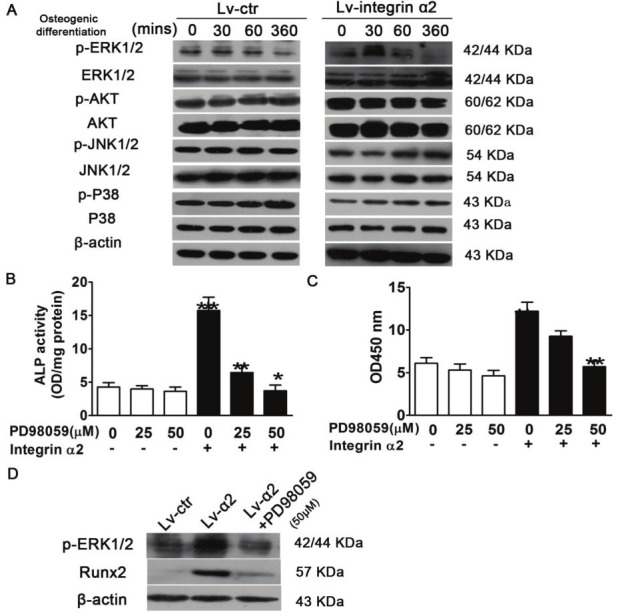
ERK pathway is required for integrin α2 -mediated cell growth and osteoblastic differentiation of osteoporotic hBMSCs. A: Cells were cultured in osteogenic induction medium for the indicated times. Whole cell extracts were prepared, and 60 μg total protein of lysate was subjected to Western blotting using antibody against phosphorylated ERK (p-ERK), p-Akt, p-JNK, p-P38. Cells were incubated with MEK inhibitor PD98059 at the indicated doses, and infected with LV-integrin α2. B: ERK regulated the expression of Runx2.O steoblastic differentiation was determined using an ALP activity assay (C) and mineralization was indicated by Alizarin red staining (D). Each assay was performed in at least three independent experiments. Data are expressed as mean±SD from all experiments, as indicated **, p<0.01 and ***, p<0.001.
Discussion
Various integrins play important roles in osteoblastic differentiation during osteogenesis, including ανβ3, α2β1, and α5β1 [26,27]. Previous studies have revealed that α2 and α11 integrins were upregulated during aging. A significant down-regulation of integrin α2 was detected in hBMSCs derived from osteoporotic patients, and a notable number of cells exhibited mitochondrial leakage, which typically initiates cell death [28]. These studies led us to explore the potential role of integrins on the osteogenic differentiation of hBMSCs from senile osteoporotic subjects. In our current work, we examined the expression of α2, α5, αv, β1, and β3 integrin subunits by real time-PCR. Our results showed that the expression of α2/β1 is significantly decreased in osteoporotic hBMSCs, which supports the findings of previous studies [22]. As osteoporotic hBMSCs exhibited a significant decline in cell proliferation and osteogenic differentiation, the down-regulation of integrin α2/β1 may be associated with alterations of osteoporotic hBMSCs. Moreover, we examined the expression of integrins α2 and β1 and osteogenic markers in hBMSCs derived from normal donors (NDs) and osteoporotic patients (OPs) within osteogenic differentiation medium; the expression of integrin α2 was significantly reduced in osteoporotic hBMSCs compared with the normal group at days 3, 7, and 14 during osteogenesis. This result is consistent with the change in the trends of the osteogenic-related markers (Runx2 and osterix). Our findings suggest that the down-regulation of integrin α2 is involved in the paralysis of osteogenic-related marker expression in osteoporosis.
Therefore, we presumed that integrin α2 might play an important role in the retardative osteogenesis of osteoporotic hBMSCs through the regulation of Runx2 and osterix. To determine the value of integrin α2 upon the regulation of osteogenic differentiation, we used lentiviral vectors to restore integrin α2 expression in osteoporotic hBMSCs and found that the overexpression of integrin α2 reversed the blocked proliferation, osteogenesis-related marker (Runx2 and Osterix) expression, and osteogenic differentiation in osteoporotic hBMSCs (Figure 4). These results confirmed the above-described hypothesis and showed that integrin α2-mediated signaling played an important role in the regulation of osteoblast differentiation and physiopathology of osteoporosis. Moreover, integrin activation leads to the activation of downstream signal transduction events, including the MAPK (extracellular signal-regulated kinase (ERK), c-Jun N-terminal kinase (JNK), and p38), and Akt signaling pathways. These signaling pathways have been shown to favor osteoblastic cell proliferation and differentiation [29-31].
To gain further insight into the potential mechanism underlying integrin α2, we investigated the phosphorylation status of these genes, including ERK, JNK, P38, and Akt. Western blotting assays showed that only p-ERK expression level exhibited a significant change in Lv-α2 hBMSCs, whereas other genes were not affected. Therefore, we studied the cascade effect of integrin α2 cross-talk with the activation of signaling events that responded to the osteogenic differential stimulation after the indicated time. Following exposure to osteogenic differentiation stimulation, we detected that the phosphorylation level of ERK1/2 in Lv-α2 hBMSCs was rapidly activated by integrin α2 within 30 min. The phosphorylation level of ERK1/2 was decreased to an almost undetectable level after 1 h, whereas other genes were not affected, suggesting that integrin α2-activated ERK1/2 MAPK is time dependent (Figure 5A). We further examined whether the ERK pathway was involved in integrin α2-mediated osteogenic differentiation of osteoporotic hBMSCs by down-regulating the activity of ERK using PD98059. RUNX2 expression, ALP activity, and alizarin red S staining assays showed that integrin α2-mediated osteogenesis was inhibited by treatment with PD98059 (MEK inhibitor) (Figure 5B-D). Taken together, these data suggest that integrin α2 regulates Runx2 expression and the osteogenic differentiation of hBMSCs through the ERK1/2 pathway. Therefore, our findings provide evidence that the integrin α2/ERK/Runx2 pathways are involved in cell proliferation and osteogenic differentiation in hBMSCs isolated from senile osteoporotic patients.
In summary, our study demonstrates that hBMSCs derived from senile osteoporosis have a weakened capacity for cell proliferation and osteogenic differentiation due to the down-regulation of integrin α2. Moreover, the overexpression of integrin α2 can reverse the reduced proliferation and osteoblast differentiation capacity of hBMSCs. Furthermore, a mechanistic analysis suggests that integrin α2 activates ERK pathways by phosphorylation, thus promoting the expression of related downstream targets of Runx2 and causing osteoblast proliferation and differentiation. Taken together, our findings suggest that integrin α2/ERK/Runx2 pathways play an important role in senile osteoporosis and may provide a novel molecular target for the prevention and treatment of this disease.
Acknowledgments
This work was supported by Ministry of Science and Technology of CHINA (2011CB964703), China Postdoctoral Science Foundation (20100480093). No benefits in any form have been or will be received from a commercial party directly or indirectly by the authors of this manuscript.
References
- 1.Simonen O, Alhava E. [Who is responsible for prevention, diagnosis and treatment of osteoporosis in Finland] . Duodecim. 1996;112:2173–2176. [PubMed] [Google Scholar]
- 2.Old JL, Calvert M. Vertebral compression fractures in the elderly. Am Fam Physician. 2004;69:111–116. [PubMed] [Google Scholar]
- 3.Raisz LG. Pathogenesis of osteoporosis: concepts, conflicts, and prospects. J Clin Invest. 2005;115:3318–3325. doi: 10.1172/JCI27071. [DOI] [PMC free article] [PubMed] [Google Scholar]
- 4.Mauck KF, Clarke BL. Diagnosis, screening, prevention, and treatment of osteoporosis. Mayo Clin Proc. 2006;81:662–672. doi: 10.4065/81.5.662. [DOI] [PubMed] [Google Scholar]
- 5.Boyle WJ, Simonet WS, Lacey DL. Osteoclast differentiation and activation. Nature. 2003;423:337–342. doi: 10.1038/nature01658. [DOI] [PubMed] [Google Scholar]
- 6.Karsenty G. The complexities of skeletal biology. Nature. 2003;423:316–318. doi: 10.1038/nature01654. [DOI] [PubMed] [Google Scholar]
- 7.Raisz LG. Local and systemic factors in the pathogenesis of osteoporosis. N Engl J Med. 1988;318:818–828. doi: 10.1056/NEJM198803313181305. [DOI] [PubMed] [Google Scholar]
- 8.Seeman E, Young N, Szmukler G, Tsalamandris C, Hopper JL. Risk factors for osteoporosis. Osteoporos Int. 1993;3(Suppl 1):40–43. doi: 10.1007/BF01621860. [DOI] [PubMed] [Google Scholar]
- 9.Hollinger JO, Winn S, Bonadio J. Options for tissue engineering to address challenges of the aging skeleton. Tissue Eng. 2000;6:341–350. doi: 10.1089/107632700418065. [DOI] [PubMed] [Google Scholar]
- 10.Llorens R. A review of osteoporosis: diagnosis and treatment. Mo Med. 2006;103:612–615. quiz 615-616. [PubMed] [Google Scholar]
- 11.Sweet MG, Sweet JM, Jeremiah MP, Galazka SS. Diagnosis and treatment of osteoporosis. Am Fam Physician. 2009;79:193–200. [PubMed] [Google Scholar]
- 12.Caplan L, Saag KG. Glucocorticoids and the risk of osteoporosis. Expert Opin Drug Saf. 2009;8:33–47. doi: 10.1517/14740330802648194. [DOI] [PubMed] [Google Scholar]
- 13.McNamara LM. Perspective on post-menopausal osteoporosis: establishing an interdisciplinary understanding of the sequence of events from the molecular level to whole bone fractures. J R Soc Interface. 2010;7:353–372. doi: 10.1098/rsif.2009.0282. [DOI] [PMC free article] [PubMed] [Google Scholar]
- 14.den Uyl D, Bultink IE, Lems WF. Advances in glucocorticoid-induced osteoporosis. Curr Rheumatol Rep. 2011;13:233–240. doi: 10.1007/s11926-011-0173-y. [DOI] [PMC free article] [PubMed] [Google Scholar]
- 15.Parfitt AM. Bone Forming Cells in Clinical Conditions. London: B. K. Hall; 1991. [Google Scholar]
- 16.Clover J, Dodds RA, Gowen M. Integrin subunit expression by human osteoblasts and osteoclasts in situ and in culture. J Cell Sci. 1992;103:267–271. doi: 10.1242/jcs.103.1.267. [DOI] [PubMed] [Google Scholar]
- 17.Clark EA, Brugge JS. Integrins and signal transduction pathways: the road taken. Science. 1995;268:233–239. doi: 10.1126/science.7716514. [DOI] [PubMed] [Google Scholar]
- 18.Lutolf MP, Gilbert PM, Blau HM. Designing materials to direct stem-cell fate. Nature. 2009;462:433–441. doi: 10.1038/nature08602. [DOI] [PMC free article] [PubMed] [Google Scholar]
- 19.Grzesik WJ, Robey PG. Bone matrix RGD glycoproteins: immunolocalization and interaction with human primary osteoblastic bone cells in vitro. J Bone Miner Res. 1994;9:487–496. doi: 10.1002/jbmr.5650090408. [DOI] [PubMed] [Google Scholar]
- 20.Damsky CH. Extracellular matrix-integrin interactions in osteoblast function and tissue remodeling. Bone. 1999;25:95–96. doi: 10.1016/s8756-3282(99)00106-4. [DOI] [PubMed] [Google Scholar]
- 21.Franceschi RT. The developmental control of osteoblast-specific gene expression: role of specific transcription factors and the extracellular matrix environment. Crit Rev Oral Biol Med. 1999;10:40–57. doi: 10.1177/10454411990100010201. [DOI] [PubMed] [Google Scholar]
- 22.Schneider GB, Zaharias R, Stanford C. Osteoblast integrin adhesion and signaling regulate mineralization. J Dent Res. 2001;80:1540–1544. doi: 10.1177/00220345010800061201. [DOI] [PubMed] [Google Scholar]
- 23.Salasznyk RM, Williams WA, Boskey A, Batorsky A, Plopper GE. Adhesion to Vitronectin and Collagen I Promotes Osteogenic Differentiation of Human Mesenchymal Stem Cells. J Biomed Biotechnol. 2004;2004:24–34. doi: 10.1155/S1110724304306017. [DOI] [PMC free article] [PubMed] [Google Scholar]
- 24.Kundu AK, Putnam AJ. Vitronectin and collagen I differentially regulate osteogenesis in mesenchymal stem cells. Biochem Biophys Res Commun. 2006;347:347–357. doi: 10.1016/j.bbrc.2006.06.110. [DOI] [PubMed] [Google Scholar]
- 25.Klees RF, Salasznyk RM, Vandenberg S, Bennett K, Plopper GE. Laminin-5 activates extracellular matrix production and osteogenic gene focusing in human mesenchymal stem cells. Matrix Biol. 2007;26:106–114. doi: 10.1016/j.matbio.2006.10.001. [DOI] [PMC free article] [PubMed] [Google Scholar]
- 26.Hughes DE, Salter DM, Dedhar S, Simpson R. Integrin expression in human bone. J Bone Miner Res. 1993;8:527–533. doi: 10.1002/jbmr.5650080503. [DOI] [PubMed] [Google Scholar]
- 27.Moursi AM, Globus RK, Damsky CH. Interactions between integrin receptors and fibronectin are required for calvarial osteoblast differentiation in vitro. J Cell Sci. 1997;110:2187–2196. doi: 10.1242/jcs.110.18.2187. [DOI] [PubMed] [Google Scholar]
- 28.Popov C, Radic T, Haasters F, Prall WC, Aszodi A, Gullberg D, Schieker M, Docheva D. Integrins alpha2beta1 and alpha11beta1 regulate the survival of mesenchymal stem cells on collagen I. Cell Death Dis. 2011;2:e186. doi: 10.1038/cddis.2011.71. [DOI] [PMC free article] [PubMed] [Google Scholar]
- 29.Sowa H, Kaji H, Yamaguchi T, Sugimoto T, Chihara K. Activations of ERK1/2 and JNK by transforming growth factor beta negatively regulate Smad3-induced alkaline phosphatase activity and mineralization in mouse osteoblastic cells. J Biol Chem. 2002;277:36024–36031. doi: 10.1074/jbc.M206030200. [DOI] [PubMed] [Google Scholar]
- 30.Hu Y, Chan E, Wang SX, Li B. Activation of p38 mitogen-activated protein kinase is required for osteoblast differentiation. Endocrinology. 2003;144:2068–2074. doi: 10.1210/en.2002-220863. [DOI] [PubMed] [Google Scholar]
- 31.Katz S, Boland R, Santillan G. Modulation of ERK 1/2 and p38 MAPK signaling pathways by ATP in osteoblasts: involvement of mechanical stress-activated calcium influx, PKC and Src activation. Int J Biochem Cell Biol. 2006;38:2082–2091. doi: 10.1016/j.biocel.2006.05.018. [DOI] [PubMed] [Google Scholar]


