

Abstract
Short insertions and deletions (indels) are the second most abundant form of human genetic variation, but our understanding of their origins and functional effects lags behind that of other types of variants. Using population-scale sequencing, we have identified a high-quality set of 1.6 million indels from 179 individuals representing three diverse human populations. We show that rates of indel mutagenesis are highly heterogeneous, with 43%–48% of indels occurring in 4.03% of the genome, whereas in the remaining 96% their prevalence is 16 times lower than SNPs. Polymerase slippage can explain upwards of three-fourths of all indels, with the remainder being mostly simple deletions in complex sequence. However, insertions do occur and are significantly associated with pseudo-palindromic sequence features compatible with the fork stalling and template switching (FoSTeS) mechanism more commonly associated with large structural variations. We introduce a quantitative model of polymerase slippage, which enables us to identify indel-hypermutagenic protein-coding genes, some of which are associated with recurrent mutations leading to disease. Accounting for mutational rate heterogeneity due to sequence context, we find that indels across functional sequence are generally subject to stronger purifying selection than SNPs. We find that indel length modulates selection strength, and that indels affecting multiple functionally constrained nucleotides undergo stronger purifying selection. We further find that indels are enriched in associations with gene expression and find evidence for a contribution of nonsense-mediated decay. Finally, we show that indels can be integrated in existing genome-wide association studies (GWAS); although we do not find direct evidence that potentially causal protein-coding indels are enriched with associations to known disease-associated SNPs, our findings suggest that the causal variant underlying some of these associations may be indels.
Short insertion and deletion polymorphisms (indels, here defined as a gain or loss of up to 50 nucleotides at a single locus) are increasingly being recognized for their abundant contribution to genetic variation in humans (Bhangale et al. 2005) as well as their influence on multiple human phenotypes, for instance as recurrent mutations in diseases related to tandem repeat expansion (Usdin 2008) and Mendelian disorders caused by loss-of-function mutations (MacArthur and Tyler-Smith 2010). Although indels are overrepresented in disease databases (Stenson et al. 2009; Supplemental Information, section 1) compared to single nucleotide polymorphisms and larger structural variants, their origins and functional effects are poorly understood at a population level. This is largely due to the difficulty in discovery and genotyping of these variants by methods other than sequencing, which allow indel sites to be directly observed when contained within sequencing reads.
The recent availability of affordable, high-throughput sequencing has made possible new catalogs of indels in individual genomes (Levy et al. 2007; Wheeler et al. 2008). However, due to differences in sequencing technology and indel calling methodology, vastly different numbers of indels have been reported (Mullaney et al. 2010; Mills et al. 2011). Such differences have made difficult the assessment of the genetic variability engendered by indels, and the lack of population-level data has hampered the study of the processes of indel mutation and fixation. Here, we report on a comprehensive analysis of a high-quality set of indels discovered in 179 individuals from three population groups (59 Yoruba individuals from Ibadan, Nigeria [YRI], 60 individuals of Northern and Western European origin from Utah [CEU], and 30 Chinese individuals from Beijing and 30 Japanese individuals from Tokyo, which were analyzed jointly [CHB/JPT]), using data and analysis pipelines developed as part of the 1000 Genomes Pilot Project (TGPP) (The 1000 Genomes Project Consortium 2010). This data set provides an opportunity to study indel variation with unprecedented resolution.
Calling indels from short read data is challenging for several reasons. First, correctly placing sequence reads on the reference genome (“mapping”) is more difficult when reads overlap indels, than when they only include base errors and SNPs. Second, even when reads are placed correctly, the nucleotide-level alignment is often incorrect, because of local repetitive structures, partial overlap, or insufficient high-quality sequence flanking the indel. Third, while Illumina short sequence reads have a low overall indel error rate, they exhibit systematic indel errors, particularly at homopolymer runs (Albers et al. 2011) .
We addressed these issues by following the approach used in the TGPP (The 1000 Genomes Project Consortium 2010), updated to optimize the sensitivity and specificity for short indel discovery. Specifically, we selected a read mapper with high sensitivity and a reduced reference bias as we have previously reported (Lunter and Goodson 2011), and constructed a set of candidate indels by selecting those observed more than once in the raw mapped reads (Supplemental Information, section 2). From these candidates we built the implied haplotypes, and used a Bayesian method that includes an indel error model for homopolymers to calculate posterior probabilities by realigning the reads to each haplotype. This approach accounts both for indel errors and alignment artifacts produced during read mapping (Albers et al. 2011). In addition, we followed the TGPP pipeline by removing indels in long (>10 bp) homopolymeric stretches, as high indel error rates lead to a reduction in power to call indels in these contexts. In contrast to the TGPP pipeline we did not filter for indels in tandem repeat contexts, because of our specific interest in these types of indels. Finally, we validated a subset of calls to estimate the false discovery rate in the resulting call set.
Results
Indel discovery and genotyping
After mapping all reads with Stampy (Lunter and Goodson 2011) and constructing a candidate set of indels as described above, we called sites and computed genotype likelihoods for each population separately using Dindel (Albers et al. 2011). Dindel also reports sites where evidence for multiple alleles was present; in these cases the majority allele was called and others discarded, because of the limitations in the subsequent genotyping pipeline. This procedure resulted in 1.6 million indels across the three populations selected for initial sequencing in the TGPP, translating to an overall indel diversity of about eightfold lower than for SNPs (Table 1). Most indel calls were made in the YRI panel (72.7%), followed by the CEU and CHB/JPT panels (55.0% and 47.4%), as expected from the larger genetic diversity of the YRI panel; these fractions add up to >100% because of variants shared between the populations.
Table 1.
Summary of indel calls

The low average coverage per individual (∼4×) does not allow accurate genotype calls to be made directly. Instead, we exploited patterns of linkage disequilibrium between SNPs and indels to impute missing information, analogous to the procedure used in the TGPP, using IMPUTE version 2 (IMPUTE2) (Howie et al. 2009) which allows using TGPP SNP sites as a haplotype scaffold upon which the indel sites are phased; the genotypes at indel sites can then be obtained from the phased haplotypes. Specifically, IMPUTE2 iteratively estimates the underlying indel haplotypes of samples. For each iteration, new estimates of an individual's haplotypes are sampled conditional upon the individual's genotypes and the current haplotype estimates of all other individuals, using the Dindel genotype likelihoods at indel sites; this process was continued until convergence.
Estimation of false discovery rate
Since our call set has significant overlap with the TGPP call set, we designed a validation experiment that made use of the information obtained for the TGPP call set, in order to efficiently obtain an accurate estimate of the false discovery rate (FDR) of the present indel call set. Specifically, we selected calls that are unique to our set (defined as not seen in the TGPP or in dbSNP129), in such a way that selected indels were predicted to segregate in two specific individuals. We then assessed calls that passed the design primer stage by Sanger sequencing, and combined the results with the FDR from the TGPP sets to arrive at an FDR estimate for the full set.
Because the CEU calls were found to be representative of the other sets in the TGPP (The 1000 Genomes Project Consortium 2010), we chose two CEU individuals (NA11918 and NA10851) as our validation targets, and subsampled the calls predicted to segregate in these individuals to recover the empirical allele frequency distribution of the full CEU indel call set. We next attempted primer design for a randomly selected subset of these calls. From those for which primer design was successful (111), we assessed 60 calls using Sanger sequencing of the forward and reverse strands, in the one or two individuals (NA11918 or NA10851) in which the indel was predicted to segregate.
In all, 36 sites resulted in Sanger reads that supported the call; 12 sites supported only the reference, or supported a different call; and 12 sites could not be called because of low-quality or difficult-to-interpret Sanger data. We therefore estimate the FDR for the novel calls at 0.25. Combined with the FDR estimated for the TGPP, we estimate the present CEU calls to have an FDR of 4.6% (for details, sequence traces, and calls, see Supplemental Information and Supplemental Data). This figure is approximate for two reasons. First, the estimate assumes that the intersection of the original TGPP calls with the present call set has the same FDR as the original TGPP set, despite being supported by two partly independent calling pipelines. Second, because only two individuals from the CEU panel were assessed, the FDR estimate will be inflated by even modest levels of genotyping error, which we expect to be comparable to the rate of genotype errors for TGPP SNPs of 1%–3% (The 1000 Genomes Project Consortium 2010). For these reasons the true FDR is likely to be <4.6%. We note that this FDR is similar to the FDR for SNPs called from the same data in the TGPP (3.3%, 4.0%, and 4.3% for CEU, YRI, and JPT/CHB, respectively) (The 1000 Genomes Project Consortium 2010).
In contrast to the TGPP pipeline, our calling pipeline does not include a filter for indels in long tandem repeats. This increases the power to call such indels but also potentially increases the false discovery rate for indels in this category. We however do not find evidence for any enrichment of false positives within tandem repeats (P = 0.60, χ2 test) (for a detailed discussion, see Supplemental Information, section 4.2).
We expect the FDR in the other populations to be comparable but not identical to the estimate for the CEU subset. For example, the TGPP estimates an FDR of 0.7% for the YRI panel, 1.3% for the CEU panel, and 5.1% for the JPB + CHB panel, and since we use the same set of short sequence data, we expect a similar trend in our call set.
Estimation of power
A considerable fraction of calls (21.8%) are novel to a recent catalog of variant sites (dbSNP 135), which includes all of the TGPP indel calls. Novel calls are distributed roughly evenly among the indel classes considered in this paper (see below), with a somewhat stronger enrichment for indels in tandem repeats (Supplemental Information, section 2; Supplemental Table S9). Since we found no evidence for an enrichment of false positives with indels in tandem repeats, this indicates that our pipeline has a generally higher sensitivity compared to the TGPP indel calling pipeline (particularly for indels in tandem repeats) as expected from the improved mapping and modified filtering stages.
To assess our power to detect indels more formally, we used variants identified in high-quality fosmid data of a single individual of European ancestry (NA12878 from CEU) (Kidd et al. 2010). Although this individual was not part of the low coverage CEU panel, a substantial fraction of the polymorphisms found in her genome will be shared with individuals in the panel. Among the 16.6 Mb of fosmid sequence we find 833 indels, of which however only a fraction is potentially callable from the available short-read data. We considered indels not callable if they had alleles exceeding 50 bp (18 indels), were found in long homopolymers (>10 bp, 348 indels), or were found in tandem repeats with high predicted site-polymorphism rates (>30% of sites polymorphic; 135 indels), a high fraction of which we expect to be multiallelic sites. Because of the short read length (mostly 36–75 bp), high error rates in long homopolymers, and because multiple alleles are not considered by the current algorithms, we have limited or no power to detect such indels (for details, see Supplemental Information, section 4.3).
Of the remaining 344 potentially callable indels, 255 (74.1%) were present in the call set with matching position and allele. A virtually identical fraction of fosmid SNPs was called by the TGPP low-coverage SNP calling pipeline from the same data (2365/3196, 74.0%). This indicates that the power to detect SNPs from short-read data, which was estimated at ∼90% for alleles present five times in the population panel (The 1000 Genomes Project Consortium 2010), is similar to the power to detect indels considered callable by the criteria above.
Indel classes
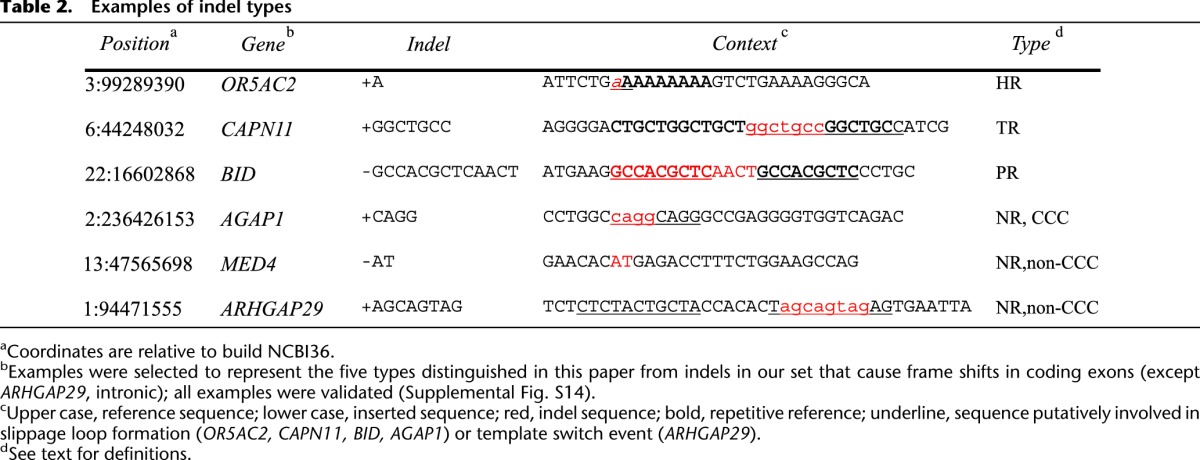
To help stratify indels by mutation rate and mechanism, we classify them into five categories by the sequence context in which they are found. To aid the exposition, we define these categories here; for examples, see Table 2. Sites classified as homopolymer run (HR) are those with runs of six or more identical nucleotides. Tandem repeats (TR) are characterized by both their repeat unit length and their tract length, which need not be a multiple of the repeat unit. The minimum tract length, which depends on the repeat unit length, was chosen to correspond to similar per-site mutation rates as a 6-nt HR site (for details, see Supplemental Information, section 5, and Supplemental Table S1). Predicted hotspots (PR) are sites of near-repetitive genome sequence, not annotated as HR or TR, where predicted local indel rates are predicted to exceed the SNP rate as determined by a mathematical model of the local indel mutation rate described below. Finally, nonrepetitive sites (NR) are those not classified as HR, TR, or PR. Indels at such sites are further characterized by whether they result in a local change in copy count (CCC). Specifically, NR-CCC indels are those where a long allele can be obtained from the short allele by a local duplication, and NR non-CCC indels are any other type of complex indel in a nonrepetitive sequence context.
Table 2.
Examples of indel types
Variation in indel mutation rates across the genome
We find that indel mutation rates are highly heterogeneous across the genome. This is evident from the clustering of indels within HR, TR, and PR sites (hotspots), which account for 43%–48% of called indels despite occupying only 4.03% of the genome sequence (Fig. 1A). In contrast, at the remaining nonrepetitive sites (NR; 95.97% of the genome) indels are relatively rare, with an incidence 16-fold to 19-fold below that of SNPs (Table 3).
Figure 1.
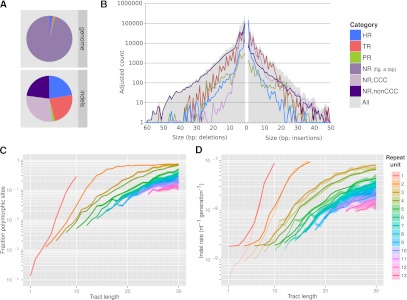
Indels in repetitive sequence contexts. (A) Relative abundance of genomic context classified as repetitive (HR, TR, and PR; see text for definitions) and nonrepetitive (NR) across the genome (top) and among indel sites (bottom). Nonrepetitive indel sites were further divided into copy-number-changing (CCC) and non-CCC indels. (B) Histogram of insertion (right) and deletion (left) counts by variant length (solid gray), and separately by genomic context (superimposed lines). Counts were adjusted within each context category to account for the fraction of polarizable calls. (C,D) Fraction of polymorphic repeat tracts (C) and relative per-nucleotide indel rates (thin lines) and model fit (D), by length of tandem repeat unit (color) and tract length (horizontal axis). Shading indicates ±2 standard errors of the mean observed polymorphic fraction or indel rate.
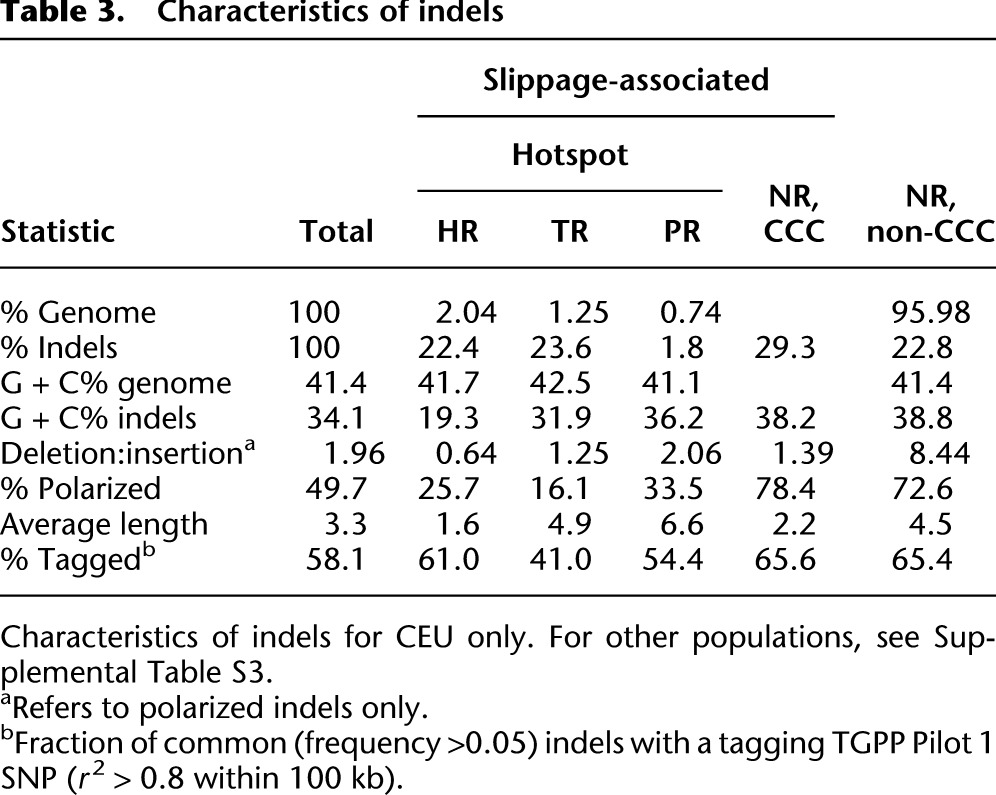
Table 3.
Characteristics of indels
HR sites in particular are highly indel-mutagenic, resulting in a more than 10-fold enrichment of indels at such sites compared to the genomic average (fraction of nucleotides annotated as HR polymorphic in CEU, 3.4 × 10⁻³ indels/nt vs. 0.31 × 10⁻³ indels/nt genome-wide). Since we called no indels in HRs >10 bp because of the increased platform error rate and associated loss of detection power (The 1000 Genomes Project Consortium 2010; Albers et al. 2011), we expect the true enrichment to be higher; this is further supported by the high numbers of indels found at long HRs in fosmid-derived sequences. Similarly, TR sites, occupying 1.25% of the reference genome and accounting for 23.6% of CEU calls (Fig. 1A; Table 3), are almost 20-fold enriched with indels (5.8 × 10⁻³ indels/nt).
The dichotomy between nonrepetitive (NR) and hotspot (HR, TR, PR) sites that we use in this paper is one of convenience; and in fact, we find that polymorphism rates at HR and TR sites vary monotonically across three orders of magnitude depending on the repeat tract length and the size of the repeat unit. For instance, >10% of HR tracts >8-bp long show evidence of indel polymorphism in CEU compared to 0.1% for tract length 4, a more than 100-fold increase in polymorphism rate for a 4-nt increase in tract length. Trinucleotide repeats attain a 10% polymorphism rate for tracts >15 bp. Generally, most of the indel rate variation at TR sites is explained by repeat tract length; whereas at a given tract length, TRs consisting of longer repeat units tend to be somewhat more stable (Fig. 1C).
These results are unlikely to be driven by false positives, given the low estimated FDR and the lack of enrichment for TR indels among false positives. Nevertheless, we analyzed indels observed between the human and chimpanzee reference sequences derived from capillary sequencing of BACs and indeed find similar enrichments in HR and TR sites (Supplemental Fig. S1; Supplemental Information, section 6). This indicates that mutation rate heterogeneity rather than Illumina-specific sequencing errors are driving these observations.
Most indels are caused by polymerase slippage
Polymerase slippage is a well-understood mechanism of indel mutagenesis (Streisinger et al. 1966; Levinson and Gutman 1987; Taylor et al. 2004), resulting mostly in local tandem duplications or –deletions, representing a local change in copy count (CCC indels). Previous analyses of processed pseudogenes (Nishizawa and Nishizawa 2005) and disease-associated coding indels (Zhu et al. 2000) indicated that many small indels are of this type, but data allowing a uniformly ascertained genome-wide analysis were hitherto not available. Here, we find that over three-fourths of indels are of CCC type and thus can be explained by polymerase slippage events. In particular, most HR and TR indels are of CCC type, including for instance 95% of indels in dinucleotide-unit TR sites. This remains true outside of hotspots, where although much less common, CCC indels still comprise 56% of indel variants.
Polymerase slippage explains variation of indel mutation rates
Polymerase slippage is also driving the rate heterogeneity in repetitive sequence. To show this, we developed a quantitative model to predict the observed indel polymorphism rates per site (Fig. 1C), or equivalently, the enrichment of indel variants per nucleotide (Fig. 1D) in repetitive sequence compared to complex sequence. Polymerase slippage is already strongly induced in duplexes of 6 mers and longer repeat units (Fig. 1C), suggesting that nontandem repeats (e.g., Table 2, third example) may also induce slippage, a prediction of Streisinger's model (Streisinger et al. 1966). Based on this observation, we developed a probabilistic version of Streisinger's model that attempts to capture the dependence of indel rates on local sequence similarity.
Mathematically, we model slippage as the formation of a loop of d ≠ 0 nucleotides occurring at a rate r(d), followed by reannealing along k > 0 nucleotides with probability m(k). This configuration is considered stable if the sequences match along the k nucleotides, resulting in an insertion (d > 0) or deletion (d < 0); otherwise, no mutation occurs. The total indel rate is calculated as
where the sum extends over all pairs (d,k) for which k contiguous nucleotides match (from the focal site in either direction) over a displacement d. We estimated the parameters [r(d), m(k), λ0] for 0 < k < 20, 0 < |d| < 20 using Markov chain Monte Carlo from the observed indel enrichment in homopolymeric and tandem repetitive regions, where we made the assumption that r(d) = r(-d), since our observations consist mostly of unpolarized indels. The resulting model shows an excellent fit to the data (Fig. 1D; Supplemental Table S2; Supplemental Information, section 8) (reduced χ2 goodness-of-fit statistic 1.07, degrees of freedom 330, P = 0.18). The model parameters indicate that slippage initiation most frequently involves a template displacement over distances of 1–4 bp, although larger displacements do occur but at a lower frequency, which is largely independent of the displacement in the range we examined (<20 bp). The stability of the resulting configuration increases exponentially with the reannealed tract length, plateauing with strong stability for sequence identity of around six or more base pairs (Supplemental Table S2). These inferences are consistent with the direct observations that the majority (82%) of bases classified as TR tracts consist of 1–4-bp repeat units, and that indels are strongly enriched in HRs of length 6 or more (Fig. 1A). Using this model we can associate indel rates not only with TR and HR sites but with any nucleotide in the genome, and we used this to identify a further 0.74% of near-repetitive genome sequence, not annotated as HR and TR, for which indel rates are predicted to exceed the SNP rate (PR) (Supplemental Fig. S6).
The FoSTeS and MMBIR mechanisms and palindromic sequence features
After accounting for polymerase slippage, about one-fourth of all indels remain. These consist mainly of NR non-CCC indels, the large majority of which are deletions (ratio of deletions to insertions, rDI = 8.4–10.4) (Fig 1B; Table 3; Supplemental Table S3). One plausible mechanism generating such deletions is the formation of a double-stranded break intermediate, followed by imperfect repair (Chu 1997; McVey et al. 2004).
A mechanism for the remaining ∼2.5% of mutations, classified as NR non-CCC insertions, is less obvious. For one, it is unclear how to explain the provenance of the inserted sequence. Here, we find that such insertions significantly more often involve a palindromic repeat than do deletions in the same class (P < 2.2 × 10⁻¹⁶) (Supplemental Tables S7–S8; Supplemental Information, section 9). These features are compatible with two related recently proposed mechanisms for complex genomic rearrangements, fork stalling and template switching (FoSTeS) and microhomology-mediated break-induced replication (MMBIR) (Lee et al. 2007; Hastings et al. 2009). By repeated template switching and reannealing to physically proximal but sequentially distal sites until the original strand (and direction) of replication is eventually recovered, the FoSTeS/MMBIR mechanism can generate large and highly complex rearrangements. However, the same model also provides a pathway for generating small insertions through a single template switch event (and the replication of part of that template) followed immediately by the recovery of the original strand. Our data indicates that at least 15% of human NR non-CCC insertions resulted in pseudo-palindromic features compatible with this mechanism (for details, see Supplemental Information, section 10). Since such features are only expected if the donating template is in reverse orientation and sequentially proximal to the insertion site, the FoSTeS/MMBIR mechanism may be responsible for a much larger fraction of NR non-CCC insertions.
Conversely, palindromic repeats can also induce template switching through hairpin loop formation (Hastings et al. 2009), causing either insertions or deletions (Greenblatt et al. 1996); and indeed we find that palindromic repeats occur more often at sites hit by NR non-CCC insertions as well as deletions than they do in the genomic NR background (P < 2.2 × 10⁻¹⁶). A distributional analysis suggests that palindromic repeats of length 6 and above, compatible with the length of microhomology observed in FoSTeS/MMBIR (Zhang et al. 2009), explain 5.3% of NR non-CCC indels, or ∼1.3% of all indels (for details, see Supplemental Fig. S15, and Supplemental Information, section 10). Anecdotal evidence suggests that near-palindromic repeats can also cause simple indels as well as single-nucleotide variants (Greenblatt et al. 1996; Viswanathan et al. 2000), suggesting that this fraction likely underestimates the importance of this mechanism for small-scale mutagenesis in humans.
Enrichment for SNPs but not indels in recombination hotspots
We also considered recombination as a possible mechanism for indel mutagenesis because in particular crossover necessarily introduces breaks in both strands. In agreement with several previous studies (see Ellegren 2004 and references therein), we find no enrichment of indels in recombination hotspots (Fig. 2, right). Interestingly, we do find a small but highly significant enrichment of SNPs in the immediate vicinity of motifs known to be associated with recombination in the CEU population (7.9%, p = 7.7 × 10⁻⁷) (Fig. 2, left; Supplemental Figs. S3–S4; Supplemental Information, section 7; Myers et al. 2008). This enrichment may be caused by a small direct mutagenic effect of recombination. Alternatively, it may be caused by the action of GC-biased gene conversion, which is associated with recombination and causes more low-frequency SNVs close to hotspots to reach appreciable frequency in the population. Conversely, the lack of any comparable signal for indels implies that neither can recombination have a strong indel-mutagenic effect nor does there appear to be any noticeable effect of indel-biased gene conversion in these hotspots.
Figure 2.
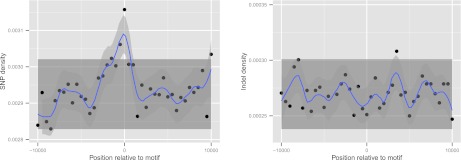
Enrichment for SNPs but not indels in recombination hotspots. Density of SNPs (left) and indels (right) in the CEU cohort in 500-bp bins across 20 kb centered around the motif CCTCCCTNNCCAC, associated with recombination hotspots. The shaded rectangle denotes two SEM and was obtained from observations excluding the central three bins; the blue curve and 95% confidence band was obtained by loess smoothing with parameter α = 0.2.
Metastable evolutionary dynamics of variable homopolymers and tandem repeats
The high mutation rate in HR and TR sites raises the question of their evolutionary dynamics and, in particular, whether over time such sites tend to grow or shrink. To answer this we must first distinguish insertions from deletions. We polarized a large fraction (49.7%) of called indels using four nonhuman primate genomes; homoplasies and repeat mutations prevented the remainder to be confidently polarized (Supplemental Information). Among polarized indels, deletions outnumber insertions by about 2:1 (rDI = 1.96 in CEU) (Table 3), an excess driven largely by the strong deletion bias within NR non-CCC indels. We find that rDI depends strongly on the repeat unit and tract length, with deletions dominating for short tracts but insertions dominating for longer tracts (Supplemental Fig. S5A). The same trend is observed in human-chimpanzee indels (Supplemental Fig. S5B), indicating that these observations are unlikely to be driven by false positives.
These data suggest the existence of a metastable equilibrium of HR and TR tracts: although individually behaving stochastically under the influence of indels, on evolutionary time scales, short HR and TR tracts will tend to shorten further, whereas beyond the unstable evolutionary equilibrium point (defined as rDI = 1; ∼6 bp for HRs, 10 bp for dinucleotide TRs) (Supplemental Fig. S5A), such tracts will tend to evolve into microsatellites. For still longer repetitive tracts (above ∼20 bp for HRs) (Supplemental Fig. S5b), deletions again dominate. This downward bias for long alleles, which is also seen in yeast (Wierdl et al. 1997), stops an otherwise exponential increase of long repeat tracts from occurring and predicts a tight equilibrium distribution of genomic microsatellite tract lengths, which is indeed observed (Whittaker et al. 2003). This metastable equilibrium model predicts that any genomic locus exists either as a complex and slowly mutating site or as a highly repetitive and fast mutating site. Under this model, transitions between these states occur rarely and randomly when chance mutations cause the site to cross the equilibrium point rDI = 1, resulting in the birth and death of microsatellites.
Genes under high mutational load
We next investigated the impact of indels on genome function. First, we used the indel mutation rate model to identify protein-coding loci that are under strong mutational load by virtue of their sequence composition (Supplemental Information, section 12). In contrast to previous studies (e.g., Mills et al. 2011) that rely on polymorphism data, which is informative of the combined effect of mutation and selection, this approach allows us to focus on just the mutation process and to potentially identify genes under the combined forces of strong mutation and strong purifying selection. An initial screen identified 43 genes with high individual predicted mutation rates (>2 × 10⁻⁵ predicted indel mutations per gene per generation) (Supplemental Table S4) within their coding regions. To ensure that errors in transcript annotations did not bias our results, we removed 33 genes that also showed evidence of enrichment with SNPs (P < 0.05). The list includes known disease genes, e.g., HTT (Huntington's disease) and AR (associated with increased prostate cancer risk, spinal and bulbar muscular dystrophy, and infertility, among others). The indel hotspots in these two genes are long trinucleotide repeats, and substantial alterations of the tract length as well as less frequent frame-shifting mutations are associated with the disease phenotype (OMIM 143100, 313700). Another predicted hypermutable gene (ARID1B) features AT-rich regions, with four known spontaneous indels associated with neurodevelopmental phenotypes (OMIM 614556). The remaining genes show low-complexity sequence on the amino acid level, such as stretches of glutamine (MED12, MED15, MAML2, MAML3), of other amino acids (DACH1, SKIDA1 [previously known as C10orf140]), or other low-complexity regions such as DSPP, which has previously been reported as harboring multiple indels (Mills et al. 2011) and includes a 2135-bp region encoding inexact Ser-Ser-Asp repeats, mutations that are associated with disorders in tooth development (OMIM 125485).
Signals of selection for indels
To more broadly investigate the impact of indels on function, we looked at signals of selection within various annotation categories. It is well known (MacArthur and Tyler-Smith 2010; Mullaney et al. 2010) that indels occur at a lower relative density in coding sequences compared to every other genic category (Fig. 3A). This is at least partly a mutational effect resulting from the relatively low repetitive content of coding sequence (predicted indel rate threefold below the genome average). Here, we account for this bias by using logistic regression to calculate relative rates of indel mutation controlling for sequence composition, including homopolymer, tandem repetitive (Ellegren 2004), and G + C content (Supplemental Figs. S7–S9; Supplemental Information, section 13; Taylor et al. 2004; Lunter et al. 2006). After accounting for these biases, we observed consistent depletion of indels across genic sequences relative to flanking intergenic regions, with coding sequence (CDS) displaying the strongest depletion of particularly frameshift indels (Fig. 3B). As a result, frame-preserving indels, and in particular indels of 3 bp in length, are the most abundant within CDS (Fig. 3C). Indel rates are also markedly reduced across a broad spectrum of functional noncoding sequences in the human genome (CNCs), and mild but significant reductions are seen in 5′ UTRs and introns.
Figure 3.

Purifying selection against indels in functional regions. (A) Aggregate indel density (the sum of all indels in a set of bins divided by the total length of those bins) in six genic regions (GENCODE version 3b). (B) Relative indel rates by length (negative x-axis, deletions; positive x-axis, insertions) and annotation (color-coded), controlling for background rates influenced by sequence composition. Bars represent log relative excess or depletion compared to the background rate; red dots mark bars that are significant at the 5% level, not corrected for multiple testing. (C) Histogram of coding indel lengths; colors indicate (unpolarized, reference) deletions and insertions. (D) Derived allele frequency (DAF) distribution of deletions by annotation category. (E) Relative excess of low-DAF (<10%) indels and SNPs by annotation class, calculated as (Ni – Nn)/Nn × 100%, where Ni is the fraction of low-DAF variants in element i, and Nn is the fraction of low-DAF variants in ancestral repeats. (F) Fraction of low-DAF (<10%) 3-bp deletions by number of constrained sites deleted (χ2 P < 5 × 10⁻³ in all populations). All error bars (B,D,E,F) represent 1 SEM.
Despite our efforts to correct for the effect of mutation rate heterogeneity, it remains possible that unaccounted-for variations in mutation rates exist that could result in some functional categories showing low relative indel rates due to mutation rather than selection. To address this, we turned to investigate the derived allele frequency (DAF) distribution of human indel alleles since selection will shift the distribution toward rare alleles in selectively constrained regions compared to nonselected regions, whereas differences in mutation rate alone will not (Akashi and Schaeffer 1997). Another process that can skew the DAF distribution is biased gene conversion (BGC), which causes selection-like dynamics through preferential transmission of particular SNP alleles at recombination loci (Duret and Galtier 2009). However, contrary to what has been reported for SNPs (Katzman et al. 2011), we do not find evidence for variation of DAF spectra with recombination rate in a manner consistent with BGC, suggesting that indels are not affected by this process (Supplemental Fig. S10; Supplemental Information, section 14). This is consistent with the observed absence of any enrichment of indels near recombination hotspots (Fig. 2). Thus, any biases in the DAF spectra are expected to mainly reflect selection.
Comparison of DAF spectra of indels in several annotation categories revealed a general excess of low frequency-derived alleles when compared to presumed neutral sequence (ancestral repeats [ARs]) (Fig 3D). This effect is particularly pronounced for indels in CDS (Mann-Whitney test, P = 4.3 × 10⁻¹⁰) and is also significant for indels within conserved noncoding (CNC) regions and 3′ UTRs (P < 2.2 × 10⁻¹⁶ and P = 3.6 × 10⁻¹¹, respectively). These observations indicate strong purifying selection against indels in CDS and against indels in functional noncoding sequences (Supplemental Fig. S12; Supplemental Information, section 15).
Overall, indels show a larger excess of low frequency-derived alleles compared to SNPs in the same annotation category (Fig. 3E), for example in 3′ UTRs and CNC regions, indicating that on average indels have a stronger deleterious effect than SNPs in these annotation categories. As expected, the effect is also pronounced for CDS variants overall, whereas nonsynonymous SNPs show an excess similar to that for in-frame indels, suggesting similar levels of purifying selection on these categories of variants.
Within CNCs, short (1–2 nt) indels appear somewhat less depleted than do longer indels (Fig. 3B). One explanation is that longer indels remove, on average, more evolutionarily constrained and, thus likely, functional nucleotides and may therefore have a larger effect on fitness. To investigate whether this effect is real, we used GERP nucleotide-level annotations of conservation (Davydov et al. 2010) to classify deletions by the number of constrained sites they overlap. We find that the percentage of low frequency (DAF <10%) alleles increases as more constrained sites are deleted (P < 5 × 10⁻³) (Fig. 3F), as do mean and median DAF (Supplemental Fig. S12; Supplemental Information, section 16), indicating that such events are more strongly selected against and implying that longer deletions in CNC regions will tend to have larger fitness effects than small ones.
The impact of indels on gene expression and complex trait association
The existence of strong selective constraint against indel mutations suggests that indels may contribute to human phenotypic variation, and genome-wide association studies (GWAS) and eQTL data provide support for this. Common indels are generally well tagged by SNPs (Supplemental Fig. S13; Supplemental Information, section 18), with 58.1% in strong linkage (r2 > 0.8) with nearby tagging SNPs. This fraction is lower than the comparable figure for sequenced SNPs (76.1% in strong linkage). Nevertheless, these results imply that it is possible to phase indels into SNP haplotype reference panels, allowing indels to be assessed in the vast majority of GWA studies that only use SNPs as markers.
As a first application of indel association by imputation, we analyzed SNP and indel variants present in the CEU cohort in individuals for which gene expression has been collected using RNA-sequencing (Montgomery et al. 2010). We found 17.4% of the top associations with exon-level expression to be indels, more than expected from the genomic ratio of indel and SNP prevalence (∼12.5%) (Table 1). We also assessed the proportion of the variance in expression explained by the best association per indel or SNP. Here, we permuted expression (n = 100) and compared the expected distribution of best associations per exon to the observed distribution for SNPs and indels separately (using an approach analogous to that reported for comparisons of SNP and indel-QTL in mouse) (Keane et al. 2011). We then further stratified indels by whether they were slippage-induced or complex (classified as NR), insertions or deletions, or within CNCs (Fig. 4A). Within indels we observed that insertions and complex indels explained a relatively large fraction of the variation in expression, and one that is similar to the proportion explained by SNPs (Fig. 4A). However, taken as a whole, indels did not explain more of the variation in expression than do SNPs, and this remains true when restricting to CNCs.
Figure 4.
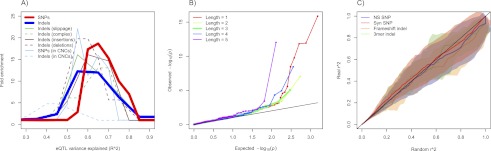
Indels influencing gene expression and disease. (A) Distribution of relative frequencies (y-axis) with which variants drawn from several classes (see legend) explain a certain fraction of the variance in exonic gene expression levels (x-axis, measured by R2, Pearson's correlation coefficient squared). For each variant, the exon showing the highest association was taken. Frequencies are shown relative to the distribution obtained from 100 permutations (for details, see Supplemental Information). (B) QQ plots of Spearman association P-values for coding indels by exon-level gene expression are stratified by indel length. Here, the enrichment of P-values for indels of length 1, 2, 4, and 5 relative to length 3 (green-line) is indicative of nonsense-mediated decay. For associations at an FDR of 0.20, this difference trended to significance for polarized indels (P = 0.10) and was significant for polarized and slippage indels (P = 0.04). (C) QQ plots of the distribution of linkage (r2) between GWA variants and nearby protein-coding variants (y-axis; four classes of variants), against a background distribution obtained from randomly drawn SNPs chosen to be controlled for excess linkage, and frequency-matched and chromosome-matched with the set of GWA SNPs (x-axis) (Supplemental Information). The central line and standard errors of these QQ curves were obtained by repeating the procedure 100 times. The SNP and indel r2 distributions and standard errors (displayed as a cloud) tracked each other across all observed values.
As our set includes many indels within exons, we sought to examine their influence on gene expression and their relationship to complex trait associations. We first observed that frameshift-causing indels of lengths 1, 2, 4, and 5 were enriched with significant (FDR<0.5) exon-level gene expression associations compared to in-frame indels of length 3, a signal that itself is significant (Fisher's exact test, P = 0.031) and is consistent with the action of nonsense-mediated decay (Fig. 4B). Further tests indicate that this signal is unlikely to be the product of length-driven differences in genotyping accuracy (see Methods).
We next asked whether exonic indels tagged by GWA SNPs (NHGRI Catalog 12/21/10) may in fact be the causal variant of GWA phenotypes. This possibility was suggested by a previous study that identified some coding indels in perfect linkage (D′ = 1) with top GWA SNPs (Mills et al. 2011), but their data did not allow testing whether such indels did in fact occur more frequently in high linkage disequilibrium (LD) than expected by chance alone. To address this, we compared sets of top GWA SNPs across a large range of traits with a control set of pseudo-GWA SNPs (control SNPs) and assessed the degree to which either set of SNPs showed evidence for linkage with putative causal variants, either protein-coding SNPs or indels. More specifically, for any GWA or control SNP, we determined the distribution of r2 values between that marker and protein-coding variants within 500 kb and assessed whether these distributions were significantly different between the GWA SNPs and controls (Methods; Supplemental Information, section 19). In addition, we stratified our analysis by nonsynonomous SNPs, synonymous SNPs, frameshift indels, and nonframeshift indels to explicitly test if a particular class was more enriched than any other.
The resulting r2 distributions were compared by creating QQ plots for each pair of r2 distributions for randomized GWA SNPs and matched controls, and the results are summarized in Figure 4C (for details, see Methods). The plot shows no significant difference between the r2 profiles, indicating no significant enrichment for putative causative indels in high LD with GWA SNPs.
Discussion
We present and analyze a set of genome-wide small indel polymorphisms across three human populations. Using high-quality fosmid data and Sanger sequencing to validate a fraction of calls, we estimate the false discovery rate and detection power to be comparable to that of SNPs called from the same data. This makes the present set of genome-wide human indel polymorphisms one of the most comprehensive and accurate to date, enabling a comprehensive and detailed analysis. It is however worth noting that indel calling from short read data remains challenging and an area of considerable research activity; rapid advances in algorithms, pipelines, and sequencing will likely contribute to ongoing improvements. As such, evaluation of indel calling pipelines will remain an essential component of future studies.
Compared to SNPs, rates of indel mutagenesis are known to be variable across the genome (Kvikstad et al. 2007), with high rates in microsatellites (Ellegren 2004; Kondrashov and Rogozin 2004; Kelkar et al. 2008). Here we find that microsatellites represent the extreme end of a spectrum of rate heterogeneity driven by local repeat structures, a phenomenon that affects mononucleotide runs, tandem repetitive tracts, and nearly repetitive regions of all lengths. This rate heterogeneity causes the levels of heterozygosity due to indels to vary from 4 × 10⁻⁵ indels per site in the 96% of the genome we classify as nonrepetitive (NR), to upwards of 0.3 at homopolymer sites >10 bp and similarly modest-length tandem repeats. We present evidence that polymerase slippage is the mechanism driving this tremendous rate heterogeneity. As observed before (Schlötterer 2000), indel rates have a strong positive correlation with tract length and a smaller negative correlation with the size of the repeat unit, but their precise relationship has never been quantified as accurately as our data has allowed us to do. We have developed a simple probabilistic model of polymerase slippage that explains these correlations and accurately predicts indel rates across the observed range, as a function of local sequence similarity. The good quantitative fit supports the idea that polymerase slippage by itself can explain the remarkable rate heterogeneity among stable nonrepetitive sequence, indel-prone homopolymers (Ananda et al. 2013), multiallelic tandem repetitive sites, and highly unstable microsatellites. Interpretation of the inferred model parameter indicates that polymerase slippage most frequently involves the formation of “loops” of 1–4 bp, although longer loops also occur; once formed these loops are generally unstable, but may become stabilized by the presence of sequence identity at the misaligned locus of ∼6 bp or more, leading to indel formation.
We also present evidence that over three-fourths of all indels are caused by polymerase slippage not only within microsatellites (Ellegren 2004) but across the genome. In nonrepetitive regions, accounting for about half of indels we considered, most (56%) are of CCC type and consistent with polymerase slippage. Some contribution of the nonhomologous end joining (NHEJ) pathway cannot be excluded as break repair can result in CCC indels through the pathway's preference for microhomologies in the repair template (Guirouilh-Barbat et al. 2004). Within repetitive regions, the large majority of indels is associated with slippage; in addition, our pipeline does not call multiallelic indels in highly repetitive regions, where polymerase slippage is very common. Together, these observations indicate that polymerase slippage is responsible for the large majority of indel mutations.
Small indels are unlikely to drive the evolution of genome length as large CNVs and other large structural variation, although relatively rare, can a have large impact on genome length (Stankiewicz and Lupski 2010). However, we did investigate how indels drive the evolution of local allele length and found evidence for the existence of two distinct evolutionary states. In the nonrepetitive fraction of the genome, indel rates are low; and any indels that occur act, on average, to shorten any repetitive segment that may be present. In contrast, for homopolymer and tandem repetitive regions above a certain size, not only are indel rates high but polymerase slippage causes the alleles to, on average, increase in size (up to a maximum above which we find that alleles tend to decrease in size, preventing runaway expansion). An unstable equilibrium exists between these two states, at which on average, alleles do not change in size. Because this equilibrium is unstable, the two states are metastable, and while persisting for long times, the stochastic nature of mutations will cause occasional switches between them. The resulting threshold character of microsatellite genesis was observed before in yeast (Rose and Falush 1998), whereas a theoretical model related to ours was proposed before to explain microsatellite's apparent length constraint (Garza et al. 1995), but no direct support from nucleotide data was hitherto available (Stankiewicz and Lupski 2010). Our data does directly support a general biased mutation model of the type introduced by Garza et al. (1995). One caveat is that our data are based on genome averages, and it is likely that local mutation rate variations will modify the predicted behavior in particular regions. Nevertheless, it will be interesting to quantify to what extent the biased mutation model and its implied birth–death model for microsatellites can explain the evolutionary dynamics and distribution of microsatellites and other repetitive regions in mammalian genomes. In addition, the unstable equilibrium separating “complex” from “microsatellite-like” regions (e.g., 6 bp for homopolymers) may also serve as a more objective definition of microsatellites rather than the arbitrary thresholds on length and sequence identity that are now commonly used for this purpose (Schlötterer 2000).
Besides polymerase slippage, unequal crossover provides another mechanism for short indel mutagenesis, which is known to act in some highly unstable minisatellites (Murray et al. 1999). Despite the large data set analyzed here and in agreement with previous studies (see Ellegren 2004 and references therein), we find no evidence for a significant contribution to overall indel rates via this mechanism. In particular, the slippage model correctly predicts HR, TR, and CCC indels to be enriched with A and T nucleotides (Table 3) since GC-rich sequence is more refractory to DNA denaturation, required for slippage to occur (Garcia-Diaz and Kunkel 2006), whereas recombination is positively associated with GC content in humans (Fullerton et al. 2001).
Even without a direct mutagenic effect of recombination, any systematic bias of indel mismatch repair in regions involved in recombination, a hypothetical process that may be termed “indel-biased gene conversion” analogous to GC-based gene conversion (Duret and Galtier 2009), could lead to an increased drive toward fixation of indels in such regions. However we find no evidence for increased polymorphism rates around hotspot motifs known to be active in the CEU population. However, in contrast to a previous study (The 1000 Genomes Project Consortium 2010), we do find evidence for an enrichment of SNPs in these regions, which may be the result of GC-biased gene conversion or indeed of a mutagenic effect of recombination.
Among indels in NR regions, ∼90% are deletions, consistent with a major role for the NHEJ pathway. However we also found evidence that the minority of NR insertions more often than expected lead to the introduction of palindromic sequence features. Similar features were previously observed in a fraction of somatic mutations at the TP53 locus (Greenblatt et al. 1996) and in Escherichia coli mutations (Viswanathan et al. 2000). Conversely, we find that in NR regions, both insertions and deletions that cannot be explained by polymerase slippage are enriched at sites with palindromic sequence features, a pattern also observed in E. coli (Viswanathan et al. 2000). We here propose the FoSTeS/MMBIR pathway to explain both observations; this pathway was previously proposed as a general mechanism for the mutagenesis of large structural variants (Lee et al. 2007; Hastings et al. 2009), but the same mechanism naturally supports the formation of simple indels as well.
Turning to the functional implications, we first investigated whether the heterogeneity of indel rates had an impact on indel rates of protein-coding genes. Although generally coding sequence (CDS) is less repetitive compared to the genome as a whole, we identified 10 protein-genes with a predicted indel rate exceeding 2 × 10⁻⁵ per generation across the CDS due to various kinds of repetitive or near-repetitive regions. Importantly, we did not require indel polymorphisms, which are potentially under strong purifying selection and therefore short-lived, to identify these genes. Although some genes are known disease genes that are prone to indel mutations (HTT, AR, ARID1B), for others this is less clear.
More broadly we find, as expected, that indels are under purifying selection in functional regions. This is particularly true in CDS, where indels generally are under stronger purifying selection than SNPs; this is likely a result of the strongly deleterious effect of frameshift indels as the selection strengths on nonsynonymous SNPs and in-frame indels are not significantly different. Interestingly, in conserved noncoding (CNC) sequence, indels again are under stronger purifying selection than SNPs; and in particular, longer indels and indels that remove more evolutionarily conserved nucleotides have stronger fitness effect. Thus, although indels occur at relatively low rates particularly in nonrepetitive regions compared to SNPs, their functional impact can be considerable, arguing for indels to be included when studying genotype–phenotype correlations.
One straightforward strategy to implement this is to include indels in GWAS studies by imputing their genotypes from tagging SNPs. We find that a substantial fraction of indels (58.1%) is tagged by a nearby SNP (r2>0.8 within 100 kb), showing that this approach is feasible. The fraction of taggable indels is however lower than the comparable figure for SNPs (76.1% taggable), an observation that is at least partly due to higher levels of homoplasy in indel hotspots, leading to lower fractions of taggable indels in the TR and PR categories (Table 3; Supplemental Fig. S16). Even among NR indels the fraction of taggable indels (66%) does not reach the levels observed for SNPs, likely because of higher rates of genotyping error among indels of any type (Supplemental Fig. S16; The 1000 Genomes Project Consortium 2010). The same explanation likely contributes to the observation that despite a relatively high fraction of indels among top associations of genetic variants with gene expression levels, among those strongly associated variants indels do not explain as much of the variation in gene expression levels as do SNPs; this remains true when restricting to variants in CNCs. Not all indels have comparable impact; we found that among genomic indels, insertions and complex (NR) indels had larger average effects than both deletions and slippage indels and, overall, a similar impact to SNPs. For exonic indels, we observed a significant enrichment of expression associations for frameshift indels of lengths 1, 2, 4, and 5 compared to in-frame indels of length 3, consistent with expectation for the influence of nonsense-mediated decay.
Given the large numbers of indels identified in this study and the impact on expression we detect, one might expect a fair proportion of indels to drive GWA results. If true, this might result in an enrichment of putatively causal indels in high LD with GWA SNPs. Here, we investigated the relationship of indels to trait-associated variants and developed an approach that assessed the enrichment of exonic SNPs and indels in LD with GWA SNPs. Despite anecdotal examples of indels in high LD with GWA SNPs, we demonstrate that this enrichment is not more than one would expect by chance.
One interpretation of this result is that indels as a class are as important, but not more important, for disease risk as SNPs. Another is that our chosen class of putatively causative variants, those within exonic sequence, are in fact not driving the majority of GWAS associations. Irrespective of whether indels or SNPs are driving the majority of GWAS results, the high fraction of top exon-level expression associations attributed to indel variants, which is consistent with either interpretation, indicates the importance of these variants in GWA studies and argues for their integration into fine mapping and resequencing analyses. The present set of indels and their genotypes provides a first step toward this goal.
Methods
Sequencing data and indel calling
We used short-read data obtained from sequencing human samples from three population panels (CEU, YRI, JPT/CHB) on the Illumina Genome Analyser platform as previously reported (The 1000 Genomes Project Consortium 2010), mapped these to human reference NCBI36 using Stampy (Lunter and Goodson 2011), combined indels observed in individual reads with previously identified candidates (The 1000 Genomes Project Consortium 2010), tested each candidate and calculated genotype likelihoods using Dindel (Albers et al. 2011), and used IMPUTE2 (Howie et al. 2009) to call genotypes.
Indel annotation
Indels were classified as Homopolymer Run (HR), Tandem Repeat (TR), or Predicted hotspot (PR) if, based on the type of the sequence context we predict the per-site indel rate to exceed the mutation rate due to single nucleotide polymorphisms. For HR and TR, this is based on simple length thresholds (Supplemental Information, section 5); for PR this is based on the local indel rate model (below). Indels not classified as occurring in indel hotspots were classified as nonrepetitive (NR).
Estimating the fraction of insertions caused by template switching
We first obtained distributions of longest quasi-palindromic (reverse complement) matches for non-CCC deletions and insertions at NR sites. Specifically, we looked at the longest match from the short haplotype (a 2W nucleotide window around the insertion site) to the reverse-complemented long haplotype (2W + L nucleotides; L is the number of inserted or deleted nucleotides); the match was allowed to occur anywhere within these windows. We chose the value of W that maximized the Kullback-Leibler divergence between the two distributions (W = 20) (Supplemental Table S7). The resulting distributions are significantly different from each other, with a higher mean for the insertion distribution (P < 2.2 × 10⁻¹⁶, Wilcoxon one-sided rank sum test).
To estimate the fraction of insertions caused by template switching, we assumed that no deletions were caused by this mechanism and modeled the distribution of palindromic match lengths for insertions as a mixture of the deletion distribution plus a distribution Ξ for template-switching insertions. To model the sample variance of the occupancy of a single bin with count A, we used a Poisson distribution of rate A + 1, the single pseudocount being the limiting behavior of a gamma conjugate prior to the Poisson with parameters α = 1 and β→0. The maximum likelihood Poisson rate parameters for each bin of Ξ were calculated under the constraint that all rates be non-negative, and the mixture parameter γ was found using constrained optimization of the likelihood; for W = 20 we find γ = 0.848, implying a fraction of insertions caused by strand switching of 1-γ = 0.152.
Polarization of indels
Using four primate species (chimpanzee, gorilla, orangutan, and macaque) in the UCSC Genome Browser's 44-way alignment, we polarized indels when (1) at least two outgroup species aligned to the locus; (2) all aligning species showed concordant alleles; (3) the primates' alleles either all matched the hg18 reference allele or all matched the indel allele. Alleles were matched across a window from 5-bp left of the leftmost possible indel locus to the indel length plus the larger of 5 bp or the repeat length tract rightward of the locus. To match alleles, only the indel length and type were considered, the sequence was disregarded to allow for substitutions. When more than one indel was found in any primate within the window, alleles were not matched.
eQTLs are enriched with frame-shift indels
To exclude the possibility of differences in false positive rates between indels of different length driving the enrichment of frame-shifting indels among eQTLs, we assessed the difference in this enrichment among indels of length ≤ 3 and length 3 up to 9, so that the in-frame indels are alternatively the least prevalent and longest, or the most prevalent and shortest among the indels considered. For length ≤ 3, the enrichment trended to significance (Fisher's exact test, P = 0.057) and for length ≥ 3 to 9, the enrichment was significant (Fisher's exact test P = 0.020), indicating that the association of eQTLs with frameshift indels is unlikely to be the product of length-driven differences in genotyping accuracy.
Creating sets of controls for GWA SNPs, and QQ plot summaries
To create a matching control set of SNPs to assess whether GWA SNPs are enriched with strong linkage to protein-coding variants, we needed to overcome several challenges. First, after matching for chromosome and frequency, pairs of GWA SNPs still show an excess of high LD compared to pairs of controls, presumably due to overlap or similarity of traits targeted by the various GWA studies. Second, GWA SNPs tend to be closer to genes than random SNPs. To address the excess LD, we first subsampled GWA SNPs requiring that no two SNPs were within 500 kb of each other (30 sets containing an average of 1500 SNPs) and computed r2 values between each SNP and nearby (<500 kb) putative causal variants. For each set, we next sampled control SNPs, matching the chromosome and minor allele frequency distribution of the set, and similarly computed r2 values; this was repeated 100 times. To adjust for the lower density of nearby putative causal variants in these control SNPs, we increased the number of sampled control SNPs accordingly. In this way, each of 3000 pairs of a subsampled set of GWA SNPs and matched control SNPs results in two r2 distributions, and QQ plots were generated for all; we then summarized these by plotting for every quantile on the x-axis (r2 quantile for controls) the mean y-axis quantile (r2 quantile for GWA SNPs) and its empirical standard deviation (Fig. 4C).
Data access
Calls are deposited in dbSNP (handle LUNTER, ssid ss550899107-ss553708517) and are available in VCF format as supporting information online.
Acknowledgments
This research was supported in part by NSF grant DBI-0965596 (to K.D.M.), NIH grant R01GM087472 (to K.D.M. and Kristin Eckert), British Heart Foundation grant RG/09/12/28096 (to C.A.A.), EMBO Long Term Fellowship ALTF 354-2010 (to E.K.), Wellcome Trust core grant 090532/Z/09/Z (G.L. and G.McV.), and the Edward J. Mallinckrodt Jr. Foundation (S.B.M.). S.B.M. would like to thank Emmanouil T. Dermitzakis for his support of this work.
Footnotes
[Supplemental material is available for this article.]
Article published online before print. Article, supplemental material, and publication date are at http://www.genome.org/cgi/doi/10.1101/gr.148718.112.
Freely available online through the Genome Research Open Access option.
References
- The 1000 Genomes Project Consortium. 2010. A map of human genome variation from population-scale sequencing. Nature 467: 1061–1073 [DOI] [PMC free article] [PubMed] [Google Scholar]
- Akashi H, Schaeffer SW 1997. Natural selection and the frequency distributions of “silent” DNA polymorphism in Drosophila. Genetics 146: 295–307 [DOI] [PMC free article] [PubMed] [Google Scholar]
- Albers CA, Lunter G, MacArthur DG, McVean G, Ouwehand WH, Durbin R 2011. Dindel: Accurate indel calls from short-read data. Genome Res 21: 961–973 [DOI] [PMC free article] [PubMed] [Google Scholar]
- Ananda G, Walsh E, Jacob KD, Krasilnikova M, Eckert KA, Chiaromonte F, Makova KD 2013. Distinct mutational behaviors differentiate short tandem repeats from microsatellites in the human genome. Genome Biol Evol (in press). [DOI] [PMC free article] [PubMed] [Google Scholar]
- Bhangale TR, Rieder MJ, Livingston RJ, Nickerson DA 2005. Comprehensive identification and characterization of diallelic insertion-deletion polymorphisms in 330 human candidate genes. Hum Mol Genet 14: 59–69 [DOI] [PubMed] [Google Scholar]
- Chu G 1997. Double strand break repair. J Biol Chem 272: 24097–24100 [DOI] [PubMed] [Google Scholar]
- Davydov EV, Goode DL, Sirota M, Cooper GM, Sidow A, Batzoglou S 2010. Identifying a high fraction of the human genome to be under selective constraint using GERP++. PLoS Comput Biol 6: e1001025. [DOI] [PMC free article] [PubMed] [Google Scholar]
- Duret L, Galtier N 2009. Biased gene conversion and the evolution of mammalian genomic landscapes. Annu Rev Genomics Hum Genet 10: 285–311 [DOI] [PubMed] [Google Scholar]
- Ellegren H 2004. Microsatellites: Simple sequences with complex evolution. Nat Rev Genet 5: 435–445 [DOI] [PubMed] [Google Scholar]
- Fullerton SM, Bernardo Carvalho A, Clark AG 2001. Local rates of recombination are positively correlated with GC content in the human genome. Mol Biol Evol 18: 1139–1142 [DOI] [PubMed] [Google Scholar]
- Garcia-Diaz M, Kunkel TA 2006. Mechanism of a genetic glissando: Structural biology of indel mutations. Trends Biochem Sci 31: 206–214 [DOI] [PubMed] [Google Scholar]
- Garza JC, Slatkin M, Freimer NB 1995. Microsatellite allele frequencies in humans and chimpanzees, with implications for constraints on allele size. Mol Biol Evol 12: 594–603 [DOI] [PubMed] [Google Scholar]
- Greenblatt MS, Grollman AP, Harris CC 1996. Deletions and insertions in the p53 tumor suppressor gene in human cancers: Confirmation of the DNA polymerase slippage/misalignment model. Cancer Res 56: 2130–2136 [PubMed] [Google Scholar]
- Guirouilh-Barbat J, Huck S, Bertrand P, Pirzio L, Desmaze C, Sabatier L, Lopez BS 2004. Impact of the KU80 pathway on NHEJ-induced genome rearrangements in mammalian cells. Mol Cell 14: 611–623 [DOI] [PubMed] [Google Scholar]
- Hastings PJ, Ira G, Lupski JR 2009. A microhomology-mediated break-induced replication model for the origin of human copy number variation. PLoS Genet 5: e1000327. [DOI] [PMC free article] [PubMed] [Google Scholar]
- Howie BN, Donnelly P, Marchini J 2009. A flexible and accurate genotype imputation method for the next generation of genome-wide association studies. PLoS Genet 5: e1000529. [DOI] [PMC free article] [PubMed] [Google Scholar]
- Katzman S, Capra JA, Haussler D, Pollard KS 2011. Ongoing GC-biased evolution is widespread in the human genome and enriched near recombination hot spots. Genome Biol Evol 3: 614–626 [DOI] [PMC free article] [PubMed] [Google Scholar]
- Keane TM, Goodstadt L, Danecek P, White MA, Wong K, Yalcin B, Heger A, Agam A, Slater G, Goodson M, et al. 2011. Mouse genomic variation and its effect on phenotypes and gene regulation. Nature 477: 289–294 [DOI] [PMC free article] [PubMed] [Google Scholar]
- Kelkar YD, Tyekucheva S, Chiaromonte F, Makova KD 2008. The genome-wide determinants of human and chimpanzee microsatellite evolution. Genome Res 18: 30–38 [DOI] [PMC free article] [PubMed] [Google Scholar]
- Kidd JM, Graves T, Newman TL, Fulton R, Hayden HS, Malig M, Kallicki J, Kaul R, Wilson RK, Eichler EE 2010. A human genome structural variation sequencing resource reveals insights into mutational mechanisms. Cell 143: 837–847 [DOI] [PMC free article] [PubMed] [Google Scholar]
- Kondrashov AS, Rogozin IB 2004. Context of deletions and insertions in human coding sequences. Hum Mutat 23: 177–185 [DOI] [PubMed] [Google Scholar]
- Kvikstad EM, Tyekucheva S, Chiaromonte F, Makova KD 2007. A macaque's-eye view of human insertions and deletions: Differences in mechanisms. PLoS Comput Biol 3: 1772–1782 [DOI] [PMC free article] [PubMed] [Google Scholar]
- Lee JA, Carvalho CM, Lupski JR 2007. A DNA replication mechanism for generating nonrecurrent rearrangements associated with genomic disorders. Cell 131: 1235–1247 [DOI] [PubMed] [Google Scholar]
- Levinson G, Gutman GA 1987. Slipped-strand mispairing: A major mechanism for DNA sequence evolution. Mol Biol Evol 4: 203–221 [DOI] [PubMed] [Google Scholar]
- Levy S, Sutton G, Ng PC, Feuk L, Halpern AL, Walenz BP, Axelrod N, Huang J, Kirkness EF, Denisov G, et al. 2007. The diploid genome sequence of an individual human. PLoS Biol 5: e254. [DOI] [PMC free article] [PubMed] [Google Scholar]
- Lunter G, Goodson M 2011. Stampy: A statistical algorithm for sensitive and fast mapping of Illumina sequence reads. Genome Res 21: 936–939 [DOI] [PMC free article] [PubMed] [Google Scholar]
- Lunter G, Ponting CP, Hein J 2006. Genome-wide identification of human functional DNA using a neutral indel model. PLoS Comput Biol 2: e5. [DOI] [PMC free article] [PubMed] [Google Scholar]
- MacArthur DG, Tyler-Smith C 2010. Loss-of-function variants in the genomes of healthy humans. Hum Mol Genet 19: R125–R130 [DOI] [PMC free article] [PubMed] [Google Scholar]
- McVey M, Larocque JR, Adams MD, Sekelsky JJ 2004. Formation of deletions during double-strand break repair in Drosophila DmBlm mutants occurs after strand invasion. Proc Natl Acad Sci 101: 15694–15699 [DOI] [PMC free article] [PubMed] [Google Scholar]
- Mills RE, Pittard WS, Mullaney JM, Farooq U, Creasy TH, Mahurkar AA, Kemeza DM, Strassler DS, Ponting CP, Webber C, et al. 2011. Natural genetic variation caused by small insertions and deletions in the human genome. Genome Res 21: 830–839 [DOI] [PMC free article] [PubMed] [Google Scholar]
- Montgomery SB, Sammeth M, Gutierrez-Arcelus M, Lach RP, Ingle C, Nisbett J, Guigo R, Dermitzakis ET 2010. Transcriptome genetics using second generation sequencing in a Caucasian population. Nature 464: 773–777 [DOI] [PMC free article] [PubMed] [Google Scholar]
- Mullaney JM, Mills RE, Pittard WS, Devine SE 2010. Small insertions and deletions (INDELs) in human genomes. Hum Mol Genet 19: R131–R136 [DOI] [PMC free article] [PubMed] [Google Scholar]
- Murray J, Buard J, Neil DL, Yeramian E, Tamaki K, Hollies C, Jeffreys AJ 1999. Comparative sequence analysis of human minisatellites showing meiotic repeat instability. Genome Res 9: 130–136 [PMC free article] [PubMed] [Google Scholar]
- Myers S, Freeman C, Auton A, Donnelly P, McVean G 2008. A common sequence motif associated with recombination hot spots and genome instability in humans. Nat Genet 40: 1124–1129 [DOI] [PubMed] [Google Scholar]
- Nishizawa M, Nishizawa K 2005. On slippage-like mutation dynamics within genes: A study of pseudogenes and 3′UTRs. J Mol Evol 60: 274–275 [DOI] [PubMed] [Google Scholar]
- Rose O, Falush D 1998. A threshold size for microsatellite expansion. Mol Biol Evol 15: 613–615 [DOI] [PubMed] [Google Scholar]
- Schlötterer C 2000. Evolutionary dynamics of microsatellite DNA. Chromosoma 109: 365–371 [DOI] [PubMed] [Google Scholar]
- Stankiewicz P, Lupski JR 2010. Structural variation in the human genome and its role in disease. Annu Rev Med 61: 437–455 [DOI] [PubMed] [Google Scholar]
- Stenson PD, Ball EV, Howells K, Phillips AD, Mort M, Cooper DN 2009. The Human Gene Mutation Database: Providing a comprehensive central mutation database for molecular diagnostics and personalized genomics. Hum Genomics 4: 69–72 [DOI] [PMC free article] [PubMed] [Google Scholar]
- Streisinger G, Okada Y, Emrich J, Newton J, Tsugita A, Terzaghi E, Inouye M 1966. Frameshift mutations and the genetic code. This paper is dedicated to Professor Theodosius Dobzhansky on the occasion of his 66th birthday. Cold Spring Harb Symp Quant Biol 31: 77–84 [DOI] [PubMed] [Google Scholar]
- Taylor MS, Ponting CP, Copley RR 2004. Occurrence and consequences of coding sequence insertions and deletions in Mammalian genomes. Genome Res 14: 555–566 [DOI] [PMC free article] [PubMed] [Google Scholar]
- Usdin K 2008. The biological effects of simple tandem repeats: Lessons from the repeat expansion diseases. Genome Res 18: 1011–1019 [DOI] [PMC free article] [PubMed] [Google Scholar]
- Viswanathan M, Lacirignola JJ, Hurley RL, Lovett ST 2000. A novel mutational hotspot in a natural quasipalindrome in Escherichia coli. J Mol Biol 302: 553–564 [DOI] [PubMed] [Google Scholar]
- Wheeler DA, Srinivasan M, Egholm M, Shen Y, Chen L, McGuire A, He W, Chen YJ, Makhijani V, Roth GT, et al. 2008. The complete genome of an individual by massively parallel DNA sequencing. Nature 452: 872–876 [DOI] [PubMed] [Google Scholar]
- Whittaker JC, Harbord RM, Boxall N, Mackay I, Dawson G, Sibly RM 2003. Likelihood-based estimation of microsatellite mutation rates. Genetics 164: 781–787 [DOI] [PMC free article] [PubMed] [Google Scholar]
- Wierdl M, Dominska M, Petes TD 1997. Microsatellite instability in yeast: Dependence on the length of the microsatellite. Genetics 146: 769–779 [DOI] [PMC free article] [PubMed] [Google Scholar]
- Zhang F, Khajavi M, Connolly AM, Towne CF, Batish SD, Lupski JR 2009. The DNA replication FoSTeS/MMBIR mechanism can generate genomic, genic and exonic complex rearrangements in humans. Nat Genet 41: 849–853 [DOI] [PMC free article] [PubMed] [Google Scholar]
- Zhu Y, Strassmann JE, Queller DC 2000. Insertions, substitutions, and the origin of microsatellites. Genet Res 76: 227–236 [DOI] [PubMed] [Google Scholar]