

Abstract
The majority of microbial genomic diversity remains unexplored. This is largely due to our inability to culture most microorganisms in isolation, which is a prerequisite for traditional genome sequencing. Single-cell sequencing has allowed researchers to circumvent this limitation. DNA is amplified directly from a single cell using the whole-genome amplification technique of multiple displacement amplification (MDA). However, MDA from a single chromosome copy suffers from amplification bias and a large loss of specificity from even very small amounts of DNA contamination, which makes assembling a genome difficult and completely finishing a genome impossible except in extraordinary circumstances. Gel microdrop cultivation allows culturing of a diverse microbial community and provides hundreds to thousands of genetically identical cells as input for an MDA reaction. We demonstrate the utility of this approach by comparing sequencing results of gel microdroplets and single cells following MDA. Bias is reduced in the MDA reaction and genome sequencing, and assembly is greatly improved when using gel microdroplets. We acquired multiple near-complete genomes for two bacterial species from human oral and stool microbiome samples. A significant amount of genome diversity, including single nucleotide polymorphisms and genome recombination, is discovered. Gel microdroplets offer a powerful and high-throughput technology for assembling whole genomes from complex samples and for probing the pan-genome of naturally occurring populations.
The majority of genomic diversity remains unexplored. This is in large part due to our inability to culture most microorganisms in isolation, which is a prerequisite for traditional sequencing (Amann et al. 1995). While shotgun sequencing and assembly of environmental samples is possible, assembly into complete genomes is generally only feasible for simple microbial communities (Tyson et al. 2004; Venter et al. 2004; Hess et al. 2011; Iverson et al. 2012). Moreover, these assemblies are actually consensus genomes derived from closely related species or strains, which makes many interesting analyses of genomes and populations impossible. Single-cell sequencing, enabled by the whole-genome amplification technique of multiple displacement amplification (MDA) (Dean et al. 2001, 2002), has allowed researchers to sequence and assemble a significant portion of a single genome (Zhang et al. 2006; Woyke et al. 2009). However, MDA from a single cell suffers from amplification bias. The single chromosome copy is broken into DNA fragments, further adding to amplification bias, and any contaminating DNA can also contribute to the sequences obtained (Raghunathan et al. 2005; Woyke et al. 2011). It is therefore generally not possible to finish a microbial genome starting from a single cell (Rodrigue et al. 2009). Because the bias is lessened with an additional starting template, a potential solution is to provide more copies of the target genome as input into an MDA (Pan et al. 2008; Woyke et al. 2010; Dichosa et al. 2012). Here we propose using bacterial microcolonies contained within gel microdroplets (GMDs), which allows one to perform DNA amplification on hundreds to thousands of copies of a bacterial genome.
GMDs are small spheres composed of an agarose matrix in which one can grow colonies of bacteria starting from a single cell. They are very permeable and thus allow for communication among the microbial community members, which many bacteria require to complete some undetermined aspect of their life cycle (West et al. 2007). Critically, the reproducing cells remain spatially separate so individual colonies can be manipulated following group culture. While already used to cultivate novel microorganisms in order to screen for interesting metabolites, to our knowledge this technique has not been used for the purpose of metagenomic or genomic sequencing (Zengler et al. 2002). In this study, we demonstrate its utility for producing near-complete genomes of environmental microorganisms by using human fecal and oral bacteria as a demonstration. We show that the resulting assemblies are vastly superior to those produced via single-cell sequencing and that GMDs also have the potential to produce genomic data for currently uncultured and unsequenced genomes. Furthermore, this technique shows great promise for exploring intraspecies genomic variation (i.e., the pan-genome) (Tettelin et al. 2005; Hogg et al. 2007).
Results
GMD manipulation
After encapsulation and incubation, gel microdroplets (GMDs) can be visualized and manipulated via flow cytometry or micromanipulation. Figure 1, A–D, shows cytographs of the population that can be targeted for sorting and further analysis via flow cytometry. The occupied GMDs show a shift in both fluorescence and side scatter; to maximize specificity, we gated on both of these dimensions. Figure 1E shows the relative size of microcolonies within GMDs. GMDs exhibit a general size range of 20–70 μm with an average size of 45 μm.
Figure 1.

Flow cytometry and light microscopy images of gel microdroplets (GMDs). (A,C) GMDs occupied with a colony are shown circled. (B,D) An unincubated sample that does not contain occupied GMDs. (E) Light microscopy image of GMDs containing a colony.
GMDs produce better sequencing results than single cells
Single cells and GMDs were chosen for sequencing following MDA and a screen of the 16S rDNA, which is the most commonly used genetic marker for bacteria. The GMDs were micromanipulated, and single cells were flow-sorted. To have adequate replication, we chose samples for sequencing based on BLAST hits of the 16S rDNA to the same species. All oral samples hit to Streptococcus oralis, while all fecal samples hit to Enterococcus faecium. However, because we do not have cultures needed for physiological tests and because our sequencing results showed substantial differences with available reference genomes, we refer to our targets as Streptococcus sp. and Enterococcus sp. Assembly, read mapping, and annotation statistics are shown in Supplemental Table 1 with selected results in Figure 2.
Figure 2.

Sequencing results of amplified single cells and GMDs. (Blue circles) GMDs; (orange circles) single cells. (A) Assembly size; (B) largest contig; (C) percent contamination. (D) Genome recovery as measured by mapped reads to the best GMD assembly. (*) Statistical significance for that comparison (P < 0.05).
The assembly sizes for Streptococcus sp. and Enterococcus sp. were much higher for GMDs than for single cells (Fig. 2A, t-test, P = 7.381 × 10⁻⁹; Mann-Whitney test, P = 0.004329) (accession numbers for assemblies from GMDs: AJQX00000000–AJRH00000000). GMDs also had significantly larger N50 statistics (Fig. 2B, Mann-Whitney test, P = 0.04113; Mann-Whitney test, P = 0.004329). Contamination was measured by checking all contigs against the NCBI nt database with BLAST. Those contigs that did not hit to the target phylum or show high identity with another species of bacteria were considered contaminants and were removed from the assembly. GMD assemblies showed less contamination than single cells for the Streptococcus sp. and Enterococcus sp., but the trend was not significant for the Enterococcus sp. samples (Fig. 2C, t-test, P = 0.02238; Mann-Whitney test, P = 0.1255). This lack of significance was due to a single outlier that contained considerable Escherichia coli contamination, presumably due to coencapsulation, which, based on our starting concentration of cells, should occur in ∼3% of all occupied GMDs. Without this outlier, the trend is highly significant (Mann-Whitney test, P = 0.009524). For both GMD and single-cell Streptococcus sp. samples, the single most common source of contamination was human. Another important source of contamination for single cells of both Enterococcus sp. and Streptococcus sp. was “junk” or template-independent product. There was very little contamination of any sort in Enterococcus sp. GMDs aside from the E. coli contamination mentioned above.
To determine the relative completeness of each assembly, reads were mapped to the best assembly. The most contiguous and cleanest assemblies (Streptococcus sp. GMD-5 with 77 contigs and Enterococcus sp. GMD-5 with 91 contigs) were chosen for comparison because the closest reference genomes, Streptococcus oralis Uo5 (NC_015291.1) and Enterococcus faecium TX16 (G Weinstock, unpubl.), respectively, were too divergent for this purpose. Streptococcus sp. GMDs showed a mean genome recovery of 99.96%, which was significantly higher than the average recovery of 47.23% for the single cells (Fig. 2D, t-test, P = 0.004698). When mapped to S. oralis Uo5, the trend in the data was identical, but recovery was reduced by ∼10% for all samples. The Enterococcus sp. GMDs all showed exactly 100% recovery, which was significantly higher than the 44.1% mean recovery shown by the single cells (Mann-Whitney, P = 0.001166). When mapped against the finished reference genome (E. faecium TX16), the GMDs and single cells showed a similar trend, but recovery was reduced by ∼12% for all samples.
Because we have no close reference genomes for comparison, it is difficult to make firm conclusions regarding contamination and completion. To validate the method of using BLAST for contaminant removal, we investigated whether contaminant contigs showed distinct tetranucleotide frequencies, which are known to vary among organisms (Teeling et al. 2004). Our results show that those contigs removed using BLAST do have distinct tetranucleotide frequencies and are therefore unlikely to be part of the target genome (Supplemental Fig. 1). To test whether our genomes were nearly complete, we compared our assembly sizes with the sizes of published finished and draft genomes of related Streptococcus spp. and E. faecium (Supplemental Table 2). We find that our assembly sizes fall in line with S. oralis and Streptococcus mitis genomes and a little below E. faecium genomes. When reads were assembled without using different coverage thresholds (required for a high-quality single-cell assembly), our Enterococcus sp. GMD assemblies were somewhat larger with an average ∼2.6 Mb (data not shown). This puts our assemblies closer to the size of the published reference genomes. Streptococcus sp. GMD assembly sizes were unchanged using this approach. As another measure of completeness, we looked for and found all multiple locus sequence typing (MLST) loci of S. oralis and E. faecium (Homan et al. 2002; Do et al. 2009).
Three of the 11 genomes from GMDs, two Streptococcus sp. and one Enterococcus sp., have also been improved using long read data from the RS genome sequencer from Pacific Bioscience. The hybrid assemblies with both Illumina data and PacBio data produced highly contiguous assemblies. The number of contigs for Streptococcus sp. GMD-3 and 5 and Enterococcus sp. GMD-5 dropped from 81, 77, and 91 to 12, 15, and 18, respectively (accession numbers: AJRC00000000, AJRG00000000, AJRF00000000).
We also sequenced E. coli K12 (ATCC 29425) as a control to measure the genome recovery rate from GMDs compared with single cells when a reference genome is available for comparison. DNA from six single cells of E. coli and six GMDs were sorted, amplified, sequenced, assembled, and mapped to a reference (E. coli str. K-12 substr. MG1655; accession number NC_000913). The results are shown in Supplemental Table 3. Genome recovery rates from single cells average 55%. Excluding an outlier, GMDs produced data averaging 97% genome recovery with much fewer gaps. If the outlier, which yielded only 66% coverage, is included, the average drops to 92%. The statistical analysis indicates significant coverage differences between GMDs and single cells with and without the large outlier (Mann-Whitney test, P = 0.01515 and t-test, P = 0.004913, respectively). Reasons for the low recovery from the outlier GMD are not completely known, although it is likely that improper identification and sorting of the GMD occurred during flow cytometry. Similar to the fecal and oral samples, the variability of the single cell results is much larger than the GMD samples (disregarding the outlier). Given the possible slight difference between reference and the strain we used and possible mapping errors in repetitive regions, the genome recovery of the GMD samples is probably close to completion. The assembled results of E. coli data agreed with mapping results (Supplemental Table 3) using the SPAdes assembler and gave somewhat less coverage using our Velvet-based single-cell assembly pipeline (Bankevich et al. 2012; data not shown). We found almost no contamination in E. coli data produced with either single cells or GMDs, and they do not differ significantly (Mann-Whitney test, P = 0.3939).
Single-cell amplification bias
Reads from GMD samples showed more even coverage across the genome. As representative examples, we show the results for the Streptococcus sp. Single Cell-3, which showed the highest genome recovery, and GMD-6, the GMD sample with the second highest recovery (we chose the second highest rather than mapping reads to an assembly derived from those same reads). In Figure 3A, it is clear that for the single-cell sample, a large portion of the genome is not covered at all, while some of the genome is covered at extremely high coverage (>15,000×). An inset is included to better show the GMD assembly data. Collectively, the GMD coverage distributions are significantly less skewed compared with the single-cell results (t-test, P = 0.02229 and Mann-Whitney, P = 0.008658, for Streptococcus sp. and Enterococcus sp., respectively). In Figure 3B, we show how coverage varies across the genome. The single-cell coverage is highly variable with very high coverage interspersed with regions of very low or zero coverage. The GMD data show some variation, but it is small compared to the single-cell data.
Figure 3.

Distribution of sequencing reads. Reads for single cells and GMDs were mapped to the best GMD assembly. Results for the best single-cell and second best GMD assembly for Streptococcus sp. are shown. (A) The distribution of base pairs having each level of coverage. (Orange) The single-cell distribution; (blue) the GMD distribution. (B) Fold coverage for every position in the genome. The inset zooms in near the origin to highlight the GMD results.
Based on genome recovery and random amplification, we would expect ∼21.9 kb of sequence to be shared by all Streptococcus sp. single-cell samples, but in fact they share 89.6 kb. This may indicate a bias toward amplification of the same regions. Bias in GC amplification, which has often been suggested as a source of MDA bias, could not explain this discrepancy. Single-cell and GMD contigs had similar %GC content (40.79% vs. 40.97% t-test, P = 0.6929). The Enterococcus sp. results appear to be more biased because the expected overlap is only 16.1 kb, but in fact they share 130.8 kb. In this case, GC amplification bias may play a role; the GC content from single-cell assemblies is significantly lower than found in GMD assemblies although the absolute amount of difference is not large (37.65% vs. 38.59% t-test, P = 0.0005567).
Intraspecies diversity of Streptococcus sp. and Enterococcus sp.
To investigate the genomic diversity found within populations of Streptococcus sp. and Enterococcus sp., we calculated the number of SNPs (short nucleotide polymorphisms) and indels (insertions and deletions) found in all pairwise comparisons by mapping reads to each assembly (Table 1). To make sure the SNP calling is accurate and consistent across the samples, we used two short reads aligners, Bowtie 2 (Langmead and Salzberg 2012) and BWA (Li and Durbin 2009), to map quality screened reads to assembled consensus or reference genomes. The agreement in SNP calling between the two aligners for E. coli samples is high for both programs at ∼95%. This indicates that the DNA amplified from microcolonies should not cause significant issues in the mapping process. When the same process was applied to the Streptococcus sp. and Enterococcus sp. samples, >90% of SNPs called by Bowtie 2 were also identified by BWA, whereas only 70%–80% of SNPs called by BWA were also identified by Bowtie 2. The lower agreement of SNPs called by BWA is likely due to quality of the data, which is lower for the Streptococcus sp. and Enterococcus sp. runs. To give the most conservative results, the following analyses are based on SNPs and indels found only by both aligners. Single-cell samples were not included because of low genome recovery.
Table 1.
Pairwise number of indels and SNPs for Streptococcus sp. and Enterococcus sp.
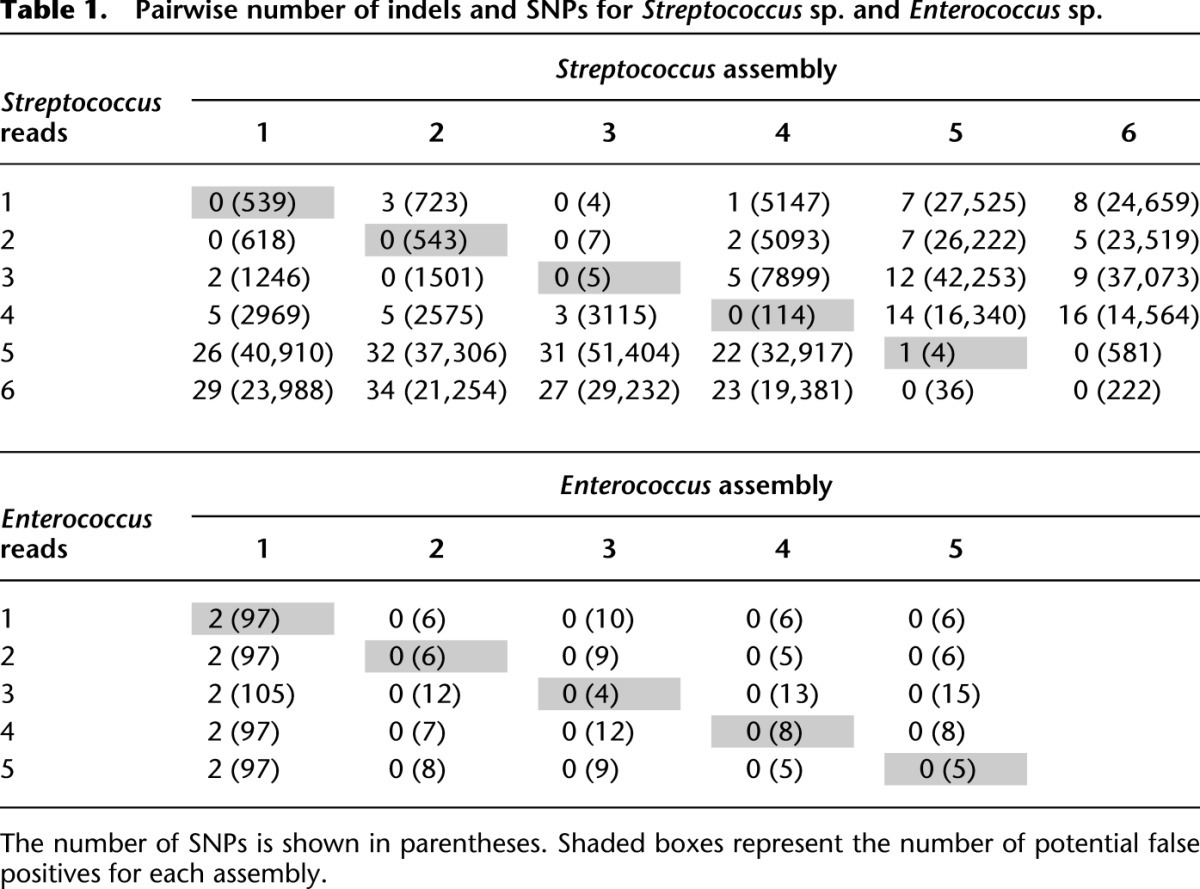
Generally, we found large numbers of SNPs and indels for Streptococcus sp., but relatively few for Enterococcus sp. The sample with the largest number of SNPs compared with the reference (Streptococcus sp. GMD-3 vs. GMD-5) differed at >2.5% of all nucleotides. Approximately 32% of SNPs are nonsynonymous compared with the reference and thus may be more likely to have a phenotypical consequence. Our results indicate that within a population having nearly identical 16S rDNA sequences (≤1% difference in original 16S rDNA screen) significant functional genetic diversity may be present. In an effort to quantify the rate of false positives, we also mapped reads from each sample to its respective assembly. This quantity varied significantly from sample to sample ranging from 0 to 2 indels and from 4 to 543 SNPs. Importantly, self-to-self mapping always yielded the fewest SNPs (except in two cases in which multiple samples appear to be nearly identical) and at most constitute 1.45% of the SNPs found in the most dissimilar genome. The larger number of false-positive SNPs in some samples is probably due to errors in the assembly caused by the quality of the data or also potentially due to DNA from other genotypes contained within the GMD. A low number of false positives may be expected in a perfect assembly due to paralogs and repeat regions within a genome, which make read mapping error prone.
Using a RAST annotation of the Streptococcus sp. GMD-5 assembly, we determined the gene identity and chromosomal location for every indel and SNP (Supplemental Data 1, 2). The density and location of all SNPs are shown in Figure 4. Since S. oralis is an opportunistic pathogen, we highlighted genes affecting virulence in Streptococcus pathogens containing nonsynonymous SNPs (Supplemental Table 4). A few notable genes from this list include IgA1 protease (cleaves human immunoglobulin A1), C5a peptidase (degrades neutrophil chemotaxin C5a), and Choline binding protein A (needed for host colonization). Across the five comparison genomes there appear to be at least three sizeable regions containing zero SNPs, which may indicate the presence of genes whose function is critical to survival of these bacteria (Region 1: 0.257–0.304 Mb; Region 2: 0.962–1.010 Mb; Region 3: 1.426–1.453 Mb). All genes located in these regions are listed in Supplemental Data 3.
Figure 4.

Location of SNPs within Streptococcus sp. genomes. SNPs for each GMD assembly were located by mapping reads to the concatenated Streptococcus sp. GMD-5 assembly. Contig order was determined by comparison to Streptococcus oralis reference Uo5. SNP density is measured using a sliding 1-kb window with 100-bp increments. The order of samples from outside in is Streptococcus sp. GMD-6, 4, 2, 1, 3, which is in order of least to most number of SNPs relative to the GMD-5 reference.
Evidence for homologous recombination can be seen in the distribution of SNPs within the genomes shown in Figure 4. Without recombination one would expect that all regions of a particular genome would be equally distinct from all regions in another genome. This is not the case for the Streptococcus sp. genomes and is readily observable in GMD-4 (second from outside in Fig. 4). A few examples include Region A: 0.145–0.258 Mb, Region B: 0.719–0.813 Mb, and Region C: 1.01–1.09 Mb. Although GMD-4 is generally very similar to the genomes showing numerous SNPs (GMD-2, 1, 3) in these regions, it appears much more closely related to the reference and GMD-6. There is a phage integrase present in region A and a phage lysin in region C, which may indicate that phage played a role in these homologous recombination events.
GMDs can culture all major bacterial gut phyla
To demonstrate the diversity of bacteria that can be cultured and thus sequenced using GMDs, we encapsulated a Nycodenz-extracted sample of bacteria from the same fecal sample used to cultivate the Enterococcus sp. microcolonies. These GMDs were incubated and sorted using the BD Influx Cell Sorter, then subjected to MDA, PCR, and sequencing of the 16S rDNA. Five hundred and fourteen samples showed good-quality 16S rDNA sequence data and grouped into 79 Operational Taxonomic Units (OTUs) at 97% sequence similarity. While most of these OTUs were classified as Enterococcus (43% of OTUs, 90% of sequences), we also uncovered notable diversity. The OTUs clustering at 90% sequence similarity are shown in a maximum likelihood phylogeny in Figure 5 and are listed in Supplemental Table 5. Importantly, we uncovered representatives from all major bacterial gut phyla: Firmicutes, Bacteriodetes, Proteobacteria, and Actinobacteria. Many of our samples show low similarity with sequenced genomes found in the NCBI genome database.
Figure 5.

Phylogeny of OTUs recovered from GMDs. GMDs occupied by a growing colony of bacteria extracted from feces were sorted for MDA. 16S rDNA was amplified and sequenced. The maximum likelihood tree below represents the diversity of 16S rDNA sequences binned into OTUs at 90% sequence similarity. Related sequences were included to show relationships. Support values are omitted for clarity.
Discussion
We have demonstrated a novel approach for fully sequencing genomes of microorganisms found in complex communities. Previously, this had been an unattainable goal because neither of two competing technologies, shotgun metagenomics or single-cell sequencing, can recover a nearly complete genome from a single organism in a diverse sample. We believe using GMDs to sequence entire genomes from metagenomic samples shows great promise and will allow for the first time a high-throughput technology for exploring community pan-genomics.
Our data convincingly demonstrate that sequencing from GMDs is superior to single-cell sequencing. For both Streptococcus sp. and Enterococcus sp., we have shown that GMD sequencing yields larger assemblies and contigs and results in nearly complete genome recovery. Numbers of contigs were brought down even further when adding additional long read PacBio data to that generated by Illumina HiSeq reads. While single cell reads covered ∼50% of a target genome, assembled single cell contigs were only 10% the size of the GMD assemblies, which in many cases is the relevant comparison. This discrepancy is likely due to the large amplification bias that occurs when starting with insufficient input DNA. The resulting variation in coverage makes assembly difficult even when using an assembly process that compensates for this. The reduction in bias can readily be observed in Figure 3.
MDA amplification from GMDs produced less contamination than the amplified single cell samples. Contamination, as measured by nontarget base pairs of assembled DNA, was less for both sets of GMD samples after removing a GMD that apparently contained an E. coli colony. Coencapsulation to some degree is unavoidable because encapsulation is a random Poisson process, but starting with a very low cell density can minimize this problem. We believe that since GMDs contain hundreds to thousands of cells, DNA from this colony likely overwhelms any potential contaminating DNA, which can present a problem in single-cell sequencing. However, some contamination did occur. For the Streptococcus sp. GMDs, a significant proportion of the contaminating DNA was of human origin. We cannot be sure whether the human contamination came from the donor or from the laboratory. However, since human contamination also appeared in Streptococcus sp. single cells, but not in either of the Enterococcus sp. sample types, we believe the contamination likely originated from the donor. Even with this contamination, however, nontarget DNA from GMDs was less than that found in the single-cell samples, which had a large proportion of template-independent product—a known by-product of MDA when starting with sparse initial template (Pan et al. 2008). Interestingly, no difference in levels of contamination were found for the E. coli GMDs and single cells. This may indicate that single-cell results can be highly variable in contamination levels, but rarely will contamination be a problem with GMD sequencing.
Since we assembled genomes without closely related references, it is difficult to be certain how close we came to complete genome recovery and whether we correctly classified contigs as contamination using BLAST. Based on our mapping data, assembly sizes, and recovery of all MLST loci, however, we believe we came very close to completion of all genomes derived from GMDs (Homan et al. 2002; Do et al. 2009). To demonstrate that the contigs removed via BLAST were correctly identified as contamination, we compared tetranucleotide frequencies of cleaned and uncleaned contigs. Supplemental Figure 1 demonstrates that the two approaches yielded very similar results and therefore supports our approach to contamination removal. The superiority of GMD sequencing compared with single-cell sequencing is bolstered by our E. coli results demonstrating the same trend when using a known organism with an available reference genome.
During the later course of the project, we used flow cytometry to demonstrate the feasibility of high-throughput sorting of GMDs as well as the diversity of species amenable to GMD cultivation. We successfully sorted, amplified, and screened hundreds of GMDs (Fig. 5) and showed that this technique can be used to culture all of the most common phyla of human gut bacteria (Firmicutes, Bacteriodetes, Proteobacteria, and Actinobacteria) (Eckburg et al. 2005). We did not perform a high-throughput screen on an oral sample, but this environment contains these same dominant phyla, thereby indicating that GMD cultivation should capture the relevant taxa in this environment as well (Dewhirst et al. 2010). Many of these 16S rDNA sequences show relatively low similarity to sequenced genomes and could therefore add considerably to our understanding of genomes within the human microbiome. This diversity was uncovered using an aerobic culturing approach with limited attempts to vary the culturing conditions. We believe that the recovered diversity may be increased substantially by more closely mimicking the conditions of the human gut in terms of nutrients, gases (especially lower oxygen levels), and texture. Another approach to increase diversity would be to limit the growth or recovery of the fastest and most prolific growers, such as Enterococcus spp.
GMDs offer a way to probe genomic diversity present within a natural population. In recent years the discovery of the pan-genome has radically changed our understanding of microbial genomes and of species (Tettelin et al. 2005; Hogg et al. 2007). It has become clear that individual isolates may differ substantially in their gene content, and sequencing one or a few strains provides only an incomplete understanding of the capabilities of microbial species. Most research on pan-genomes has involved sequencing pathogenic strains isolated from different individuals or environments over a long period of time. There is almost no published information on genomic diversity found within a natural population. This has been explored to some extent using shotgun metagenomics, but only short sequences can be attributed to individual strains with this method (Rusch et al. 2007; Simmons et al. 2008).
Our data show that bacteria recovered from a single human host containing the same 16S rDNA sequence can harbor very different genomes. Even with the large differences we uncovered among Streptococcus sp. isolates, we believe that our results actually underestimate the pan-genomic diversity of these samples. First, we were conservative as to which differences we chose to score. While it is tempting to focus on genes present in one sample and not another, and since we do not have closed circular genomes for comparison, we believe that such an analysis could lead to inaccurate conclusions. Very likely, some of these differences would be real, but without finished genomes it is difficult to make conclusive statements about missing genes. However, indels and SNPs are differences within a shared contiguous sequence, so we can have greater confidence that such differences are real. While our quantification of SNPs apparently suffers from a significant number of false positives in some cases (as measured by mapping a sample's reads to its own assembly), these numbers only constituted, at most, 1.45% of the SNPs in the most dissimilar genome. Another reason we may have underestimated genomic diversity in both the oral and gut environment is that prior to encapsulation we subjected the samples to overnight growth in rich media. This undoubtedly exerted selection against certain genotypes. In the future, studies of the pan-genome using GMDs should start with bacteria directly isolated from an environment rather than a culture. This is the approach we used when studying the diversity of gut bacteria amenable to GMD culture.
While a thorough discussion of genome differences is beyond the scope of this study, it is noteworthy that in our Streptococcus sp. samples, we found numerous mutations across the genome and within many genes linked to virulence in Streptococcus pathogens (Supplemental Table 4). These differences may be medically relevant because S. oralis is an opportunistic pathogen. Our results are consistent with the high amount of genetic diversity found in S. oralis in other studies both within and between hosts (Bek-Thomsen et al. 2008; Do et al. 2009). Compared with Streptococcus sp., however, Enterococcus sp. isolates showed almost no genomic variation. This may be an accurate reflection of genomic diversity found in the oral environment versus that of the gut. Potential explanations for this disparity include:
(1) The fecal environment is more competitive.
(2) Enterococcus sp. grows much faster compared with Streptococcus sp., and a slight genetic advantage could lead to a dominant population in a short time.
(3) The gut is a closed environment with less input of environmental strains due to the bottleneck imposed by stomach acidity.
(4) The capability of S. oralis to undergo natural transformation has contributed to increased genome diversity (Johnsborg et al. 2007).
However, our results may also be an artifact of the overnight growth in rich media discussed above, or may simply be limited to the two species we investigated. Another recent study of E. faecium strains uncovered substantial genomic variation, but these isolates originated from different individuals over several decades and are, thus, not directly comparable to our results (Palmer et al. 2012). It is interesting to consider the origin of this variation. Some researchers have found recombination to be a major driver of microbial genomic diversity (Eppley et al. 2007; Simmons et al. 2008). We also found what appear to be the telltale signs of recombination, but further research is needed to investigate the importance of homologous recombination to this species.
Our research has demonstrated that gel microdroplets may be used to produce very-high-quality draft genomes from complex microbiome samples. GMDs have the capacity to produce high-quality genomic data greatly exceeding that of single-cell sequencing and will be useful for producing reference genomes of a phylogenetically diverse group of bacteria. The use of GMDs may open the door to exciting new research on the inter- and intraspecies genomic variation found within natural systems. We believe this technique shows great promise in extending our understanding of microbial genomic diversity.
Methods
Preparation of human oral and fecal samples and E. coli culture
Oral samples were obtained from a collaborator (Dr. Jacques Izard, Forsyth Institute, Cambridge, MA) and included pooled upper left subgingival plaque and pooled lower right subgingival plaque samples. Samples were stored at −80°C, thawed, and vortexed briefly, and an aliquot was filtered using a 5-μm Supor syringe filter (Pall Life Sciences), stained with 0.5× SYBR Green I, and stored at 4°C in preparation for immediate flow sorting. Both oral and fecal samples were sent unaltered to LANL on dry ice for encapsulation.
A single fecal sample from an individual was obtained from a collaborator (Dr. Martin Blaser, NYU), stored at −80°C, and preprocessed prior to flow sorting using a Nycodenz purification procedure (Courtois et al. 2001). Briefly, ∼1 g of fecal material was placed in 10 mL of 1× PBS with 3-mm glass beads in a 50-mL conical centrifuge and vigorously vortexed for 3 min. Resultant material was centrifuged at 500g for 5 min in a swinging bucket ultracentrifuge and the supernatant was removed. The pellet was washed twice with 2 mL of PBS and pooled for a 12-mL volume. The slurry was split with a total of 6 mL of fecal slurry gently added, avoiding mixing, to the top of a 2-mL Nycodenz solution (NycoPrep Universal; Accurate Chemical) contained in a centrifuge tube, and centrifuged at 14,700g for 20 min at 4°C. Careful removal of the interface yielded a bacterial extract that was then pelleted by microcentrifugation at 14,000g for 5 min at 4°C and the supernatant was removed. Following an addition of 500 μL of PBS and 500 μL of absolute ethanol (Sigma Biotech Grade; Sigma-Aldrich), the cells were fixed overnight at −20°C in preparation for flow sorting.
For the experiments that generated GMDs used for whole-genome sequencing, bacterial cells were isolated by inoculating fecal or oral material directly into Brain Heart Infusion (BHI) broth for overnight culture at 37°C with shaking at 200 rpm. The following day, the culture was diluted 1:1000 in BHI and grown to OD600 < 0.5 under the same conditions. Following dilution, this suspension was used directly for encapsulation within gel microdroplets. To achieve a greater diversity of encapsulated bacteria and to demonstrate flow sorting of the GMDs, we also extracted bacteria directly from feces using a Nycodenz density gradient as described above. The only differences involved using a fixed-angle rotor and multiple extractions to reduce debris. In addition, after the final extraction, the cell solution was passed through a 20-μm filter, washed in BHI, and stored at 4°C until encapsulation. For the E. coli experiment, E. coli (ATCC 29425) was grown overnight in LB at 37°C with shaking at 200 rpm. The next morning the culture was diluted to an OD of 0.2, incubated for 2 h under the same conditions, and then used directly in the GMD production procedure described below.
GMD production and incubation
As with single-cell sequencing, all steps of GMD production and incubation need to be performed in a rigorously clean and contaminant-free environment. GMDs were produced by emulsifying oil and an aqueous phase containing cells and melted agarose, which was then chilled thereby capturing individual cells within hardened agarose spheres. After separating the aqueous from the oil phase, GMDs containing cells can be incubated in a manner identical to free cells due to the highly porous nature of the agarose. We created the emulsion using the CellSys 100 Microdrop Maker and the GMD growth assay protocol provided by One Cell Systems Inc. with minimal modification. Briefly, a 500-μL aliquot of CelGel Encapsulation Matrix was melted in a microwave and then placed for at least 3 min in a 37°C oven. Next, 25 μL of Pluronic F-68 Solution (MP Biomedicals) was added, and the solution was vortexed and placed for at least 3 min in a 40°C oven. One hundred microliters of the cells extracted above (adjusted to OD600 = 0.08 with media) was added to the solution, vortexed, and returned for at least 3 min to 40°C. A cell concentration of OD600 = 0.01 is recommended by One Cell Systems to minimize coencapsulation; however, we estimated that viable cells (as opposed to cellular debris) were only about one-eighth of the total particle count and adjusted accordingly. Coencapsulation to some degree is unavoidable because encapsulation is a random Poisson process, but it can be minimized by starting with a very low cell density. It should be noted that it may be helpful to get a more accurate cell count via flow cytometry in order to determine more precisely the correct starting concentration. This solution was added dropwise to 15 mL of the CelMix Emulsion Matrix (pre-warmed to 40°C in a glass scintillation vial), inverted several times, then connected to the CellSys 100 Microdrop Maker, which creates the emulsion using a rotating blade. Emulsification occurred by mixing first at 2100 rpm for 1 min at room temperature, then for 1 min in an ice bath, and a final 6 min at 800 rpm in the ice bath. The resulting emulsion was transferred to a 50-mL conical tube and broken by washing several times in BHI media (600g for 5 min). While the CellSys 100 Microdrop Maker produces a fairly narrow range of GMD sizes (typically ∼80% of the GMDs fall within the size range of 45–60 μm), the GMDs must be filtered through a 70-μm filter to remove very-large-sized particles that would impede flow cytometry and micromanipulation.
The washed solution of GMDs was incubated with shaking at 200 rpm for 3 h at 37°C for the fecal and E. coli samples, and overnight for the oral sample (∼16 h). Following incubation, samples were washed three times in the buffer HBSS to reduce the number of free cells, which can complicate sorting and micromanipulation. Free cells originate from dividing unencapsulated cells and from cells that escape from the GMDs during incubation. Washing included repeated slow speed centrifugation (200g for 2 min), which efficiently pellets the GMDs but not the cells. Samples were shipped overnight on wet ice to JCVI for micromanipulation, MDA, and 16S rDNA screening. GMDs for the diversity study were incubated for 2–4 h in BHI with and without fecal extract. While the cytographic results differed between these samples, the diversity and composition showed no clear trends so the results were combined into a single analysis.
Micromanipulation
GMD samples were stained with SYBR Green I and micromanipulated using techniques described previously (Chitsaz et al. 2011; Dupont et al. 2012). Briefly, we used an Olympus IX70 inverted microscope equipped with a TransferMan NK2 and CellTram Vario (Eppendorf) with sterile glass capillaries blunted to an I.D. of ∼50 μm. A 1-μL aliquot of a GMD sample was placed in 9 μL of a 0.5× dilution of SYBR Green I on a 24-well Teflon printed slide (Electron Microscopy Sciences). Using the micromanipulator, single GMDs were rinsed sequentially in three separate wells of the Teflon slide containing a modified TE buffer (10 mM Tris, 0.1 mM EDTA at pH 8.0), directly manipulated into 2 μL of the same buffer located at the bottom of a 0.2-mL PCR microcentrifuge tube, and frozen at −80°C.
Flow cytometry
Single cells were flow sorted at JCVI as described previously (Chitsaz et al. 2011; Dupont et al. 2012) with additional precautions taken to ensure safe flow sorting in the presence of potentially biohazardous microorganisms (Schmid et al. 2003). Briefly, a FACS (fluorescence activated cell sorting) Aria II flow sorter (BD) equipped with a 70-μm nozzle, an argon ion laser providing 100 mW at 488 nm, and a custom forward scatter photomultiplier tube (FSC-PMT) for high-sensitivity detection of microorganisms was used for sorting of single cells. The filter configuration for fluorescence detection comprised a 510-nm DCLP dichroic beam splitter and a 512/20-nm band pass barrier filter for detection of SYBR Green I. Single cells were detected by using biparametric histograms of forward light scatter versus fluorescence with log scaling. For each sample, a total count of 50,000 events was collected. Samples were sorted with the highest purity setting and a low flow rate of 200 events/second triggering on both side scatter (threshold value > 200) and green fluorescence (threshold > 500) concurrently. Single cells were sorted into 384-well plates containing 2 μL of modified TE (10 mM Tris, 0.1 mM EDTA at pH 8) and stored at −80°C prior to amplification.
GMDs for the diversity and E. coli studies were flow sorted at LANL. GMD staining was done with SYTO-9 (LIVE/DEAD BacLight Bacterial Viability and Counting Kit for Flow Cytometry; Life Technologies) and Vybrant Orange (Life Technologies) for the fecal diversity and E. coli studies, respectively. FACS analysis and targeted cell sorting were performed on the Influx cell sorter (BD) using a 488-nm laser with a 200-μm nozzle and a 530/40-nm band pass filter for SYTO-9 fluorescence detection. Pre-sterilized sheath fluid was used (25 mM HEPES with 100 mM sodium salt; BioSure). Fifty thousand data points per sample were collected for analysis using BD FACS Sortware sorter software (BD). Prior to sorting, calibration procedures were followed as per the manufacturer's protocol. Of importance, the Influx was calibrated to deposit targeted particles directly to the bottom center of each well in a 96-well plate, as verified by visual inspection. Gating of samples was done by selecting particles with both high side scatter as well as high fluorescence (both were log scaled). Data were analyzed in FloJo (Tree Star Inc.) and exported to R for figure generation and analysis (R Development Core Team 2011).
MDA, PCR, and 16S rDNA analysis
Single-cell amplifications were performed on the sorted single cells as previously described (Chitsaz et al. 2011; Dupont et al. 2012) with modifications being the 2-μL TE sorting volume and a total MDA reaction volume of 12.5 μL using the GenomiPhi HY Kit (GE Healthcare). Each frozen micromanipulated GMD was thawed on ice and placed in a thermocycler for 1 min at 65°C to melt the GMD and then briefly chilled on ice. A 2-μL volume (2500 units) of ReadyLyse (Epicentre) was added, and the reaction was incubated for 10 min at room temperature followed by addition of 1 μL of KOH lysis mix (645 mM KOH, 265 mM DTT, 2.65 mM EDTA at pH 8) and incubation for 10 min on ice. A 3.5-μL volume of neutralization mix (369 mM Tris-HCl at pH 4.5 in GenomiPhi Sample Buffer) was added, followed by 6 μL of Enzyme Mix (0.6 μL of 0.5 units of GE Phi29 polymerase and 5.4 μL of GenomiPhi Reaction Buffer). Incubation was performed on a thermocycler for 16 h at 30°C followed by a 10-min heat inactivation at 80°C and then held at 4°C. MDA reactions were diluted 20-fold, and subsequent PCR and 16S rDNA sequencing reactions were carried out as previously described (Chitsaz et al. 2011; Dupont et al. 2012).
Samples for the fecal diversity and E. coli experiments were amplified at LANL using the protocol described in Spits et al. (2006). All samples were PCR-amplified using bacterial universal primers (8F/1492R) (Edwards et al. 1989; Wilson et al. 1990) using AmpliTaq Gold PCR Master Mix (Life Technologies). Cycling conditions included denaturation for 2 min and 10 sec at 94°C, with 35 cycles of 1 min at 94°C, 45 sec at 56°C, and 90 sec at 72°C. A final extension step of 10 min at 72°C was included. Samples were kept at 4°C until further processing. PCR reactions were cleaned with NucleoFast 96 PCR plates using the manufacture's protocol (Machery-Nagel). Samples were sequenced on the ABI 3730xl capillary sequencing system using Big Dye Terminator v3.1 (ABI-Life Technologies). Sequencing reactions were cleaned using Agencourt CleanSeq beads following the manufacturer's protocol. Forward and reverse reads were assembled using a custom script. If they failed to assemble, the individual reads were not further analyzed. This strategy was meant to reduce or eliminate the analysis of GMDs containing more than a single colony. Using mothur (Schloss et al. 2009), we aligned the sequences against the Silva (Pruesse et al. 2007) alignment database and removed sequences containing more than a single ambiguous base and those that were abnormally short. The aligned reads were then clustered to 90% and 97% identity. Representative reads from each cluster were uploaded to RDP (Cole et al. 2007, 2009) and run through SeqMatch to generate closely related sequences to include in the phylogenetic analysis. All samples were again aligned using mothur and hand-curated in Mesquite v2.74 (Maddison and Maddison 2010). Finally, a maximum likelihood tree with 100 bootstrap replicates was generated using Garli v2.0 (Zwickl 2006) with model parameters determined in jModelTest (Guindon and Gascuel 2003; Posada 2008). A majority consensus tree was created in Mesquite and was rooted to Aquifex aeolicus.
Whole-genome sequencing and assembly
Illumina
All whole-genome sequencing was performed using the Illumina HiSeq2000 (for oral and fecal samples) or MiSeq (for E. coli DNA) system (Illumina). Standard Illumina libraries were made using the TruSeq DNA Library Prep Kit. Each sample included a unique Illumina index tag or barcode. Libraries were quantified using a qPCR kit specifically designed for Illumina libraries (KAPA Biosystems) on an ABI 9700 real-time PCR system (ABI-Life Technologies). Libraries were diluted to 2 nM and pooled in equal molar ratios. For both oral and fecal GMDs, we sequenced six GMDs and six single cells having nearly identical 16S rDNA sequences (≤1% sequence variation). For the oral isolates, this was a set of samples whose top BLAST hits were to S. oralis. For the fecal samples, all selected samples had 16S rDNA sequences showing a top BLAST hit to E. faecium. Streptococcus sp. and Enterococcus sp. samples were sequenced separately in single lanes. One Enterococcus sp. GMD sample failed during sequencing and was not included in any subsequent analysis. The sequencing configuration for both runs was a paired-end 100-cycle run resulting in 100-bp reads and 79% of all reads yielding an average quality score >30. Quality scores >30 correspond to 99.9% accuracy. The E. coli experiment was sequenced on MiSeq and was a paired-end 150-cycle run resulting in 150-bp reads and 85.6% of reads having an average quality score >30. A more detailed quality analysis showed that Streptococcus sp. and Enterococcus sp. samples contained more ambiguous bases and more reads with lower quality, which is consistent with previous observations of better data quality on the MiSeq platform. Prior to assembly, Streptococcus sp. results were reduced to ∼20.5 million reads in order to normalize the read number. Enterococcus sp. results were reduced to 17.3 million reads. E. coli results were normalized to 2 million reads. All samples were assembled using a single-cell optimized pipeline, which used the Velvet v1.0.0 (Zerbino and Birney 2008) assembler to perform de novo assembly. Using multiple k-mers, the assembly with the best N50 and total length of contigs was assembled with different coverage cutoff thresholds. The assembly with the largest contig was initially selected, and the unique contigs from all the other assemblies were combined with this initial set.
PacBio
Whole-genome amplified DNA from two different Streptococcus species, samples GMD-3 and GMD-5, and one Enterococcus sample, GMD-5, were sheared to a target size of 2 kb using Covaris clear MiniTubes processed in a Covaris E220 acoustical shearing system using a duty cycle of 20, intensity of 0.1, and 1000 cycles per burst for 60 sec for a total treatment of 15 cycles. Following DNA purification and concentration with Ampure XP beads, 1.0 μg of DNA was used as input for the 2-kb Library Preparation and Sequencing Procedure (2010-2011, Pacific Biosciences of California, Inc.) beginning with the Repair Ends step. Following library sizing and quantification with a Bioanalyzer (Agilent Technologies) and a Qubit fluorometer (Life Technologies), respectively, the libraries underwent sequencing primer annealing, polymerase binding, and dilution according to the PacBio Sample Preparation Calculator (Version 1.3.0.0). Streptococcus sp. GMD-3 was sequenced on two SMRT cells and Streptococcus sp. GMD-5 and Enterococcus GMD-5 were each sequenced on three SMRT cells with version 2.0 DNA sequencing kits and SMRT cells. All cells were sequenced with two 45-min sequencing movies. The data were combined from all SMRT cells per sample. PacBio data were assembled with the unassembled Illumina data using the Celera genome assembler (Myers et al. 2000). This assembly was then merged with the original Illumina-only assembly using phrap (Ewing and Green 1998; Ewing et al. 1998).
Analysis
Prior to further analysis, obvious contaminant contigs were removed from each assembly. This was done via BLAST (Altschul et al. 1990) and MEGAN (Huson et al. 2007). Contigs showing clear similarity to another organism (human or another gut bacterium) were removed as well as those contigs that showed no significant similarity to anything in the nt database. Contamination was then measured by summing the base pairs of contigs removed relative to total base pairs assembled. To judge completeness of a genome following sequencing, normalized reads were mapped to an assembly. This was done by aligning to the best GMD assemblies (Streptococcus sp. GMD-5 and Enterococcus sp. GMD-5) with BWA (v0.6.1) (Li and Durbin 2009) using default parameters. The average depth of coverage and percent genome recovery were calculated from alignment results using custom Perl scripts. To judge appropriateness of our contamination removal approach, we determined the tetranucleotide frequency in the clean and uncleaned samples. Using R we measured the frequency of each of the 256 tetranucleotides across all contigs in every assembly. With these data, we derived the first and second principal components of the tetranucleotide matrix.
Population variation was judged by mapping reads from each GMD sample to each GMD assembly using Bowtie 2 (Langmead and Salzberg 2012) and BWA (Li and Durbin 2009). Only SNPs and indels called by both aligners were considered as correct. All data were prescreened to remove low-quality reads with the following standards before mapping: (1) remove reads with ambiguous bases; (2) trim ends with quality <10; and (3) remove any reads with average base quality <20. The aligned results were piped to SAMtools (v0.1.18) (Li et al. 2009) for conversion of BWA output format to BAM format and to perform SNP and indel analysis. The SNP calls were filtered further by vcffilter.pl of SAMtools with the following criteria: (1) discard SNPs within the 3-bp flanking region around a potential indel; (2) minimum coverage of alternate bases is at least 60% of total coverage at a base; (3) discard SNPs covered by no read with a mapping quality higher than 60; (4) in any 10-bp window, if there are three or more SNPs, discard them all; (5) discard SNPs with consensus quality smaller than 10; (6) require minimum read depth of 10×; and (7) discard SNPs with strand bias P-value smaller than 0.0001. To determine the gene location of SNPs and indels, we annotated the genome using RAST (Aziz et al. 2008). From the RAST annotation, we also acquired data on the predicted number of protein-coding genes. To best estimate the order of contigs within the Streptococcus sp. genome, we aligned the contigs to the published S. oralis (NC_015291.1) genome and placed the contigs as similar to the reference as possible without breaking them (Delcher et al. 1999). SNP densities in Figure 4 were measured using a 1-kb window sliding at 100-bp intervals.
Statistical analyses and figure generation were performed in R (v2.14.1) (R Development Core Team 2011). t-tests were used to compare two populations if all assumptions were met. All tests were two-tailed. Equal variance was assumed if two populations passed a Bartlett Test of Homogeneity of Variance. Normality was tested using a Shapiro-Wilk test for normality. If a comparison failed, the normality test, a nonparametric test, the Mann-Whitney test was used in lieu of a t-test. For all Streptococcus sp. statistical tests, n = 12. For all Enterococcus sp. tests, n = 11 because there were only five GMD samples.
Data access
All assemblies have been uploaded to NCBI and are available with the accession numbers listed in Supplemental Table 6.
Acknowledgments
We acknowledge Dr. Jacques Izard (Forsyth Institute) and Dr. Martin Blaser (New York University) for providing the anonymized oral and fecal samples, respectively. We also thank George Weinstock for providing us with the Enterococcus faecium TX16 genome sequence. We thank the anonymous reviewers who provided suggestions that made the manuscript much stronger. Funding was provided by the Department of Energy Los Alamos National Laboratory LDRD program; Genome Sequencing Centers (GSC) award funded in whole or part with federal funds from the National Institute of Allergy and Infectious Diseases, National Institutes of Health; and Department of Health and Human Services under contract number HHSN272200900007C; HMP Project Award number U54 AI-084844-01 administered by the National Institute of Allergy and Infectious Diseases on behalf of the NIH Roadmap Human Microbiome Project; the National Human Research Institute grant NIH-2 R01 HG003647; and the Alfred P. Sloan Foundation.
Author contributions: M.S.F., A.E.K.D., C.S.H., P.S.C, J.C.D., and R.S.L. designed the experiments. M.S.F., A.E.K.D., M.N., J.L.Y., J.P.S., K.M., C.D.G., P.L.W., K.G.R., J.H., A.R.D., S.L.J., and B.P. performed the experiments. M.S.F., C.L., O.C., W.G., and K.W.D. analyzed the data. M.S.F., C.S.H., M.N., and R.S.L. wrote the manuscript.
Footnotes
[Supplemental material is available for this article.]
Article published online before print. Article, supplemental material, and publication date are at http://www.genome.org/cgi/doi/10.1101/gr.142208.112.
References
- Altschul SF, Gish W, Miller W, Myers EW, Lipman DJ 1990. Basic local alignment search tool. J Mol Biol 215: 403–410 [DOI] [PubMed] [Google Scholar]
- Amann RI, Ludwig W, Schleifer KH 1995. Pylogenetic identification and in situ detection of individual microbial cells without cultivation. Microbiol Rev 59: 143–169 [DOI] [PMC free article] [PubMed] [Google Scholar]
- Aziz RK, Bartels D, Best AA, DeJongh M, Disz T, Edwards RA, Formsma K, Gerdes S, Glass EM, Kubal M, et al. 2008. The RAST server: Rapid annotations using subsystems technology. BMC Genomics 9: 1–15 [DOI] [PMC free article] [PubMed] [Google Scholar]
- Bankevich A, Nurk S, Antipov D, Gurevich AA, Dvorkin M, Kulikov AS, Lesin VM, Nikolenko SI, Son P, Prjibelski AD, et al. 2012. SPAdes: A new genome assembly algorithm and its applications to single-cell sequencing. J Comput Biol 19: 455–477 [DOI] [PMC free article] [PubMed] [Google Scholar]
- Bek-Thomsen M, Tettelin H, Hance L, Nelson KE, Kilian M 2008. Population diversity and dynamics of Streptococcus mitis, Streptococcus oralis, and Streptococcus infantis in the upper respiratory tracts of adults, determined by a nonculture strategy. Infect Immun 76: 1889–1896 [DOI] [PMC free article] [PubMed] [Google Scholar]
- Chitsaz H, Yee-Greenbaum JL, Tesler G, Lombardo M-J, Dupont CL, Badger JH, Novotny M, Rusch DB, Fraser LJ, Gormley NA, et al. 2011. Efficient de novo assembly of single-cell bacterial genomes from short-read data sets. Nat Biotechnol 29: 915–921 [DOI] [PMC free article] [PubMed] [Google Scholar]
- Cole JR, Chai B, Farris RJ, Wang Q, Kulam-Syed-Mohideen AS, McGarrell DM, Bandela AM, Cardenas E, Garrity GM, Tiedje JM 2007. The ribosomal database project (RDP-II): Introducing myRDP space and quality controlled public data. Nucleic Acids Res 35: D169–D172 [DOI] [PMC free article] [PubMed] [Google Scholar]
- Cole JR, Wang Q, Cardenas E, Fish J, Chai B, Farris RJ, Kulam-Syed-Mohideen AS, McGarrell DM, Marsh T, Garrity GM, et al. 2009. The Ribosomal Database Project: Improved alignments and new tools for rRNA analysis. Nucleic Acids Res 37: D141–D145 [DOI] [PMC free article] [PubMed] [Google Scholar]
- Courtois S, Frostegard A, Goransson P, Depret G, Jeannin P, Simonet P 2001. Quantification of bacterial subgroups in soil: Comparison of DNA extracted directly from soil or from cells previously released by density gradient centrifugation. Environ Microbiol 3: 431–439 [DOI] [PubMed] [Google Scholar]
- Dean FB, Nelson JR, Giesler TL, Lasken RS 2001. Rapid amplification of plasmid and phage DNA using Phi29 DNA polymerase and multiply-primed rolling circle amplification. Genome Res 11: 1095–1099 [DOI] [PMC free article] [PubMed] [Google Scholar]
- Dean FB, Hosono S, Fang LH, Wu XH, Faruqi AF, Bray-Ward P, Sun ZY, Zong QL, Du YF, Du J, et al. 2002. Comprehensive human genome amplification using multiple displacement amplification. Proc Natl Acad Sci 99: 5261–5266 [DOI] [PMC free article] [PubMed] [Google Scholar]
- Delcher AL, Kasif S, Fleischmann RD, Peterson J, White O, Salzberg SL 1999. Alignment of whole genomes. Nucleic Acids Res 27: 2369–2376 [DOI] [PMC free article] [PubMed] [Google Scholar]
- Dewhirst FE, Chen T, Izard J, Paster BJ, Tanner ACR, Yu W-H, Lakshmanan A, Wade WG 2010. The human oral microbiome. J Bacteriol 192: 5002–5017 [DOI] [PMC free article] [PubMed] [Google Scholar]
- Dichosa AE, Fitzsimons MS, Lo CC, Weston LL, Preteska LG, Snook JP, Zhang X, Gu W, McMurry K, Green LD, et al. 2012. Artificial polyploidy improves bacterial single cell genome recovery. PLoS ONE 7: e37387. [DOI] [PMC free article] [PubMed] [Google Scholar]
- Do T, Jolley KA, Maiden MCJ, Gilbert SC, Clark D, Wade WG, Beighton D 2009. Population structure of Streptococcus oralis. Microbiology 155: 2593–2602 [DOI] [PMC free article] [PubMed] [Google Scholar]
- Dupont CL, Rusch DB, Yooseph S, Lombardo M-J, Richter RA, Valas R, Novotny M, Yee-Greenbaum J, Selengut JD, Haft DH, et al. 2012. Genomic insights to SAR86, an abundant and uncultivated marine bacterial lineage. ISME J 6: 1186–1199 [DOI] [PMC free article] [PubMed] [Google Scholar]
- Eckburg PB, Bik EM, Bernstein CN, Purdom E, Dethlefsen L, Sargent M, Gill SR, Nelson KE, Relman DA 2005. Diversity of the human intestinal microbial flora. Science 308: 1635–1638 [DOI] [PMC free article] [PubMed] [Google Scholar]
- Edwards U, Rogall T, Blocker H, Emde M, Bottger EC 1989. Isolation and direct complete nucleotide determination of entire genes—characterization of a gene coding for 16S-ribosomal RNA. Nucleic Acids Res 17: 7843–7853 [DOI] [PMC free article] [PubMed] [Google Scholar]
- Eppley JM, Tyson GW, Getz WM, Banfield JF 2007. Genetic exchange across a species boundary in the archaeal genus Ferroplasma. Genetics 177: 407–416 [DOI] [PMC free article] [PubMed] [Google Scholar]
- Ewing B, Green P 1998. Base-calling of automated sequencer traces using phred. II. Error probabilities. Genome Res 8: 186–194 [PubMed] [Google Scholar]
- Ewing B, Hillier L, Wendl MC, Green P 1998. Base-calling of automated sequencer traces using phred. I. Accuracy assessment. Genome Res 8: 175–185 [DOI] [PubMed] [Google Scholar]
- Guindon S, Gascuel O 2003. A simple, fast, and accurate algorithm to estimate large phylogenies by maximum likelihood. Syst Biol 52: 696–704 [DOI] [PubMed] [Google Scholar]
- Hess M, Sczyrba A, Egan R, Kim TW, Chokhawala H, Schroth G, Luo S, Clark DS, Chen F, Zhang T, et al. 2011. Metagenomic discovery of biomass-degrading genes and genomes from cow rumen. Science 331: 463–467 [DOI] [PubMed] [Google Scholar]
- Hogg JS, Hu FZ, Janto B, Boissy R, Hayes J, Keefe R, Post JC, Ehrlich GD 2007. Characterization and modeling of the Haemophilus influenzae core and supragenomes based on the complete genomic sequences of Rd and 12 clinical nontypeable strains. Genome Biol 8: R103. [DOI] [PMC free article] [PubMed] [Google Scholar]
- Homan WL, Tribe D, Poznanski S, Li M, Hogg G, Spalburg E, van Embden JDA, Willems RJL 2002. Multilocus sequence typing scheme for Enterococcus faecium. J Clin Microbiol 40: 1963–1971 [DOI] [PMC free article] [PubMed] [Google Scholar]
- Huson DH, Auch AF, Qi J, Schuster SC 2007. MEGAN analysis of metagenomic data. Genome Res 17: 377–386 [DOI] [PMC free article] [PubMed] [Google Scholar]
- Iverson V, Morris RM, Frazar CD, Berthiaume CT, Morales RL, Armbrust EV 2012. Untangling genomes from metagenomes: Revealing an uncultured class of marine euryarchaeota. Science 335: 587–590 [DOI] [PubMed] [Google Scholar]
- Johnsborg O, Eldholm V, Havarstein LS 2007. Natural genetic transformation: Prevalence, mechanisms and function. Res Microbiol 158: 767–778 [DOI] [PubMed] [Google Scholar]
- Langmead B, Salzberg SL 2012. Fast gapped-read alignment with Bowtie 2. Nat Methods 9: 357–359 [DOI] [PMC free article] [PubMed] [Google Scholar]
- Li H, Durbin R 2009. Fast and accurate short read alignment with Burrows-Wheeler transform. Bioinformatics 25: 1754–1760 [DOI] [PMC free article] [PubMed] [Google Scholar]
- Li H, Handsaker B, Wysoker A, Fennell T, Ruan J, Homer N, Marth G, Abecasis G, Durbin R, 1000 Genome Project Data Processing Subgroup 2009. The Sequence Alignment/Map format and SAMtools. Bioinformatics 25: 2078–2079 [DOI] [PMC free article] [PubMed] [Google Scholar]
- Maddison WP, Maddison DR 2010. Mesquite: A modular system for evolutionary analysis, Version 2.75. http://mesquiteproject.org
- Myers EW, Sutton GG, Delcher AL, Dew IM, Fasulo DP, Flanigan MJ, Kravitz SA, Mobarry CM, Reinert KHJ, Remington KA, et al. 2000. A whole-genome assembly of Drosophila. Science 287: 2196–2204 [DOI] [PubMed] [Google Scholar]
- Palmer KL, Godfrey P, Griggs A, Kos VN, Zucker J, Dejardins C, Cerqueira G, Gevers D, Walker S, Wortman J, et al. 2012. Comparative genomics of enterococci: Variation in Enterococcus faecalis, clade structure in E. faecium, and defining characteristics of E. gallinarum and E. casseliflavus. MBio 3: 1–11 [DOI] [PMC free article] [PubMed] [Google Scholar]
- Pan XH, Urban AE, Palejev D, Schulz V, Grubert F, Hu YP, Snyder M, Weissman SM 2008. A procedure for highly specific, sensitive, and unbiased whole-genome amplification. Proc Natl Acad Sci 105: 15499–15504 [DOI] [PMC free article] [PubMed] [Google Scholar]
- Posada D 2008. jModelTest: Phylogenetic model averaging. Mol Biol Evol 25: 1253–1256 [DOI] [PubMed] [Google Scholar]
- Pruesse E, Quast C, Knittel K, Fuchs BM, Ludwig WG, Peplies J, Glockner FO 2007. SILVA: A comprehensive online resource for quality checked and aligned ribosomal RNA sequence data compatible with ARB. Nucleic Acids Res 35: 7188–7196 [DOI] [PMC free article] [PubMed] [Google Scholar]
- R Development Core Team. 2011. R: A language and environment for statistical computing. R Foundation for Statistical Computing, Vienna. [Google Scholar]
- Raghunathan A, Ferguson HR, Bornarth CJ, Song WM, Driscoll M, Lasken RS 2005. Genomic DNA amplification from a single bacterium. Appl Environ Microbiol 71: 3342–3347 [DOI] [PMC free article] [PubMed] [Google Scholar]
- Rodrigue S, Malmstrom RR, Berlin AM, Birren BW, Henn MR, Chisholm SW 2009. Whole genome amplification and de novo assembly of single bacterial cells. PLoS ONE 4: e6864. [DOI] [PMC free article] [PubMed] [Google Scholar]
- Rusch DB, Halpern AL, Sutton G, Heidelberg KB, Williamson S, Yooseph S, Wu D, Eisen JA, Hoffman JM, Remington K, et al. 2007. The Sorcerer II Global Ocean Sampling expedition: Northwest Atlantic through Eastern Tropical Pacific. PLoS Biol 5: 398–431 [DOI] [PMC free article] [PubMed] [Google Scholar]
- Schloss PD, Westcott SL, Ryabin R, Hall JR, Hartmann M, Hollister EB, Lesniewski RA, Oakley BB, Parks DH, Robinson CJ, et al. 2009. Introducing mothur: Open-source, platform-independent, community-supported software for describing and comparing microbial communities. Appl Environ Microbiol 75: 7537–7541 [DOI] [PMC free article] [PubMed] [Google Scholar]
- Schmid I, Merlin S, Perfetto SP 2003. Biosafety concerns for shared flow cytometry core facilities. Cytometry A 56A: 113–119 [DOI] [PubMed] [Google Scholar]
- Simmons SL, DiBartolo G, Denef VJ, Goltsman DSA, Thelen MP, Banfield JF 2008. Population genomic analysis of strain variation in Leptospirillum group II bacteria involved in acid mine drainage formation. PLoS Biol 6: 1427–1442 [DOI] [PMC free article] [PubMed] [Google Scholar]
- Spits C, Le Caignec C, De Rycke M, Van Haute L, Van Steirteghem A, Liebaers I, Sermon K 2006. Whole-genome multiple displacement amplification from single cells. Nat Protoc 1: 1965–1970 [DOI] [PubMed] [Google Scholar]
- Teeling H, Meyerdierks A, Bauer M, Amann R, Glockner FO 2004. Application of tetranucleotide frequencies for the assignment of genomic fragments. Environ Microbiol 6: 938–947 [DOI] [PubMed] [Google Scholar]
- Tettelin H, Masignani V, Cieslewicz MJ, Donati C, Medini D, Ward NL, Angiuoli SV, Crabtree J, Jones AL, Durkin AS, et al. 2005. Genome analysis of multiple pathogenic isolates of Streptococcus agalactiae: Implications for the microbial “pan-genome.” Proc Natl Acad Sci 102: 13950–13955 [DOI] [PMC free article] [PubMed] [Google Scholar]
- Tyson GW, Chapman J, Hugenholtz P, Allen EE, Ram RJ, Richardson PM, Solovyev VV, Rubin EM, Rokhsar DS, Banfield JF 2004. Community structure and metabolism through reconstruction of microbial genomes from the environment. Nature 428: 37–43 [DOI] [PubMed] [Google Scholar]
- Venter JC, Remington K, Heidelberg JF, Halpern AL, Rusch D, Eisen JA, Wu DY, Paulsen I, Nelson KE, Nelson W, et al. 2004. Environmental genome shotgun sequencing of the Sargasso Sea. Science 304: 66–74 [DOI] [PubMed] [Google Scholar]
- West SA, Diggle SP, Buckling A, Gardner A, Griffins AS 2007. The social lives of microbes. Annu Rev Ecol Evol Syst 38: 53–77 [Google Scholar]
- Wilson KH, Blitchington RB, Greene RC 1990. Amplification of bacterial-16S ribosomal DNA with polymerase chain-reaction. J Clin Microbiol 28: 1942–1946 [DOI] [PMC free article] [PubMed] [Google Scholar]
- Woyke T, Xie G, Copeland A, Gonzalez JM, Han C, Kiss H, Saw JH, Senin P, Yang C, Chatterji S, et al. 2009. Assembling the marine metagenome, one cell at a time. PLoS ONE 4: 10. [DOI] [PMC free article] [PubMed] [Google Scholar]
- Woyke T, Tighe D, Mavromatis K, Clum A, Copeland A, Schackwitz W, Lapidus A, Wu DY, McCutcheon JP, McDonald BR, et al. 2010. One bacterial cell, one complete genome. PLoS ONE 5: e10314. [DOI] [PMC free article] [PubMed] [Google Scholar]
- Woyke T, Sczyrba A, Lee J, Rinke C, Tighe D, Clingenpeel S, Malmstrom R, Stepanauskas R, Cheng J-F 2011. Decontamination of MDA reagents for single cell whole genome amplification. PLoS ONE 6: e26161. [DOI] [PMC free article] [PubMed] [Google Scholar]
- Zengler K, Toledo G, Rappe M, Elkins J, Mathur EJ, Short JM, Keller M 2002. Cultivating the uncultured. Proc Natl Acad Sci 99: 15681–15686 [DOI] [PMC free article] [PubMed] [Google Scholar]
- Zerbino DR, Birney E 2008. Velvet: Algorithms for de novo short read assembly using de Bruijn graphs. Genome Res 18: 821–829 [DOI] [PMC free article] [PubMed] [Google Scholar]
- Zhang K, Martiny AC, Reppas NB, Barry KW, Malek J, Chisholm SW, Church GM 2006. Sequencing genomes from single cells by polymerase cloning. Nat Biotechnol 24: 680–686 [DOI] [PubMed] [Google Scholar]
- Zwickl DJ. 2006. “Genetic algorithm approaches for the phylogenetic analysis of large biological sequence data sets under the maximum likelihood criterion.” PhD thesis, The University of Texas at Austin, p. 125. [Google Scholar]