

Abstract
Objective
We describe an approach for modeling temporal relationships in a large scale association analysis of electronic health record data. The addition of temporal information can inform hypothesis generation and help to explain the relationships. We applied this approach on a dataset containing 41.2 million time-stamped International Classification of Diseases, Ninth Revision (ICD-9) codes from 1.6 million patients.
Methods
We performed two independent analyses including a pairwise association analysis using a χ2 test and a temporal analysis using a binomial test. Data were visualized using network diagrams and reviewed for clinical significance.
Results
We found nearly 400 000 highly associated pairs of ICD-9 codes with varying numbers of strong temporal associations ranging from ≥1 day to ≥10 years apart. Most of the findings were not considered clinically novel, although some, such as an association between Helicobacter pylori infection and diabetes, have recently been reported in the literature. The temporal analysis in our large cohort, however, revealed that diabetes usually preceded the diagnoses of H pylori, raising questions about possible cause and effect.
Discussion
Such analyses have significant limitations, some of which are due to known problems with ICD-9 codes and others to potentially incomplete data even at a health system level. Nevertheless, large scale association analyses with temporal modeling can help provide a mechanism for novel discovery in support of hypothesis generation.
Conclusions
Temporal relationships can provide an additional layer of meaning in identifying and interpreting clinical associations.
Keywords: Data Mining/methods; Electronic Health Records; International Classification of Diseases; Data Collection; Databases, Factual; Medical Records Systems, Computerized
Introduction
One of the most notable aspects of the ongoing adoption of electronic health records (EHRs) is the huge amount of clinical information entered by hundreds, or even thousands, of clinical care providers. By analyzing these large datasets it is possible to discover clinically relevant associations that may not have been noticed by individual clinicians but might become apparent only when data are aggregated on a broad scale.
Reports of clinical associations have appeared for decades, but only recently have these discoveries been derived from mining EHR data on a large scale. These studies have included various data sources such as International Classification of Diseases, Ninth Revision (ICD-9) codes, free text problems in a problem list, medications, and even data from clinical reports extracted via natural language processing.1–14
Background
Previously, we reported an association analysis that was conducted with 1.5 million free text ‘problems’ (ie, diagnoses) from 327 000 patients in an EHR.5 We demonstrated that the approach detected many well-known relationships but also revealed lesser known and potentially novel associations. A major limitation of this analysis was the lack of temporal information, which made it difficult to hypothesize about potential cause and effect. However, various data mining approaches have taken temporal relationships into account.7 15–20
In this study we report on an easily implementable approach that accounts for temporality among pairwise clinical associations. We describe our method and its application to a large dataset containing ICD-9 codes. With this approach we were able to delineate further details about some of our prior findings with the additional element of time included for interpretation. We also report on other findings and compare them to recent reports in the literature.
Methods
Empiric dataset
We utilized a de-identified dataset obtained from the University of Michigan Health System, encompassing all specialties, age groups, and patients seen in the hospital setting as well as multiple ambulatory outpatient clinics located in southeastern Michigan. The dataset can be viewed as triplets of a unique patient identifier (not tied to the medical record), an ICD-9 code, and a relative time stamp in units of days. This represented a snapshot of our entire health system and included all patients with an ICD-9 code over a span of two decades. The first recorded code of each patient was assigned time 0 with subsequent events defined as the number of days from that time. The dataset included approximately 41.2 million time-stamped ICD-9 codes from 1.62 million unique patients. The time span for events among patients ranged from a single day to 22 years. There were 14 499 distinct ICD-9 codes; a total of 991 codes appeared only once in the entire dataset, while the most frequently occurring code (‘acute respiratory infection, unspecified site’, ICD 465.9) appeared in 171 406 distinct patients. Our medical school's institutional review board reviewed and approved this study. Two independent analyses were conducted on this dataset: a pairwise association analysis and a temporal analysis.
Pairwise association analysis
We first conducted a pairwise association analysis among the codes in the dataset. The number of possible pairs among codes is (n2−n)/2, where n is the number of distinct codes, yielding 105.1 million combinations. However, to help us focus on what were likely to be the strongest associations and to reduce the number of results to a more reasonable amount, we first pruned the dataset by including only (1) codes that appeared in at least 30 patients; and (2) code pairs in which at least 10 patients shared the same two codes. These two steps eliminated 5898 distinct codes and 102.0 million (97%) comparisons. However, this still left 3.07 million unique pairwise associations for computation and removed only 495 patients from the analysis.
Associations were determined using a Pearson's χ2 test with Yates’ continuity correction on 2×2 contingency tables for each diagnosis pair. Each 2×2 table included the numbers of (i) ‘a’ patients who had occurrences of both code X and code Y, (ii) ‘b’ patients who had code X but not code Y, (iii) ‘c’ patients who had code Y but not code X; and (iv) ‘d’ patients who had neither code X nor code Y in their records. For each code pair we recorded the p value, χ2 statistic, and the OR (ie, (ad)/(bc)).
Since our goal was exploratory data analysis of diagnosis pairs rather than hypothesis testing, we did not identify a threshold for significance or correct for multiple hypothesis testing. Our goal was to identify associations of interest by ranking the evaluated pairs. In fact, it is likely that the most ‘significant’ code pairs are the more well-known associations, whereas the less significant associations might be better starting points for more in-depth clinical analysis. All statistical tests were conducted using R for OS X V.2.13.2.
Temporal analysis
In addition to computing the measures of association, we independently assessed the temporal direction of the association as follows. Given codes X and Y, for each patient record in which both codes appeared, we counted the number of times code X appeared before code Y, or vice versa, using only the initial instance of each code. Ties were not counted. The counts for each code pair were then compared using an exact binomial test in R with a hypothesized probability of success equal to 0.5. Direction was determined by the code that appeared first more often and the magnitude was represented by the p value resulting from the binomial test. In order to explore relationships across various time scales from the short to the long term, the temporal analysis was conducted using five time frames for differences between each code pair: (1) ≥1 day apart, (2) 1–30 days apart, (3) ≥1 year apart, (4) ≥5 years apart, and (5) ≥10 years apart. For example, in instance (4) only time differences that were 5 or more years apart between the first instances of two codes were considered; all time differences shorter than 5 years were considered ties and were not counted.
Data exploration
The final dataset was reviewed for clinically interesting associations in a manner comparable to our earlier work.5 Results were compared to those uncovered in our prior analysis as well as to other associations recently reported. Various approaches have been utilized for visualizing association and temporal data analyses to aid in discovery including network graphs, timelines, and even three-dimensional graphs.6 7 11 16 18 21 In the current study we visualized the results using network graphs to better understand potential interactions between multiple nodes. In these graphs a node represents an ICD-9 code and an edge represents a significant association between two codes. Arrows represent the temporal relationship with the arrowhead pointing to the lagged code. Node size, as seen in Figures 1–5, represents the log of the number of patients with that code in the dataset, and the node color is based on high-level ICD-9 categories of disease processes. All graphs were created with Cytoscape V.2.6.322 using a force-directed layout. A script was written to generate graphs that included nodes based on various inclusion/exclusion criteria. The χ2 statistic, OR, and p values were all used as thresholds to determine which nodes should be included. This allowed for variations in both the strength of the association and the strength of the temporal relationship.
Figure 1.

Network graph showing high-level view of significant associations, without accounting for temporal relationships, using a threshold for inclusion of χ2≥800.0 and OR≥200.0. This graph includes 6455 nodes and 28 362 edges. Clusters of similar colors (ICD-9 categories) can be seen here; 66.5% of all pairs in this figure are between nodes of the same color/category. ICD-9, International Classification of Diseases, Ninth Revision.
Figure 2.

(A) Network graph using the same criteria as in figure 1, but also including a temporal threshold for inclusion of p<1.0×10⁻³⁰ and a time range of ≥1 day apart between code pairs. This reduced network contains 877 nodes and 874 edges. (B) A subset of the graph from panel A showing 32 nodes and 46 edges. At this level of magnification it becomes possible to see the arrows pointing from the initial nodes to the subsequent (temporally) nodes. Directed edges here (and in future graphs) should be interpreted only individually, not as longer chains of cascades. For example, patients with nodes a and b are not necessarily the same patients who have nodes b and c.
Figure 3.

Subset of network graph using the same threshold for criteria as in figure 2 except with a time frame for events between two nodes set at ≥5 years apart. The entire graph contains 191 nodes and 177 edges. The view shown here contains 19 nodes and 21 edges. The names of nodes are shown as well as the ICD-9 code in parentheses. ICD-9, International Classification of Diseases, Ninth Revision.
Figure 4.
Subset of network graph using the same threshold for criteria as in figure 2 except with a time frame for events between two nodes set at 1–30 days apart. Thus, any relationship >30 days apart would be excluded. The entire graph contains 255 nodes and 203 edges. The view shown here contains nine nodes and five edges. The names of nodes are shown as well as the ICD-9 code in parentheses. ICD-9, International Classification of Diseases, Ninth Revision.
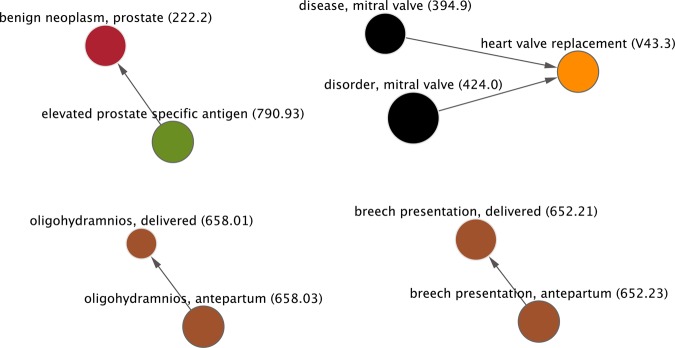
Figure 5.

Subset of network graph that was constructed using the following parameters for inclusion: χ2≥300, OR≥100, temporal relationship p value ≤1.0×10⁻²⁰, and time difference between codes is ≥10 years apart. The overall network contains 113 nodes and 100 edges. The portion shown here contains 19 nodes and 19 edges.
Results
Among the 3.07 million unique pairs in our final dataset, 397 717 pairs had a χ2 statistic ≥800, equivalent to an uncorrected p value of approximately 1.0×10−176. There were 28 373 pairs with an OR ≥200. With respect to the binomial test performed to determine temporal significance, and using a p value of ≤1.0×10⁻³⁰ as a threshold, there were 51 219 pairs using the ≥1 day apart relationship, 3032 pairs 1–30 days apart, 54 831pairs ≥1 year apart, 48 499 pairs ≥5 years apart, and 17 730 pairs ≥10 years apart. Figures 1–5 display network graphs constructed from the relationships uncovered in the analysis using various thresholds for inclusion. These comprise the strength of the pairwise association as well as the strength of the temporal relationships using several time ranges. High-resolution images, as well as interactive Cytoscape files containing the networks for figures 1–5, are available as an online supplement. Table 1 displays several interesting clinical associations, some of which are described below. Some of the associations were included in the table as a comparison to results from our previous study of clinical diagnoses in a free text problem list,5 whereas others were included because they have recently been reported in the literature and media. In all cases, ‘interesting’ is defined subjectively by the authors, although all of the associations reported in table 1 are thought to be poorly known or unknown in the medical community. Tables 2–4 display the top 10 associations basedon the χ2 statistic, OR, and temporal relationship p values, respectively.
Table 1.
Interesting clinical associations between pairs of ICD-9 codes
| Initial code (A)→subsequent code (B) | ||||||
|---|---|---|---|---|---|---|
| Time frame | Description (code A) | Description (code B) | Association χ2 | Association p value | Association OR | Temporal p value |
| c | Acquired hypothyroidism (244.9) | Herpes zoster without complication (053.9) | 4686.9 | <5×10−324 | 7.6 | 7.3×10⁻¹⁶ |
| d | Acquired hypothyroidism (244.9) | Herpes zoster without complication (053.9) | 4686.9 | <5×10−324 | 7.6 | 1.6×10⁻⁷ |
| a | Tricuspid insufficiency (397.0) | Tobacco use disorder (305.1) | 0.2 | 0.7 | 1.1 | 0.5 |
| a | Acute appendicitis (540.9) | Tobacco use disorder (305.1) | 266.4 | 6.9×10−60 | 3.2 | 1.4×10⁻¹⁰ |
| a | Tobacco use disorder (305.1) | Amyotrophic lateral sclerosis (335.20) | 1.6 | 0.2 | 0.7 | 0.5 |
| a | Depressive disorder (311) | Animal bite, including cats (E906.3) | 771.3 | 9.4×10−170 | 7.2 | 1.7×10⁻⁹ |
| b | Depressive disorder (311) | Animal bite, including cats (E906.3) | 771.3 | 9.4×10−170 | 7.2 | 2.3×10⁻⁸ |
| c | Depressive disorder (311) | Animal bite, including cats (E906.3) | 771.3 | 9.4×10−170 | 7.2 | 3.1×10⁻⁴ |
| a | Depressive disorder (311) | Dog bite (E906.0) | 170.2 | 6.7×10−39 | 2.7 | 0.88 |
| a | Diabetes, no complications (250.00) | Gastric ulcer, acute or chronic (531.90) | 1800.0 | <5×10−324 | 6.3 | 3.4×10⁻¹¹ |
| a | Diabetes, no complications (250.00) | Gastric ulcer, acute (531.3) | 1334.3 | 3.9×10−292 | 7.7 | 1.7×10⁻¹³ |
| a | Chronic gastric ulcer with perforation (531.6) | Diabetes, uncontrolled (250.02) | 110.9 | 6.4×10⁻²⁶ | 5.8 | 8.4×10⁻⁶ |
| a | Diabetes, uncontrolled (250.02) | Helicobacter pylori (041.86) | 303.3 | 6.4×10−68 | 7.5 | 0.01 |
| a | Diabetes mellitus (250) | H pylori (041.86) | 1378.3 | 1.0×10⁻²⁴ | 3.8 | 2.9×10⁻⁶ |
| a | Hyperlipidemia (272.4) | H pylori (041.86) | 941.7 | 8.6×10−207 | 7.2 | 1.2×10⁻⁷ |
| b | Hyperlipidemia (272.4) | H pylori (041.86) | 941.7 | 8.6×10−207 | 7.2 | 4.1×10⁻⁸ |
| c | Hyperlipidemia (272.4) | H pylori (041.86) | 941.7 | 8.6×10−207 | 7.2 | 9.9×10⁻⁸ |
| d | Hyperlipidemia (272.4) | H pylori (041.86) | 941.7 | 8.6×10−207 | 7.2 | 9.8×10⁻⁴ |
| a | Malignant neoplasm of bladder (188.9) | Diabetes, no complications (250.00) | 906.5 | 3.7×10−199 | 3.6 | 1.5×10⁻⁴ |
| a | Lumbago/low back pain (724.2) | Insomnia (780.52) | 35750.2 | <5×10−324 | 10.1 | 7.3×10−80 |
| a | Malignant neoplasm of colon (153.9) | Osteopenia (733.90) | 400.3 | 4.7×10−89 | 2.3 | 0.01 |
| a | Guillain-Barre syndrome (357.0) | Acute renal failure (584.9) | 300.3 | 2.9×10−67 | 5.6 | 0.1 |
| a | Guillain-Barre syndrome (357.0) | Chronic kidney disease (585.9) | 35.6 | 2.4×10⁻⁹ | 4.1 | 2.7×10⁻⁴ |
| a | Malignant neoplasm of esophagus (150.9) | Gastroesophageal reflux disease (530.81) | 500.0 | 9.3×10−111 | 2.8 | 0.02 |
| * | Henoch-Schonlein purpura (287.0) | Intussusception (560.0) | 962.4 | 2.7×10−211 | 33.7 | 1 |
| c | Agoraphobia with panic disorder (300.21) | Mammogram microcalcifications (793.81) | 87.4 | 8.8×10⁻²¹ | 4.5 | 5.2×10⁻⁴ |
All temporal relationships in the table are shown going from code A (earlier) to code B (later), except where otherwise noted. The associations presented here are intended to be starting points for exploratory data analysis, not confirmed associations from hypothesis testing.
Temporal relationship reported for (a) ≥1 day apart, (b) ≥1 year apart, (c) ≥5 years apart, and (d) ≥10 years apart.
*No temporal relationship existed.
ICD-9, International Classification of Diseases, Ninth Revision.
Table 2.
Top 10 ICD-9 code pairs based on the association χ2 statistic, with a time frame of ≥1 day apart
| Initial code (A)→subsequent code (B) | |||||
|---|---|---|---|---|---|
| Description (code A) | Description (code B) | Association χ2 | Association p value | Association OR | Temporal p value |
| Nodular lymphoma, intra-abdominal lymph nodes (202.03) | Nodular lymphoma, intrapelvic lymph nodes (202.06) | 1216635.9 | <5×10−324 | 152507.5 | 2.1×10⁻³ |
| Poisoning by antimalarial drugs (961.4) | Adverse effect of antimalarial drug (E931.4) | 1184098.3 | <5×10−324 | 364158.1 | 3.1×10⁻¹⁵ |
| Hodgkin's paragranuloma, intra-abdominal lymph nodes (201.03) | Hodgkin's paragranuloma, intrapelvic lymph nodes (201.06) | 1154416.3 | <5×10−324 | 694315.3 | 0.02 |
| Screening for malignant neoplasm of cervix (V76.2) | Routine gynecological exam (V72.31) | 1060924.6 | <5×10−324 | 945.9 | 4.9×10−324 |
| Hodgkin's paragranuloma, intrathoracic lymph nodes (201.02) | Hodgkin's paragranuloma, intrapelvic lymph nodes (201.06) | 1050856.0 | <5×10−324 | 291291.9 | 0.13 |
| Polio vaccination (V04.0) | Need for MMR vaccination (V06.4) | 987770.8 | <5×10−324 | 649.6 | 4.9×10−324 |
| Hodgkin's paragranuloma, intra-abdominal lymph nodes (201.03) | Hodgkin's paragranuloma, intrathoracic lymph nodes (201.02) | 965736.3 | <5×10−324 | 120966.3 | 1.0 |
| Kidney transplant (V42.0) | Complication of kidney transplant (996.81) | 927810.6 | <5×10−324 | 4385.3 | 3.9×10−154 |
| Supervision, other normal pregnancy (V22.1) | Routine postpartum follow-up (V24.2) | 916123.1 | <5×10−324 | 663.5 | 4.9×10−324 |
| Need for MMR vaccination (V06.4) | Need for varicella vaccination (V05.4) | 907463.5 | <5×10−324 | 444.3 | 4.9×10−324 |
ICD-9, International Classification of Diseases, Ninth Revision.
Table 3.
Top 10 ICD-9 code pairs based on the association OR, with a time frame of ≥1 day apart
| Initial code (A)→subsequent code (B) | |||||
|---|---|---|---|---|---|
| Description (code A) | Description (code B) | Association χ2 | Association p value | Association OR | Temporal p value |
| Malignant neoplasm of female breast (174.9) | Breast reconstruction following mastectomy (V51.0) | 2358.2 | <5×10−324 | Infinity* | 3.0×10⁻⁸ |
| Other malignant lymphoma (202.8) | Large cell lymphoma of head/face/neck (200.71) | 5418.1 | <5×10−324 | Infinity* | 5.5×10⁻¹⁰ |
| Essential hypertension (401.9) | Hypertensive heart and chronic kidney disease (404.11) | 626.4 | 3.02×10−138 | Infinity* | 3.62×10⁻⁷ |
| Cardiac dysrhythmia (427.9) | Anterior wall acute myocardial infarction (410.1) | 336.7 | 3.30×10−75 | Infinity* | 0.04 |
| Cardiac dysrhythmia (427.9) | Inferior wall acute myocardial infarction (410.4) | 436.0 | 7.98×10−97 | Infinity* | 2.6×10⁻³ |
| Primary cardiomyopathy (425.4) | Peripartum cardiomyopathy (674.5) | 2815.9 | <5×10−324 | Infinity* | 8.68×10⁻⁷ |
| History of malignant breast cancer (V10.3) | Breast reconstruction following mastectomy (V51.0) | 7044.4 | <5×10−324 | Infinity* | 1.86×10⁻⁹ |
| Hodgkin's paragranuloma, intra-abdominal lymph nodes (201.03) | Hodgkin's paragranuloma, intrapelvic lymph nodes (201.06) | 1154416.3 | <5×10−324 | 694315.3 | 0.02 |
| Drowning and nonfatal submersion (994.1) | Accidental drowning and submersion (E910.8) | 379000.0 | <5×10−324 | 518415.4 | 0.03 |
| Poisoning by antimalarial drugs (961.4) | Adverse effect of antimalarial drug (E931.4) | 1184098.3 | <5×10−324 | 364158.1 | 3.11×10⁻¹⁵ |
*This pair of codes only appeared together in each patient in which they were listed.
ICD-9, International Classification of Diseases, Ninth Revision.
Table 4.
Top 10 ICD-9 code pairs based on temporal p value (≥1 day apart)
| Initial code (A)→subsequent code (B) | |||||
|---|---|---|---|---|---|
| Description (code A) | Description (code B) | Association χ2 | Association p value | Association OR | Temporal p value |
| Previous c-section, antepartum (654.23) | Previous c-section, delivered (654.21) | 643843.5 | <5×10−324 | 2281.5 | <5×10−324 |
| Bladder cancer (188.9) | History of bladder cancer (V10.51) | 554337.8 | <5×10−324 | 6004.6 | <5×10−324 |
| Normal delivery (650) | Delivery of single liveborn (V27.0) | 551713.8 | <5×10−324 | 253.9 | <5×10−324 |
| Unspecified breast disorder (611.9) | Screening for unspecified condition (V82.9) | 443371.9 | <5×10−324 | 442.1 | <5×10−324 |
| Second degree perineal laceration, delivered (664.11) | Routine postpartum follow-up (V24.2) | 388083.8 | <5×10−324 | 330.8 | <5×10−324 |
| Unspecified neoplasm of eyelid (173.1) | Unspecified disorder of eyelid (374.89) | 385374.2 | <5×10−324 | 1074.2 | <5×10−324 |
| Malignant neoplasm of female breast (174.9) | History of malignant breast cancer (V10.3) | 375502.6 | <5×10−324 | 549.9 | <5×10−324 |
| Allergic rhinitis due to pollen (477.0) | Allergic rhinitis due to animal hair (477.2) | 368401.3 | <5×10−324 | 705.2 | <5×10−324 |
| Chronic kidney disease (585) | Complication of kidney transplant (996.81) | 367000.7 | <5×10−324 | 554.1 | <5×10−324 |
| Symptoms associated with female genital organs (625.8) | Abnormal pap smear and cervical human papillomavirus (795.0) | 287914.0 | <5×10−324 | 202.3 | <5×10−324 |
ICD-9, International Classification of Diseases, Ninth Revision.
Figure 6 demonstrates the temporal nature of the data with a timeline visualization of three codes with respect to chronic fatigue syndrome (CFS, ICD 780.71). In this example, the temporal associations are determined using the ≥1 day apart threshold, which is any code not falling on the solid vertical line, and the ≥5 years apart threshold, which includes any code that falls beyond the dashed vertical lines. For the ≥1 day range, intracranial injury (ICD 854.01) predominantly precedes CFS (p=2.82×10⁻²⁰), whereas dysphagia (ICD 787.20) predominantly follows CFS (p=6.84×10⁻¹⁹). Voice and resonance disorder (ICD 784.49) does not demonstrate any notable temporal relationship to CFS (p=0.21). For the ≥5 year date range, 48 patients had an intracranial injury that preceded CFS by 5 or more years but none had an intracranial injury that followed CFS by 5 or more years (p=7.10×10⁻¹⁵). Likewise, 69 cases of dysphagia occurred ≥5 years after the diagnosis of CFS but no cases preceded CFS by ≥5 years (p=3.39×10⁻²¹). Voice and resonance disorders still showed no significant temporal relationship, with 35 patients having been diagnosed with CFS 5 or more years before the voice disorder and 37 patients being diagnosed with the voice disorder 5 or more years before the CFS (p=0.91). The ‘traditional’ association analysis had shown that, among these four codes, CFS was most strongly associated with the voice disorders (χ2=887.4, p=5.27×10−195), followed by dysphagia (χ2=748.0, p=1.09×10−164), and then intracranial injuries (χ2=29.7, p=4.96×10⁻⁸).
Figure 6.

Timeline visualization of three codes with respect to chronic fatigue syndrome (ICD 780.71). Time zero (solid vertical line) represents the occurrence of code 780.71, and each dot represents a single patient's first occurrence of one of the other three codes with respect to 780.71. The dashed vertical lines represent the 5-year time window for longer term temporal associations. Any dot that falls within the dashed lines would not be counted for the ≥5-year interval, although it would be considered for the ≥1-day interval as long as it did not fall exactly on time zero.
In our prior analysis of free text problems, we found an association between shingles (ie, herpes zoster reactivation) and hypothyroidism. In the current analysis, we also found several similar associations including a temporal component with hypothyroidism preceding the shingles, the strongest of which is reported in table 1, row 1. The association was strongest with a minimum 5-year interval between the codes, meaning that the onset of the hypothyroidism preceded the shingles by at least 5 years. The temporal association was still present with a 10-year interval but was not as strong (table 1, row 2).
We compared a subset of the results from our previous analysis of free text diagnoses in a problem list5 to the associations uncovered in the current analysis. Unlike our previous findings, we could not find a strong association between tricuspid insufficiency (ICD 397.0) and ‘tobacco use disorder’ (ICD 305.1) (table 1). Additionally, we could not find an association between tricuspid insufficiency and ‘personal history of tobacco use’ (ICD V15.81). We did still find an association between smoking and acute appendicitis, but when temporality was taken into account over a period of 5 or more years, the appendicitis diagnoses preceded the smoking diagnoses by a factor of 5-to-1. Similarly, amyotrophic lateral sclerosis (ICD 335.20) was not significantly associated with smoking, contrary to what we had found previously.
We previously reported an intriguing association between cat bites and depression. At the time it was unclear how this finding might be explained, since temporal information was lacking (eg, perhaps people become depressed when bitten by their cats). There is no specific ICD code for cat bite, but ICD E906.3, used for various animal bites but not dog bites, is typically used. In the current analysis there was a very strong association between depression (ICD 311) and animal bites (ICD E906.3), with a significant temporal relationship noted where the depression preceded the bite with time frames of ≥1 day, ≥1 year, and ≥5 years apart. In comparison, a specific ICD code does exist for dog bites (ICD E906.0). An association was found between dog bites and depression, but the association was much weaker and there was no statistically significant temporal relationship between the two.
The raw numbers for the potential cat bite/depression association show that there were 68 718 patients with depression and 800 patients with animal bites; 193 (24.1%) of those with an animal bite also had depression, whereas the prevalence of major depressive disorder in the adult US population is 6.7%.23 Among the 193 patients, 137 (71.0%) had a diagnosis of depression before a diagnosis of the animal bite, 54 had the animal bite diagnosis preceding the depression diagnosis, and two patients had both diagnoses added on the same day. Ten (5.2%) of these patients had at least one suicide attempt as recorded using ICD code E950.X (X represents any of the sub-codes including E950.1, E950.2, etc). Of these 10 patients with a suicide attempt, three had an animal bite which preceded both the depression and the suicide attempt.
Recent reports have suggested an association between gastric ulcers caused by H pylori and insulin resistance,24 a precursor to diabetes, and elevated hemoglobin A1c levels,25 a marker of diabetes, and it has been suggested that preventing this infection may prevent the onset of diabetes.26 There is no specific ICD code for elevated A1c, but there are codes for diabetes. In our dataset we found an association between gastric ulcers and diabetes; however, the temporal relationships did not support the causality. The two most strongly associated pairs were for acute ulcers which predominantly showed diabetes preceding the ulcers (table 1, rows 10 and 11). Among the 27 code pairs of diabetes (ICD 250.X) and chronic gastric ulcers (ICD 531.4–531.7), most were in the direction of diabetes→ulcer with the exception of one somewhat weak association showing the reverse direction (table 1, row 12). Furthermore, among the seven associations specifically between H pylori (ICD 041.86) and diabetes (250.X), all were either insignificantly temporally associated or significant only from diabetes→H pylori.
There were 757 associations in our final dataset related to H pylori. Among the top associations, nearly all were for gastric related issues which is what one would expect. One association stood out, however, as being clinically different from the rest: hyperlipidemia, ranked 22 in terms of strength of the association and 28 in terms of strength of the temporality, with the direction pointing from hyperlipidemia→H pylori. This relationship was present even over a 10-year span (table 1, rows 15–18). Indeed, there have been recent reports of this association, but they seem to suggest that the eradication of H pylori may lead to hyperlipdemia.27 28
Another recently reported association is that between diabetes and bladder cancer with the suggestion that diabetes may predispose individuals to develop bladder cancer.29 In our analysis we did find a strong association between the two (table 1, row 19), but the majority of cases were those in which the bladder cancer was diagnosed before the diabetes. Other interesting associations are also shown in table 1.
Discussion
In this empirical study we have shown the feasibility of performing an association analysis with temporality taken into account using a large dataset obtained from an EHR. By varying the time scales for the temporal relationships, we observed both long term and short term associations. Such non-hypothesis driven approaches have been criticized in the past for lacking reliable and significant findings.30 31 However, these approaches can be a first step toward revealing novel relationships among data that are captured as a part of routine clinical operations that may only become evident when aggregated over large numbers of patients. Further, while not hypothesis driven, these findings can be used to help generate hypotheses that might warrant further exploration or testing using controlled studies.
With such a large and varied dataset it may be difficult to assign true ‘significance’ to an association and p values should be interpreted with caution. However, we used these values simply as filtering parameters to reduce the data so that they could reasonably be explored. More important is the assignment of ‘clinical significance’ or ‘novelty’ to an association. This remains an ongoing challenge. It is clear from the data presented in tables 2–4 that those associations with the highest rankings are not of great value for novel discovery, and it will be necessary to explore ‘weaker’ associations if the goal is to find something new. Sophisticated approaches have been developed to detect novel relationships that might be missed with traditional association analyses,32 and automated measures of ‘interest’ have also been applied.13 33 However, even these approaches would still likely suffer from an inability to automatically separate the many clinically known associations from those that are still unknown without using an external data source for comparison. Prior studies have linked clinical data with external sources including MEDLINE and Wikipedia, suggesting that this approach might add valuable information.3 6
Many related codes tended to be clustered together such as 250.1, 250.2, and 250.3, and the sometimes small differences between them may not be important for this type of analysis. One option to simplify the search space would be to collapse the codes based on the simple hierarchy within ICD-9. Thus these codes might be combined as simply 250.X. Collapsing data to simplify analyses of network diagrams has been done before,6 and various approaches have been used for clustering ICD codes into higher-level categories, including the use of software provided by the Agency for Healthcare Research and Quality.34–36 A challenge to this approach with ICD codes, however, is that some codes themselves actually include temporal concepts such as ‘initial episode’ and ‘subsequent encounter,’ or ‘acute’ and ‘chronic.’ As is often the case, interpreting results still requires thoughtful consideration, regardless of a p value or OR.
The association between animal bites (presumably primarily cat bites) and depression remains interesting. This association was reported in our prior analysis of free text problems where cat bites were specifically mentioned, and this appears to be corroborated in our current dataset. Examination of the temporal information suggests that depression often precedes the animal bite. This may be plausible if cats tend to bite their owners when ignored, which is just what might happen to someone in a dysthymic state due to depression. Even more important is what might be done with this knowledge in terms of screening. For example, it may be prudent for healthcare providers to inquire about depression in patients who present with an animal/cat bite, as this may be a marker for depression that might otherwise be missed.
Our approach has limitations, but also raises important considerations for future work. First, while we included a large number of patients and observations, the level of detail for each patient was sparse. ICD-9 codes can hardly be considered representative of an entire patient, as they are primarily created for billing/reimbursement, not clinical care. As a result, some diagnoses that might be entered into a clinical problem list might not end up being billed as an ICD-9 code if other more reimbursable diagnoses were also present, and this might explain why some associations we previously found with a free text problem list were not also present in our larger dataset using billing codes. The addition of other time-stamped data from the EHR such as medications and procedures could also add value,13 as this can provide patient-level clinical details that are not present in administrative datasets.37 One study even linked clinical phenotypic data from questionnaires to patients’ genomes.10 Demographic data including race, gender, and age could also be useful.38
It is well known that ICD-9 codes can be inaccurate and do not necessarily represent a patient's true diagnoses. This inaccuracy includes diabetes ICD-9 codes,39 and our results related to diabetes should be interpreted in that context. Additionally, ICD-9 codes often are not specific and some diagnoses that we had previously analyzed with our free text problem list could not reasonably be re-checked using the ICD-9 codes. Examples include granuloma annulare which can be included under ICD 695.89, a code for non-specific erythematous skin conditions, and primary sclerosing cholangitis which has a non-specific ICD code of 576.1 but which also includes other conditions involving inflammation of the bile ducts. Likewise, while a specific code for dog bites exists, there is not a similar code for cat bites, making interpretation of our findings limited. The granularity issue may be alleviated once the US switches from ICD-9 to ICD-10 in the coming years. However, this change will introduce its own complexity and computational challenges with the 150 000 or more codes resulting in nearly 12 billion possible pairwise comparisons. Our health system recently switched from a free text to a coded problem list, so in a few years we may have collected enough data for a similar analysis using a coded, clinically-oriented problem list instead. But limitations will continue to persist due to differences in what clinicians think is relevant for inclusion in a problem list40 and issues of data completeness.41 42
The first instance of a time-stamped code appearing in the medical record does not necessarily imply that the underlying event/diagnosis initially occurred at that time. At large tertiary care centers such as ours, many patients arrive with a pre-existing diagnosis or initial clinical presentation occurring elsewhere. Thus, even though we did not find a strong temporal relationship between diabetes and bladder cancer, it may be because many patients first come to our health system through the cancer center for further treatment after being diagnosed with bladder cancer elsewhere. As a result, the bladder cancer would likely be coded before other secondary diagnoses such as diabetes. In this particular relationship the causality may also be due to certain medications rather than the diabetes itself,43 but we did not include medications in our analysis. Nevertheless, that many health systems lack a ‘complete picture’ of all their patients is well known, and health information exchanges may play a role in resolving this issue.44
Our analysis included all patients in our health system with ICD codes and thus is not subject to bias as a result of including only a sample of the population. However, it still only represents the experiences, and potential coding irregularities, of a single institution. What we found may not be corroborated by the findings of others, or vice versa. The following is a case in point: a recent report of clinical associations found that Kawasaki disease (ICD 446.1) was associated with autism (ICD 299.0),6 but we did not find a similar association among our large set of patients. In our set there were 736 patients with Kawasaki disease and 3275 patients with autism (ICD codes 299.0, 299.00, 299.01); only four patients had both conditions (χ2 p=0.10). Given that the prevalence of autism has been reported to be approximately 1.1%,45 the number of patients with Kawasaki disease who also had autism is actually less than we might expect by chance. Association analyses may become more powerful and reliable as data from multiple institutions are included, potentially as part of the envisioned ‘learning health system’ in which such data might flow freely for discovery.46
Furthermore, including all patients in the analyses without dividing the population across clinically logical segments could also have influenced our findings. For example, prostate cancer only occurs in males, but the baseline population from which we constructed our 2×2 tables was presumably about half female, and also included many thousands of children. Similar sub-analyses could include patients from only one clinic at a time, since it may become easier to identify significant associations by grouping them according to clinic attendance or even distinguishing those who came locally from within the state or those who came via referrals for treatment of a rare disease. It also is important to note that even rich EHR data may not include important confounders that could impact the meaningful interpretation of findings.38 For example, the conclusions about animal bites should be interpreted in the context of the prevalence of animal ownership in the overall study population.
Even though two codes may be strongly associated and temporally correlated, these relationships still do not prove causation. In many cases one may simply precede the other as patients age. Figure 5 shows strong associations between two codes over a 10-year period, including myopia (ICD 367.1)→astigmatism (ICD 367.20). An association between myopia and astigmatism is known,47 and in at least one study of children it was shown that astigmatism often preceded myopia.48 However, our dataset does not contain the age of the patients so we are unable to report on age-dependent differences regarding the development of these two conditions. Similarly, in table 2, polio vaccination (ICD V04.0) preceded MMR vaccination (ICD V06.4). Since the polio vaccine is first given at age 2 months whereas MMR is not given until 12 months, such a temporal relationship is expected.
The network graphs themselves should be interpreted with caution. Because only pairwise associations were calculated, any network with more than two interconnected nodes may represent an agglomeration of multiple patients with non-overlapping issues. Thus, even though the pattern A→B→C may be observed, it is possible that patients with pattern A→B are not the same patients who have pattern B→C (figure 1B). Approaches do exist that consider these longer episodes among a group of patients.20
It is also important to understand how codes might be used over time. Figure 5 shows supervision of a normal pregnancy (ICD V22.1) preceding a labor and delivery code for advanced maternal age (ICD 659.63) by 10 years or more. Clearly, these were not the same pregnancies. This spurious association demonstrates that care must always be taken in interpreting the results. It is possible that some of our associations were actually found in a mix of children and elderly patients, two populations that can sometimes have higher rates of similar diagnoses, ranging, for example, from pneumococcal bacterial infections to fractures. While we do not know of such spurious associations occurring in our dataset, it remains possible without knowing other details about the patients such as their age. The ‘Yule-Simpson paradox’, in which conclusions made from population-level aggregated data can conflict with conclusions made from the same data analyzed separately as sub-populations, is an important methodological consideration that our broadly collected dataset is not adequate to address.49
Other temporal relationships observed were likely due to coding changes. For example, a very strong association was found between ‘gynecological examination’ (ICD V72.3) and ‘routine gynecological examination’ (ICD V72.31), and the temporal relationship was from V72.3→V72.31 (p<5×10−324). This is almost certainly due to the fact that in the year 2005 code V72.3 was expanded into sub-codes and was thus replaced by V72.31 for routine exams.50
To further explore the relationship between the results from the separate analyses we conducted, we constructed an empirical q-q plot (available as an online supplement) comparing the ordinal quartiles of p values of our temporal associations against the standard pairwise associations. This confirmed that the top temporal associations captured qualitatively different information than the top standard associations. In particular, the temporal associations further ‘scatter’ and rank order the highly significant pairwise associations. Thus, the top significant temporal associations are predictive of the pairwise associations but not vice versa. Therefore one application of our methodology is as an approach to further prune the space of initially discovered associations to take into account temporal information. Finally, we performed a Kolmogorov-Smirnov test and confirmed the rejection of the null hypothesis that the temporal association quartiles and standard association quartiles are drawn from the same distribution.
Conclusion
Despite the limitations, we believe that the approach presented here could provide benefit to those trying to elucidate novel associations from EHR data and could lead to new discoveries or additional confirmatory research. Furthermore, incorporating non-EHR data would represent yet another step towards large scale phenome-wide association studies (PheWAS).51
Our goal in this paper has been to present an exploratory data analysis technique for extracting temporal associations with applications to massive volumes of data in EHR. We have demonstrated that including temporal constraints in a traditional association analysis can reveal patterns of potential interest. Our technique could potentially be utilized in a hypothesis testing framework by incorporating reference populations that control for underlying variables, by separating causation structures from mere temporal sequentiality, by designing new information-theoretic criteria that separate novel patterns from ‘expected’ patterns, and by setting controls for multiple hypothesis testing (eg, using q values). Designing such a comprehensive framework is an object of future study.
Supplementary Material
Acknowledgments
We thank the members of the University of Michigan Center for Statistical Consultation and Research for the input provided on this project, especially Ken Guire and Kerby Shedden. We also thank Amitava Shee for his help in optimizing our algorithms.
Footnotes
Contributors: DAH designed and planned the study. DAH and NR performed the analyses, and wrote and approved the manuscript.
Competing interests: None.
Provenance and peer review: Not commissioned; externally peer reviewed.
Data sharing statement: Our fully calculated dataset is available upon request. We are currently working with our medical school to investigate the feasibility of releasing the original dataset for other investigators under a data use agreement.
References
- 1.Cao H, Hripcsak G, Markatou M. A statistical methodology for analyzing co-occurrence data from a large sample. J Biomed Inform 2007;40:343–52 [DOI] [PMC free article] [PubMed] [Google Scholar]
- 2.Cao H, Markatou M, Melton GB, et al. Mining a clinical data warehouse to discover disease-finding associations using co-occurrence statistics. AMIA Annu Symp Proc 2005:106–10 [PMC free article] [PubMed] [Google Scholar]
- 3.Chen ES, Hripcsak G, Xu H, et al. Automated acquisition of disease drug knowledge from biomedical and clinical documents: an initial study. J Am Med Inform Assoc 2008;15:87–98 [DOI] [PMC free article] [PubMed] [Google Scholar]
- 4.Doddi S, Marathe A, Ravi SS, et al. Discovery of association rules in medical data. Med Inform Internet Med 2001;26:25–33 [PubMed] [Google Scholar]
- 5.Hanauer DA, Rhodes DR, Chinnaiyan AM. Exploring clinical associations using ‘-omics’ based enrichment analyses. PLoS One 2009;4:e5203. [DOI] [PMC free article] [PubMed] [Google Scholar]
- 6.Holmes AB, Hawson A, Liu F, et al. Discovering disease associations by integrating electronic clinical data and medical literature. PLoS One 2011;6:e21132. [DOI] [PMC free article] [PubMed] [Google Scholar]
- 7.Hripcsak G, Albers DJ, Perotte A. Exploiting time in electronic health record correlations. J Am Med Inform Assoc 2011;18(Suppl 1):i109–15 [DOI] [PMC free article] [PubMed] [Google Scholar]
- 8.Mullins IM, Siadaty MS, Lyman J, et al. Data mining and clinical data repositories: insights from a 667,000 patient data set. Comput Biol Med 2006;36:1351–77 [DOI] [PubMed] [Google Scholar]
- 9.Prather JC, Lobach DF, Goodwin LK, et al. Medical data mining: knowledge discovery in a clinical data warehouse. Proc AMIA Annu Fall Symp 1997:101–5 [PMC free article] [PubMed] [Google Scholar]
- 10.Tung JY, Do CB, Hinds DA, et al. Efficient replication of over 180 genetic associations with self-reported medical data. PLoS One 2011;6:e23473. [DOI] [PMC free article] [PubMed] [Google Scholar]
- 11.Wang TD, Plaisant C, Quinn AJ, et al. Aligning Temporal Data by Sentinel Events: Discovering Patterns in Electronic Health Records. Chi 2008: 26th Annual Chi Conference on Human Factors in Computing Systems Vols 1 and 2, Conference Proceedings 2008:457–66 [Google Scholar]
- 12.Wang X, Hripcsak G, Markatou M, et al. Active computerized pharmacovigilance using natural language processing, statistics, and electronic health records: a feasibility study. J Am Med Inform Assoc 2009;16:328–37 [DOI] [PMC free article] [PubMed] [Google Scholar]
- 13.Wright A, Chen ES, Maloney FL. An automated technique for identifying associations between medications, laboratory results and problems. J Biomed Inform 2010;43:891–901 [DOI] [PubMed] [Google Scholar]
- 14.Yang J, Logan J. A data mining and survey study on diseases associated with paraesophageal hernia. AMIA Annu Symp Proc 2006:829–33 [PMC free article] [PubMed] [Google Scholar]
- 15.Batal I, Sacchi L, Bellazzi R, et al. A temporal abstraction framework for classifying clinical temporal data. AMIA Annu Symp Proc 2009;2009:29–33 [PMC free article] [PubMed] [Google Scholar]
- 16.Klimov D, Shahar Y. A framework for intelligent visualization of multiple time-oriented medical records. AMIA Annu Symp Proc 2005:405–9 [PMC free article] [PubMed] [Google Scholar]
- 17.Klimov D, Shahar Y. Intelligent querying and exploration of multiple time-oriented medical records. Stud Health Technol Inform 2007;129(Pt 2):1314–18 [PubMed] [Google Scholar]
- 18.Klimov D, Shahar Y, Taieb-Maimon M. Intelligent interactive visual exploration of temporal associations among multiple time-oriented patient records. Methods Inf Med 2009;48:254–62 [DOI] [PubMed] [Google Scholar]
- 19.Moskovitch R, Shahar Y. Medical temporal-knowledge discovery via temporal abstraction. AMIA Annu Symp Proc 2009;2009:452–6 [PMC free article] [PubMed] [Google Scholar]
- 20.Patnaik D, Butler P, Ramakrishnan N, et al. Experiences with mining temporal event sequences from electronic medical records. In Proceedings of the 17th ACM SIGKDD international conference on Knowledge discovery and data mining (KDD 2011). 2011:360–8 [Google Scholar]
- 21.Chittaro L, Combi C, Trapasso G. Data mining on temporal data: a visual approach and its clinical application to hemodialysis. J Visual Lang Comput 2003;14:591–620 [Google Scholar]
- 22.Cline MS, Smoot M, Cerami E, et al. Integration of biological networks and gene expression data using Cytoscape. Nat Protoc 2007;2:2366–82 [DOI] [PMC free article] [PubMed] [Google Scholar]
- 23.Kessler RC, Chiu WT, Demler O, et al. Prevalence, severity, and comorbidity of 12-month DSM-IV disorders in the National Comorbidity Survey Replication. Arch Gen Psychiatry 2005;62:617–27 [DOI] [PMC free article] [PubMed] [Google Scholar]
- 24.Polyzos SA, Kountouras J, Zavos C, et al. The association between Helicobacter pylori infection and insulin resistance: a systematic review. Helicobacter 2011;16:79–88 [DOI] [PubMed] [Google Scholar]
- 25.Chen Y, Blaser MJ. Association between gastric Helicobacter pylori colonization and glycated hemoglobin levels. J Infect Dis 2012;205:1195–202 [DOI] [PMC free article] [PubMed] [Google Scholar]
- 26.Jeon CY, Haan MN, Cheng C, et al. Helicobacter pylori infection is associated with an increased rate of diabetes. Diabetes Care 2012;35:520–5 [DOI] [PMC free article] [PubMed] [Google Scholar]
- 27.Fujiwara Y, Higuchi K, Arafa UA, et al. Long-term effect of Helicobacter pylori eradication on quality of life, body mass index, and newly developed diseases in Japanese patients with peptic ulcer disease. Hepatogastroenterology 2002;49:1298–302 [PubMed] [Google Scholar]
- 28.Kamada T, Hata J, Kusunoki H, et al. Eradication of Helicobacter pylori increases the incidence of hyperlipidaemia and obesity in peptic ulcer patients. Dig Liver Dis 2005;37:39–43 [DOI] [PubMed] [Google Scholar]
- 29.MacKenzie T, Zens MS, Ferrara A, et al. Diabetes and risk of bladder cancer: evidence from a case-control study in New England. Cancer 2011;117:1552–6 [DOI] [PMC free article] [PubMed] [Google Scholar]
- 30.Allen JF. Bioinformatics and discovery: induction beckons again. Bioessays 2001;23:104–07 [DOI] [PubMed] [Google Scholar]
- 31.Kell DB, Oliver SG. Here is the evidence, now what is the hypothesis? The complementary roles of inductive and hypothesis-driven science in the post-genomic era. Bioessays 2004;26:99–105 [DOI] [PubMed] [Google Scholar]
- 32.Reshef DN, Reshef YA, Finucane HK, et al. Detecting novel associations in large data sets. Science 2011;334:1518–24 [DOI] [PMC free article] [PubMed] [Google Scholar]
- 33.Tan P, Kumar V, Srivastava J. Selecting the right interestingness measure for association patterns. In Proceedings of the 8th International Conference on Knowledge Discovery and Data Mining (KDD 2002) 2002:32–41. [Google Scholar]
- 34.Linden A, Biuso TJ, Allada G, et al. Consensus development and application of ICD-9-CM codes for defining chronic illnesses and their complications. Dis Manag Health Outcomes 2007;15:315–22 [Google Scholar]
- 35.Rassekh SR, Lorenzi M, Lee L, et al. Reclassification of ICD-9 Codes into Meaningful Categories for Oncology Survivorship Research. J Cancer Epidemiol 2010;2010 doi:10.1155/2010/569517 [DOI] [PMC free article] [PubMed] [Google Scholar]
- 36.Clinical Classifications Software (CCS) for ICD-9-CM, 2012. http://www.hcup-us.ahrq.gov/toolssoftware/ccs/ccs.jsp (accessed 24 Jul 2012).
- 37.Schneeweiss S, Seeger JD, Smith SR. Methods for developing and analyzing clinically rich data for patient-centered outcomes research: an overview. Pharmacoepidemiol Drug Saf 2012;21(Suppl 2):1–5 [DOI] [PubMed] [Google Scholar]
- 38.Schneeweiss S, Gagne JJ, Glynn RJ, et al. Assessing the comparative effectiveness of newly marketed medications: methodological challenges and implications for drug development. Clin Pharmacol Ther 2011;90:777–90 [DOI] [PubMed] [Google Scholar]
- 39.Rhodes ET, Laffel LM, Gonzalez TV, et al. Accuracy of administrative coding for type 2 diabetes in children, adolescents, and young adults. Diabetes Care 2007;30:141–3 [DOI] [PubMed] [Google Scholar]
- 40.Zhou X, Zheng K, Ackerman MS, et al. Cooperative documentation: the patient problem list as a nexus in electronic health records. In: Proceedings of the ACM 2012 Conference on Computer Supported Cooperative Work (CSCW '12). 2012:911–20. doi: 10.1145/2145204.2145340 [Google Scholar]
- 41.Szeto HC, Coleman RK, Gholami P, et al. Accuracy of computerized outpatient diagnoses in a Veterans Affairs general medicine clinic. Am J Manag Care 2002;8:37–43 [PubMed] [Google Scholar]
- 42.Williams C, Mosley-Williams A, McDonald C. Accuracy of provider generated computerized problem lists in the Veterans Administration. AMIA Annu Symp Proc 2007:1155 [PubMed] [Google Scholar]
- 43.Tseng CH. Pioglitazone and bladder cancer in human studies: is it diabetes itself, diabetes drugs, flawed analyses or different ethnicities? J Formos Med Assoc 2012;111:123–31 [DOI] [PubMed] [Google Scholar]
- 44.Edwards A, Hollin I, Barry J, et al. Barriers to cross–institutional health information exchange: a literature review. J Healthc Inf Manag 2010;24:22–34 [PubMed] [Google Scholar]
- 45.Report from the CDC Morbidity and Mortality Weekly Report (MMWR). Prevalence of autism spectrum disorders–Autism and developmental disabilities monitoring network, 14 sites, United States, 2008. MMWR Surveill Summ 2012;61: 1–19 [PubMed] [Google Scholar]
- 46.Friedman CP, Wong AK, Blumenthal D. Achieving a nationwide learning health system. Sci Transl Med 2010;2:57cm29–7cm29 [DOI] [PubMed] [Google Scholar]
- 47.Kaye SB, Patterson A. Association between total astigmatism and myopia. J Cataract Refract Surg 1997;23:1496–502 [DOI] [PubMed] [Google Scholar]
- 48.Fulton AB, Hansen RM, Petersen RA. The relation of myopia and astigmatism in developing eyes. Ophthalmology 1982;89:298–302 [DOI] [PubMed] [Google Scholar]
- 49.Pearl J. Causality: models, reasoning, and inference. Cambridge, New York, UK: Cambridge University Press, 2000 [Google Scholar]
- 50.DiSantostefano J. Eligibility and frequency requirements of the initial preventive physical exam. J Nurse Pract 2006;2:122–24 [Google Scholar]
- 51.Denny JC, Ritchie MD, Basford MA, et al. PheWAS: demonstrating the feasibility of a phenome-wide scan to discover gene-disease associations. Bioinformatics 2010;26:1205–10 [DOI] [PMC free article] [PubMed] [Google Scholar]
Associated Data
This section collects any data citations, data availability statements, or supplementary materials included in this article.