

Abstract
Lesion and electrophysiological studies in rodents have identified the amygdala and hippocampus (HPC) as key structures for Pavlovian fear conditioning, but human functional neuroimaging studies have not consistently found activation of these structures. This could be because hemodynamic responses cannot detect the sparse neuronal activity proposed to underlie conditioned fear. Alternatively, differences in experimental design or fear levels could account for the discrepant findings between rodents and humans. To help distinguish between these alternatives, we used tissue oxygen amperometry to record hemodynamic responses from the basolateral amygdala (BLA), dorsal HPC (dHPC) and ventral HPC (vHPC) in freely-moving rats during the acquisition and extinction of conditioned fear. To enable specific comparison with human studies we used a discriminative paradigm, with one auditory cue [conditioned stimulus (CS)+] that was always followed by footshock, and another auditory cue (CS−) that was never followed by footshock. BLA tissue oxygen signals were significantly higher during CS+ than CS− trials during training and early extinction. In contrast, they were lower during CS+ than CS− trials by the end of extinction. dHPC and vHPC tissue oxygen signals were significantly lower during CS+ than CS− trials throughout extinction. Thus, hemodynamic signals in the amygdala and HPC can detect the different patterns of neuronal activity evoked by threatening vs. neutral stimuli during fear conditioning. Discrepant neuroimaging findings may be due to differences in experimental design and/or fear levels evoked in participants. Our methodology offers a way to improve translation between rodent models and human neuroimaging.
Keywords: amygdala, extinction, fear, functional magnetic resonance imaging, hippocampus, tissue oxygen
Introduction
Understanding the neural basis of aversive learning is a fundamental goal in neuroscience, and Pavlovian fear conditioning is the dominant experimental paradigm (Davis, 1992; Phelps & LeDoux, 2005). Typically, an initially neutral cue such as a tone is paired with a painful, unconditioned stimulus (US) such as electric shock. With sufficient training, the cue becomes a conditioned stimulus (CS+) with its own affective significance. A second cue (CS−), never paired with the US, can be used to assess the specificity of the ‘CS+ → US’ association. Subsequent presentations of the CS+ without the US leads to extinction, in which a new ‘CS+ → no US’ association is formed. This simple paradigm can be used in rodents and humans in essentially the same form, and it is assumed that it engages the same brain structures.
Studies in rodents argue strongly that the amygdala and hippocampus (HPC) play key roles in fear conditioning (for reviews, see Davis, 1992; Maren, 2001; Maren & Quirk, 2004). Lesions of the basolateral (BLA) or central amygdala prevent fear conditioning to discrete cues and the training context (Iwata et al., 1986; LeDoux et al., 1990; Maren et al., 1996; Wilensky et al., 2006). HPC lesions consistently disrupt contextual conditioning (Selden et al., 1991; Phillips & LeDoux, 1992; Kim et al., 1993) and, in some circumstances, cue conditioning (Richmond et al., 1999; Maren & Holt, 2004; Zelikowsky et al., 2012). Moreover, fear conditioning increases CS+-evoked single-unit activity in amygdala and HPC neurons (Quirk et al., 1995; Goosens et al., 2003; Moita et al., 2003; Herry et al., 2008), and increases field potential amplitude in a manner congruent with the induction of long-term potentiation (McKernan & Shinnick-Gallagher, 1997; Rogan et al., 1997). The importance of the amygdala and HPC in rodent fear conditioning is firmly established.
However, several human functional magnetic resonance imaging (fMRI) studies report only transient amygdala or HPC activation, and some have failed to observe activation at all. Indeed, a recent meta-analysis failed to find convincing evidence of higher blood oxygen level-dependent (BOLD) signals evoked during CS+ vs. CS− trials in either structure (Mechias et al., 2010). Subsequently, it has been argued that hemodynamic signals are ill-suited or even unable to detect the sparse neuronal activity underlying fear conditioning (Bach et al., 2011). An alternative explanation, however, is that human studies may not always evoke fear levels comparable to rodent studies, and therefore may not engage the same neural circuits.
Here we investigated in freely-moving rats whether hemodynamic responses in the BLA, dorsal HPC (dHPC) and ventral HPC (vHPC) could distinguish between threat-predicting (CS+) and neutral (CS−) cues. We recorded hemodynamic responses in the form of tissue oxygen (TO2) signals, which are closely related to the BOLD signal and are dependent upon the same physiological mechanisms (Fig. 1; Thompson et al., 2003; Offenhauser et al., 2005; Logothetis, 2007; Lowry et al., 2010; Li et al., 2011; McHugh et al., 2011). CS+ and CS−-evoked TO2 signals were recorded during pre-exposure, training and extinction of conditioned fear.
FIG. 1.
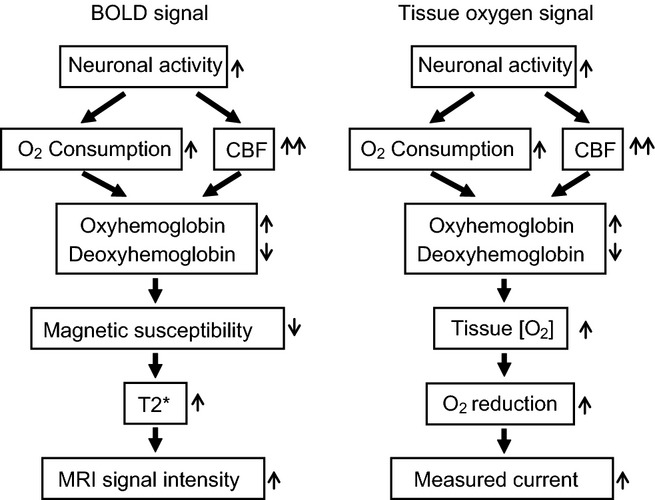
Flow chart illustrating the physiological events linking increased neuronal activity to higher blood oxygen level-dependent (BOLD) signals (left panel) and higher tissue oxygen signals (right panel). CBF, cerebral blood flow; O2 reduction, electrochemical reduction of O2 caused by applying a negative potential (−650 mV) to the sensing electrode; Tissue [O2], tissue oxygen concentration. The double arrow indicates a proportionally greater increase in CBF compared with O2 consumption, hence positive BOLD and TO2 signals. MRI, magnetic resonance imaging.
Materials and methods
Subjects
This study used eight naïve male Sprague–Dawley rats (Harlan Olac, Bicester, UK), approximately 3 months old at the start of the experiment, and housed in a temperature- and humidity-controlled room under a 12 h light : dark cycle (lights on 07:00–19:00 h). Testing took place during the light cycle. Rats were housed four per cage before surgery, singly for 1 week after surgery, and two per cage thereafter, with ad libitum food and water. The experiments were conducted in accordance with the United Kingdom Animals Scientific Procedures Act (1986) under project license PPL 30/1989, and were approved by local ethical review for the University of Oxford.
Electrode construction
TO2 was recorded amperometrically using carbon paste electrodes (CPEs), as described previously (McHugh et al., 2011). CPEs were constructed from 8T Teflon®-insulated silver wire (200 μm bare diameter, 270 μm coated diameter; Advent Research Materials, Suffolk, UK) soldered into gold-plated socket contacts (E363/0, Plastics One, Roanoke, VA, USA). The Teflon® insulation was slid along the wire to create a ∼2-mm-deep cavity, which was packed with carbon paste (2.8 g carbon powder; Sigma-Aldrich, St Louis, MO, USA; Catalogue No. 282863, mixed with 1.0 mL of silicone oil; Sigma-Aldrich; Catalogue No. 17563-3). The Teflon® insulation on the CPEs was flush with the compacted and smoothed carbon paste such that the active part of the electrode was a flat disk with diameter 200 μm (area: 0.03 mm2). Reference and auxiliary electrodes were made from 8T Teflon®-insulated silver wire, with one end soldered into a gold-plated contact (E363/0, Plastics One).
Surgery
Rats were anesthetized with Isoflurane (3–4% in 4 L/min O2 for induction, 1.5–2% in 1 L/min O2 for maintenance) and placed in a stereotaxic frame with the head level between bregma and lambda. Body temperature was maintained at 37 °C via a homoeothermic blanket connected to a rectal thermometer (Harvard Apparatus, MA, USA). Lignocaine (1%) was topically applied to the skin, and Viscotears® (Novartis Pharma AG, Basel, Switzerland) was used to prevent corneal drying. An incision was made along the midline and the periosteum retracted. Skull holes were drilled to allow the insertion of electrodes and skull screws. Rats were implanted with CPEs into the BLA [anterior–posterior (A–P): −2.8; medial–lateral (M–L): +5.0; dorsal–ventral (D–V): −7.0], dHPC (A–P: −3.6; M–L: +2.2; D–V: −3.2) and vHPC (A–P: −5.3; M–L: −4.7; D–V: −6.5). Reference and auxiliary electrodes were implanted into the cortex. The gold contacts from each electrode were inserted into a six-channel electrode pedestal (MS363, Plastics One), which was secured to the skull with dental cement. Analgesia (Meloxicam, ∼2 mg/kg; s.c.) was given before and after surgery.
Amperometric techniques
TO2 was measured using constant potential amperometry. A constant potential (−650 mV relative to a reference electrode) was applied to the CPEs using a low-noise potentiostat (‘Biostat’, ACM Instruments, Cumbria, UK). The applied potential produces the electrochemical reduction of dissolved O2 on the surface of the CPEs, inducing an electrical current, which was measured by the potentiostat. The availability of O2 for this two-step reaction (O2 + 2H+ + 2e− → H2O2; H2O2 + 2H+ + 2e− → 2H2O) is determined by the local TO2 concentration. Thus, changes in O2 concentration around the tip of the CPE produce directly proportional changes in the measured Faradaic current (Hitchman, 1978). The spatial resolution is sufficient to detect TO2 differences between lamina in rat whisker barrel cortex, i.e. approximately ∼400 μm (Li et al., 2011). Accordingly, the area of sensitivity is estimated to be a sphere with diameter twice the electrode surface diameter, i.e. a 200-μm-diameter electrode has ∼400-μm-diameter sphere of sensitivity (see also Thompson et al., 2003).
Data recording
Rats were connected to the potentiostat via a six-channel commutator (SL6C, Plastics One) using screened cables (363-363 6TCM, Plastics One). A Powerlab® 8/30 (AD Instruments, Oxon, UK) was used for analog/digital conversion, and data were collected on a Windows PC running Chart® v5 software (AD Instruments). TO2 data were sampled continuously at 4 kHz.
Apparatus
The pre-exposure and training sessions were conducted in an operant chamber (ENV-008-CT; Med Associates, Lafayette, IN, USA), illuminated by a ceiling-mounted house-light (ENV-215M; Med Associates). The grid floor (ENV-005) of the chamber had 18 stainless-steel rods connected to a shock generator (ENV-414S). A speaker (ENV-224AM) and a mechanical clicker device (ENV-135M) were mounted on the same wall of the chamber, at the same height. A counter-weighted arm (PHM-110P1) attached to the rear wall of the operant chamber held a swiveling commutator (SL6C, Plastics One) that allowed free movement of the tethered rat. The operant chamber was placed inside a sound-attenuating melamine cubicle (ENV-018MD). A CCD video camera with a wide-angle lens (VPC-465B, CES AG, Zurich, Switzerland) provided a full view of the interior of the chamber. Tissue paper was used to line the waste pan and this was replaced for each rat.
The extinction session took place in a novel context – a transparent plastic box (220 mm wide, 200 mm deep, 250 mm high) placed inside a sound-attenuating melamine chamber (350 mm wide, 395 mm deep, 475 mm high). The clicker and speaker were mounted on the same wall of the box, at the same height. An infra-red video camera (Maplin Electronics, UK) was mounted above the box, providing a full view of the interior. The discriminability between the novel and training contexts was enhanced in three ways. First, the floor of the novel context was solid plastic and lined with tissue paper, providing a strong tactile contrast with the metallic grid floor of the training context. Second, the novel context was not illuminated, whereas the house light was on in the training context. Third, the novel context was given a distinct odor by placing one drop of sandalwood oil (Home Fragrance Essential Oils, Body Shop, UK) onto fresh tissue paper before each session began.
CS and US delivery were controlled by a script written in med-pc iv software (Med Associates). In each session, the rat heard five tones (2900 Hz, 87 dB, 30-s duration) and five clickers (10 Hz, 87 dB, 30-s duration) in random order, but with no more than two consecutive presentations of the same stimulus. A relatively long CS duration (30 s) was chosen so that the hemodynamic response evoked by the CS could fully evolve before the arrival of the US. Note that during extinction, CS+1 preceded CS−1 for 50% of the rats, and vice versa for the other 50%. The interval between CS presentations was randomly varied between 70 and 110 s (mean: 90 s; SD: 14.9 s). The US consisted of a scrambled footshock (0.5 mA, 0.5 s duration), delivered through the bars of the grid floor, that co-terminated with offset of the CS+ (i.e. US onset at 29.5 s after CS onset). The script controlled the delivery of transistor-transistor-logic pulses to the Powerlab 8/30 ADC to ensure that CS and US delivery were accurately synchronized to TO2 data acquisition (1-ms resolution).
Procedure
The aim was to adopt a fear-conditioning paradigm that resembled those used in human fMRI studies in order to be able to compare the TO2 signals with BOLD responses associated with fear-inducing stimuli. Specifically, this involved using a discriminative fear-conditioning paradigm in which a CS+ (tone or clicker, counterbalanced) was paired with an aversive US (footshock); whereas a CS− (clicker if tone was CS+, tone if clicker was CS+) was never paired with footshock. Thus, TO2 signals evoked by the CS+ could be compared directly with signals evoked by the CS−, allowing for a CS+ vs. CS− contrast as would be used in BOLD fMRI. Fear conditioning began 3 weeks after surgery, and the experimental design is shown in Table 1.
Table 1.
Summary of experimental design
| Day | Trials | |
|---|---|---|
| 1 | Pre-exposure (training context) | 5 × tone, 5 × clicker (no shocks to either) |
| 2 | Training I (trials 1–5) | 5 × CS− → no shock, 5 × CS+ → shock |
| 3 | Training II (trials 6–10) | 5 × CS− → no shock, 5 × CS+ → shock |
| 4 | Extinction I (novel context) | 5 × CS−, 5 × CS+ (no shocks to either) |
Rats were first pre-exposed to the tone and clicker without any footshocks (Day 1: 5 × tone, 5 × clicker). This pre-exposure phase was included because pre-exposure to the CS+ and CS− are commonly used in both human fMRI (Buchel et al., 1998, 1999; LaBar et al., 1998) and rodent electrophysiology experiments (Goosens et al., 2003; Moita et al., 2003; Herry et al., 2008). After the pre-exposure session, the rats then received 10 training trials over 2 days in which either the tone or clicker was always followed by footshock (Days 2 and 3: 5 × CS−, 5 × CS+ footshock, per day). Rats were conditioned over 2 days because pilot testing revealed that one session was insufficient to see robust CS+/CS− discrimination. Training was followed by extinction in a novel context during which no shocks were given after either the CS+ or CS− (Day 4: 5 × CS−, 5 × CS+; no shocks).
Apart from the presence or absence of shocks, the testing procedure on each day was otherwise identical. The rat was taken to the testing room in a transport cage, connected to the recording equipment, and placed into the conditioning chamber (Days 1–3) or the novel context (Day 4). The potential was then applied to the electrodes for 15 min to ensure a stable TO2 signal. Then the 22-min experimental session began (total time in box per day: 37 min). At the end of each session, the rat was removed from the chamber, disconnected from the equipment and returned to the holding room. The chamber was cleaned with a solution of 10% (v/v) ethanol in water, and the napkin lining the waste pan (training context) or lining the floor (novel context) was replaced before the next session began.
Data analyses
Freezing behavior was measured using a script in NIH Image (NIH, Bethesda, MD, USA). The script collected one frame of video per second and compared consecutive frames for changes in pixels. If a sufficient proportion of pixels changed then the rat was adjudged to be moving; if not, then the rat was adjudged to be freezing. The script was calibrated so that pixel changes caused by random camera noise and breathing movements were not sufficient to signal a movement score. This automated system has over 80% concordance with human ratings of freezing behavior. A detailed description can be found in Richmond et al. (1998). The counts of freezing for each 30-s CS presentation were then expressed as a percentage. For example, a rat freezing for 18 s during the 30-s CS would receive a freezing score of 60%. For correlational analyses with TO2 responses, we also calculated the freezing difference score by subtracting the mean CS−-evoked freezing from the mean CS+-evoked freezing.
TO2 data were down-sampled from 4 kHz to 10 Hz, and the signal change from baseline (ΔTO2 signal) was calculated by subtracting the mean TO2 signal during the 5 s before CS onset (i.e. baseline) from the TO2 signal during the 30-s CS presentation. Then, the 30-s signal was divided into 15 × 2-s timebins (i.e. 0–2 s, 2–4 s, 4–6 s, …, 28–30 s), with each data point equal to the mean value during each 2-s timebin. To investigate the correlation with behavior, we also calculated a TO2 difference score by subtracting the mean CS−-evoked TO2 signal from the mean CS+-evoked TO2 signal. Difference scores were calculated separately for each rat and for each brain region for the second training day and the extinction day.
Statistical procedures
Data were analysed using t-tests, analysis of variance (anova) and Pearson correlation in spss (version 15; SPSS, IL, USA). anovas are described using a modified version of Keppel's (1982) notation in which the dependent variable is defined in the form: A2 × B3 × S8, where A is a factor with two levels, B a factor with three levels, and S8 denotes that eight subjects were included in the analysis.
For each day, we calculated the mean freezing and TO2 responses for the five CS+ vs. the five CS− trials. TO2 responses were analysed separately for each brain region (BLA, vHPC, dHPC) using repeated-measures anova, with CS type (CS+ vs. CS−) and timebin (1–15, covering the 30-s CS duration in 2-s timebins) as within-subject factors [i.e. CS type2 (CS+,CS−) × timebin15 × S8]. For the extinction session, we also investigated responses to the first and the last CS+ and CS− trials of the session: i.e. CS−1, CS+1, CS−5, CS+5. The rationale for this approach was that responses to CS+1 (vs. CS−1) reflect the pure expression of conditioned fear, which is logically unconfounded by any extinction process whereas, comparatively, responses to CS+5 (vs. CS−5) reflect, in part, the consequences of extinction, i.e. learning that the CS+ is no longer followed by shock. These extinction session data were analysed using the following models, for freezing: CS type2 (CS+,CS−) × trial number2 (CS1,CS5) × S8; and for TO2: CS type2 (CS+,CS−) × trial number2 (CS1,CS5) × timebin15 × S8. Separate analyses for CS+ and CS− stimuli, including all five trials of the extinction session, were also conducted. For all analyses, interactions were investigated using simple main effects (SME) and pairwise comparisons with the familywise error rate at α = 0.05. Pairwise comparisons for CS type × timebin interactions (e.g. for CS+ vs. CS−) are reported as time periods after stimulus onset (e.g. higher CS+ vs. CS− signals during timebins 4, 5 and 6 are reported as: CS+ > CS−, 6–12 s, P < 0.05). Figures show the mean ± 1 standard error of the mean (SEM) for CS+- and CS−-evoked responses (upper panels), and the difference contrast (CS+ > CS−) ± 1 standard error of the difference (lower panels). Note that negative values for the difference contrast indicate CS− > CS+. We found no evidence of a CS+ vs. CS− contrast in either the behavioral or TO2 data on the first day of training, and so only data from training Day 2 are shown in the main figures. Data from training Day 1 are shown in Fig. S1.
Histology
At the end of the experiments, rats were injected with Euthatal (200 mg/mL sodium pentobarbitone; 200 mg/kg i.p.) and perfused transcardially with physiological saline (0.9% NaCl) followed by 10% formol saline (10% formalin in physiological saline). The brains were then removed and placed in 10% formol saline. The brains were then transferred to 30% sucrose–formalin and frozen. Coronal sections (50 μm) were cut on a freezing microtome and stained with Cresyl violet to enable visualisation of the electrode placements.
Results
Histology
CPEs were successfully targeted to the BLA, dHPC and vHPC in every rat, as shown in Fig. 2. There were no systematic differences in TO2 signals based on exact placement within the BLA or subfield placements within dHPC or vHPC. No rats were excluded on histological grounds.
FIG. 2.
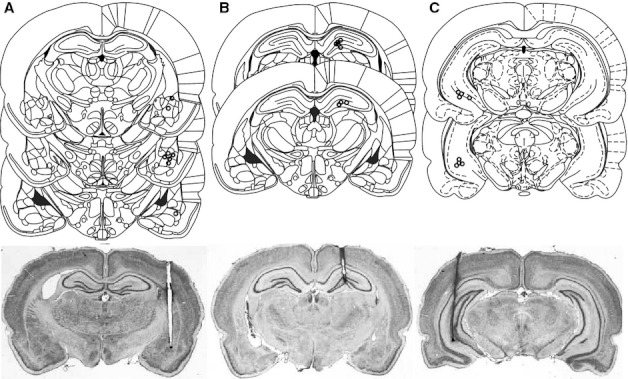
Reconstructions and representative photomicrographs of electrode positions in (A) BLA, (B) dHPC and (C) vHPC. Reconstructions are based on the atlas of Paxinos & Watson (1998).
Behavior
During the pre-exposure session, rats were initially active during CS presentations (i.e. they exhibited low levels of freezing), but became less active towards the end of the session, presumably reflecting habituation to the conditioning chamber. Importantly, behavioral responses to the CS+ and CS− were almost identical during the pre-exposure session (Fig. 3A).
FIG. 3.
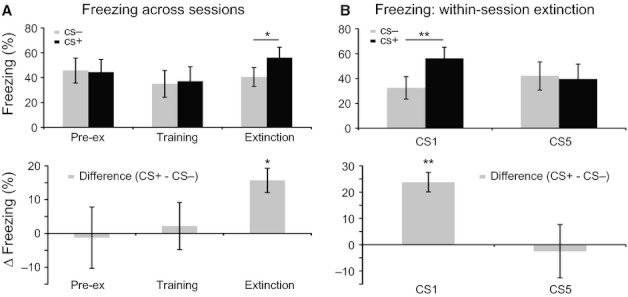
Freezing behavior. (A) Upper panel: percentage (%) freezing (±SEM) evoked by the CS− (gray) and CS+ (black) during pre-exposure, Day 2 of training, and extinction. Lower panel: the difference contrast (CS+ minus CS− ± standard error of the difference, SED) for the data shown in the upper panel. (B) Upper panel: % freezing (±SEM) evoked by the CS−1 and CS+1 (left) and CS−5 and CS+5 (right) during extinction (CS−, gray; CS+, black). Lower panel: the difference contrast (±SED) for the freezing data shown in the upper panel. Pre-ex, pre-exposure session. *P < 0.01; **P < 0.001. CS, conditioned stimulus.
Somewhat surprisingly, during the training sessions, there was no significant behavioral discrimination, perhaps because discriminative freezing was masked by contextual conditioning and/or the unconditioned response to the shock. Analysis of freezing responses during the 10 CS+ vs. 10 CS− training trials (anova: CS type2 × trial number10 × S8) revealed no effect of CS type, trial number or interaction (all F < 1.2; P > 0.3; see Fig. S2).
However, even though rats did not discriminate during training, they did learn to discriminate between the CS+ and CS−, and during the extinction session they froze significantly more during CS+ than CS− trials. Analysis of CS+ and CS− evoked freezing over pre-exposure, training and extinction (anova: day3 × CS type2 × S8) revealed a significant CS type × day interaction (F2,14 = 3.9; P = 0.045), with higher freezing during CS+ than CS− trials on the extinction day (P = 0.003) but not during pre-exposure or training (both P > 0.8). Thus, during the extinction session, the rats demonstrated clear behavioral discrimination between the CS+ and CS−.
The previous analysis of the extinction day used the averaged freezing response for the five CS+ vs. the five CS− presentations. To dissociate fear expression from fear extinction, we also investigated responses to the first and last CS+ and CS− trials of the extinction session [i.e. (CS+1 vs. CS−1) vs. (CS+5 vs. CS−5)], using the rationale that rats would expect footshock following CS+1 but, after four non-reinforced trials, would be less likely to expect shock following CS+5. Consistent with this prediction, all eight rats froze more during CS+1 than CS−1, but only two out of eight rats froze more during CS+5 than CS−5 (Fig. 3B). Analysis of these data (anova: CS type2 × trial number2 × S8) revealed a significant CS type × trial number interaction (F1,7 = 7.6; P = 0.03), with higher freezing during CS+1 than CS−1 (F1,7 = 41.3; P < 0.001) but no difference between CS+5 and CS−5 (F1,7 = 0.1; P > 0.9). Thus, rats froze more during the CS+ than the CS− at the start of the session but not at the end, indicating that the CS+ was no longer treated as a threat stimulus. Furthermore, separate one-way anovas, conducted across all five trials of the extinction session, revealed a significant main effect of trial number for the CS+ trials (F4,28 = 3.0; P = 0.03), which reflected the general decrease in levels of freezing across the extinction session, but no significant main effect of trial number for the CS− trials (F4,28 < 1; P = 0.4).
BLA TO2 signals respond to changes in ‘CS+ → US’ contingency
During the pre-exposure session, stimulus onset evoked a small-amplitude, positive-going TO2 response in the BLA to both stimuli (Fig. 4). There were no differences in TO2 responses to the ‘to-be-allocated’ CS+ and CS− (no effect of CS type or CS type × timebin interaction: all F < 0.2; P > 0.9). Training led to a marked change in the amplitude and shape of the CS+- and CS−-evoked TO2 signals (see Figs 4 and S1) and, on the second training day, CS+-evoked signals were significantly higher than CS−-evoked signals (main effect of CS type: F1,7 = 6.9; P = 0.03; CS type × timebin interaction: F14,98 = 2.0; P = 0.03; SME: CS+ > CS−, 2–16 s, P < 0.05; 20–30 s, 0.05 < P < 0.1). Thus, during training Day 2, BLA TO2 signals were significantly higher during CS+ than CS− trials, and this was found in the absence of significant behavioral discrimination.
FIG. 4.
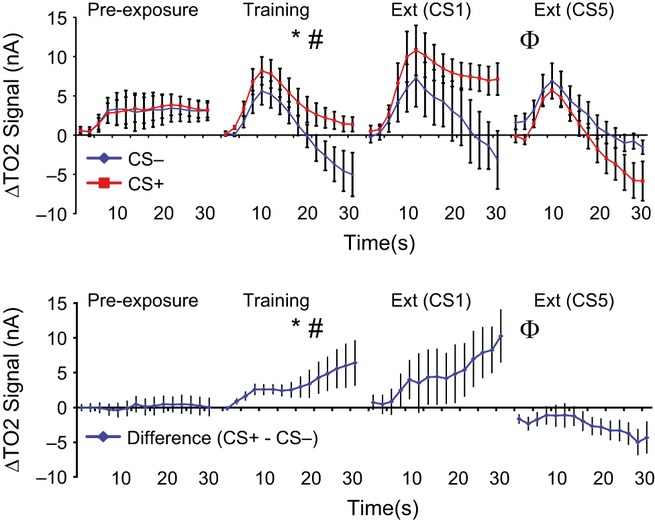
BLA tissue oxygen (TO2) signals. Upper panel: BLA TO2 signals (±SEM) evoked by the CS− (blue) and CS+ (red) during pre-exposure, Day 2 of training, and the first (CS1) and last (CS5) CS− and CS+ trials of extinction. Lower panel: the difference contrast (CS+ minus CS− ± SED) for the BLA data shown in the upper panel. *Main effect of CS, P < 0.05; #CS type × timebin interaction, P < 0.05; ΦCS type × trial number × timebin interaction, P < 0.05. CS, conditioned stimulus.
BLA TO2 signal correlates with behavioral discrimination during training
Next, we investigated the relationship between BLA TO2 signals and freezing behavior. We calculated a TO2 difference score based on the CS+ > CS− contrast from human fMRI studies (i.e. CS+-evoked TO2 signal minus CS−-evoked TO2 signal) for each rat and plotted this against the corresponding freezing difference score (i.e. CS+-evoked freezing minus CS−-evoked freezing). Thus, each data point in Fig. 5 represents the BLA TO2 difference score vs. the freezing difference score for each rat (n = 8). BLA TO2 difference scores were significantly correlated with freezing difference scores during training (r = 0.7; t6 = 2.5, P < 0.05; Fig. 5A). Thus, although at a group level freezing was not significantly higher during training for CS+ than CS− trials, the BLA TO2 signal contrast was significantly correlated with the magnitude of behavioral discrimination.
FIG. 5.
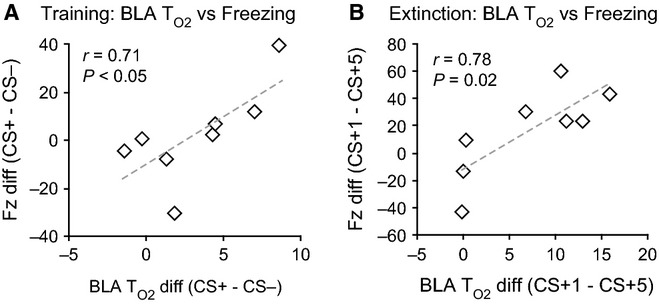
Correlation between basolateral amygdala (BLA) TO2 signals and freezing behavior. (A) The graph shows BLA TO2 signal difference contrast (CS+ minus CS−) vs. freezing difference contrast (CS+ minus CS−) for Day 2 of training. Rats that had higher CS+ than CS− TO2 signals exhibited higher freezing to the CS+ than CS−. (B) The BLA TO2 signal difference contrast (CS+1−CS+5) vs. the corresponding freezing difference contrast (CS+1−CS+5) during extinction. Larger decreases in BLA TO2 signal from CS+1 to CS+5 were associated with larger decreases in freezing behavior from CS+1 to CS+5. In both graphs, each data point represents the TO2 vs. freezing difference score for individual rats (n = 8). CS, conditioned stimulus.
BLA TO2 responses change to reflect ‘CS+ → no US’ association during extinction in a novel context
During the extinction session, BLA TO2 responses averaged over the five CS+ vs. the five CS− trials were not statistically different (F < 1.1; P > 0.3; see Fig. S1). However, as illustrated in Fig. 4, BLA TO2 responses were markedly different at the start compared with the end of the extinction session [i.e. (CS+1 vs. CS−1) vs. (CS+5 vs. CS−5)]. BLA TO2 signals were higher during CS+1 than CS−1, but were actually lower during CS+5 than CS−5. Analysis of these BLA TO2 responses revealed a significant three-way interaction between CS type, trial number and timebin (F14,98 = 5.1; P = 0.001). Dissection of this three-way interaction using analysis of SME revealed three key findings.
First, BLA TO2 signals were significantly higher during CS+1 vs. CS−1 of extinction (CS type × timebin interaction: F14,98 = 3.9; P = 0.001; CS+1 > CS−1, 26–30 s, P < 0.05), consistent with what was seen behaviorally and confirming that the higher CS+-evoked TO2 signals seen during training were also present at the start of extinction.
Second, TO2 signals were significantly higher during CS+1 than CS+5 (trial number × timebin interaction: F14,98 = 10.0; P = 0.02; CS+1 > CS+5, 16–30 s, P < 0.05), but not for CS−1 vs. CS−5 (no effect of trial number or trial number × timebin interaction, all F < 1.2; P > 0.3), demonstrating extinction specifically for the CS+-evoked signals.
Third, TO2 signals were actually significantly lower during CS+5 than CS−5 (CS type × timebin interaction: F14,98 = 2.3; P = 0.01; CS−5 > CS+5, 0–4 s and 18–28 s, P < 0.05). Thus, at the start of extinction TO2 signals were significantly higher during CS+ than CS− trials, but by the end of extinction they were significantly higher during CS− than CS+ trials. This is consistent with the idea that the ‘CS+ → no US’ association formed during extinction leads to inhibition of the CS+-evoked BLA TO2 signal.
BLA TO2 signals correlate with the reduction in freezing during extinction
Next, we investigated the relationship between CS+-evoked BLA TO2 signals and freezing behavior specifically during extinction. Six out of eights rats froze more during CS+1 than CS+5, indicative of extinction. In contrast, two out of eight rats did not exhibit reduced freezing from CS+1 to CS+5. Interestingly, in these two rats there was very little difference (or a negative difference) in the BLA TO2 signal contrast between CS+1 and CS+5 (i.e. CS+1 minus CS+5). In other words, like the freezing behavior, the BLA TO2 signals were as high (or higher) during CS+5 than CS+1 in these two rats. Conversely, in the six rats that froze more during CS+1 than CS+5, the corresponding BLA TO2 signals were higher during CS+1 than CS+5. To analyse these data, we calculated difference scores for freezing behavior (CS+1-evoked freezing minus CS+5-evoked freezing) and BLA TO2 signals (CS+1-evoked TO2 signals minus CS+5-evoked TO2 signals), and plotted these against each other (Fig. 5B). The difference between CS+1- and CS+5-evoked BLA TO2 signals was highly correlated with the decrease in freezing from CS+1 to CS+5 (r = 0.8; t7 = 3.1, P = 0.02). In other words, the decrease in the TO2 signal from CS+1 to CS+5 predicted the reduction in freezing behavior seen across the extinction session.
HPC TO2 signals are higher during CS+ than CS− trials during acquisition
During pre-exposure, CS+- and CS−-evoked TO2 signals in dHPC and vHPC were different to those seen in the BLA, with CS onset leading to negative-going signals in both HPC subregions (compare leftmost traces in Fig. 4 vs. Fig. 6A and B). Importantly, there were no differences between the ‘to-be-allocated’ CS+- and CS−-evoked signals in either dHPC or vHPC during pre-exposure (no effect of CS type or CS type × timebin interaction: all F < 1.2; P > 0.3). However, as with the corresponding amygdala TO2 responses, training changed the direction and shape of responses in both HPC regions and, by the second training day, CS+-evoked vHPC TO2 signals were significantly higher than CS−-evoked signals (CS type × timebin interaction: F14,98 = 5.1; P = 0.001; CS+ > CS−, 4–8 s, P < 0.05). This did not reach significance in dHPC, but there was a trend toward higher CS+-evoked signals (main effect of CS type: F1,7 = 3.9; P = 0.09; no interaction: F14,98 = 1.3; P > 0.2). Thus, like the BLA, vHPC TO2 signals during training were higher during CS+ than CS− trials. However, unlike the BLA, neither vHPC nor dHPC difference signals (i.e. the CS+- minus CS−-evoked TO2 signal) were significantly correlated with the corresponding freezing difference scores during training (dHPC: r = 0.59, P > 0.1; vHPC: r = −0.57, P > 0.1).
FIG. 6.
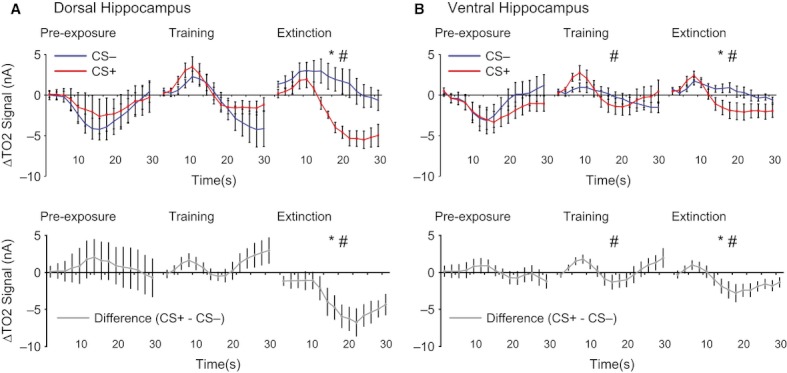
HPC TO2 signals. (A) Upper panel: dHPC TO2 signals (±SEM) evoked by the CS− (blue) and CS+ (red) during pre-exposure, Day 2 of training, and extinction. Lower panel: the difference contrast (CS+ minus CS− ± SED) for the dHPC data shown in the upper panel. (B) Upper panel: as in (A), but for vHPC TO2 signals. Lower panel: the difference contrast (CS+ minus CS− ± SED) for the vHPC data shown in the upper panel. *Main effect of CS, P < 0.05; #CS type × timebin interaction, P < 0.01. CS, conditioned stimulus.
dHPC and vHPC TO2 signals are lower during CS+ than CS− trials during extinction
During extinction, dHPC and vHPC TO2 responses were again markedly different from those seen in the BLA (see Figs 6 and S1). As shown in Fig. 6, CS+-evoked TO2 responses in both dHPC and vHPC decreased below baseline after 12–14 s and were lower (on average) than CS−-evoked responses. Indeed, mean dHPC TO2 signals (averaged over the five CS+ vs. the five CS− trials of the session) were significantly lower during CS+ than CS− trials (main effect of CS type: F1,7 = 10.5; P = 0.01; CS type × timebin interaction: F14,98 = 7.8; P = 0.001; CS− > CS+, 14–30 s, P < 0.05). The same pattern of lower CS+-evoked signals was seen in vHPC (main effect of CS type: F1,7 = 5.9; P = 0.045; CS type × timebin interaction: F14,98 = 4.1; P = 0.001; CS− > CS+, 16–28 s, P < 0.05). Note that unlike signals in the BLA, there was no pronounced change in response from CS+1 to CS+5 in the HPC signals across the extinction session, so it is unlikely that the lower CS+- than CS−-evoked responses were a consequence of extinction (see Fig. S1). Nevertheless, both dHPC and vHPC TO2 signals clearly discriminated between the discrete auditory stimuli (CS+ and CS−) during the extinction session.
Discussion
Summary of results
Behavioral responses and TO2 signals from the BLA, dHPC and vHPC were recorded simultaneously in freely-moving rats during the acquisition, expression and extinction of conditioned fear. Rats froze more during CS+ than CS− trials during the extinction session in a novel context but not during training. In the BLA, TO2 signals were higher during CS+ than CS− trials during training and at the start of extinction, but were significantly lower during CS+ than CS− trials by the end of extinction, a pattern that may reflect the expression of the ‘CS+ → no US’ association learned during extinction. Moreover, during training, the levels of CS+/CS− discrimination present in the BLA TO2 signals were strongly correlated with behavioral discrimination, even though at a group level the rats did not freeze significantly more during CS+ than CS− trials. Also, during extinction, the decrease in the BLA TO2 signal from CS+1 to CS+5 was significantly correlated with the decrease in freezing responses from CS+1 to CS+5. TO2 signals in dHPC and vHPC also discriminated between the CS+ and CS−, with higher CS+-evoked signals in vHPC during training and lower CS+-evoked signals in vHPC and dHPC during extinction. Thus, in rats, hemodynamic responses in the BLA and HPC can detect the distinct patterns of neuronal activity evoked by aversive vs. neutral cues.
Role of the amygdala in fear conditioning: from rodent studies to human neuroimaging
Rodent lesion and electrophysiological studies demonstrate an essential role for the BLA in fear conditioning and extinction (LeDoux et al., 1990; Maren et al., 1996; Herry et al., 2008; Sierra-Mercado et al., 2011), and several authors have proposed the BLA as the critical locus for CS+ → US associations (Davis, 1992; Romanski et al., 1993; Fanselow & LeDoux, 1999; Maren, 2001). Overall, in rodents the evidence for the role of the BLA in fear conditioning is compelling.
Given this evidence, the failure of many human fMRI fear studies to detect differential amygdala activation is surprising (Mechias et al., 2010). However, the interpretation that group-averaged hemodynamic signals are insensitive to the differential patterns of neural activity elicited by the CS+ vs. CS− (for discussion, see Bach et al., 2011) is not consistent with the present data. Even with a relatively small sample, we found that 10 training trials were sufficient to produce robust CS+/CS− discrimination in the BLA TO2 signal. So, at least in rats, amygdala hemodynamic responses can discriminate between aversive and neutral stimuli.
Nevertheless, the question remains as to why some fMRI studies do not observe differential amygdala activity. First, it is important to emphasize that many studies have reported robust differential amygdala activity (Morris et al., 1998, 2001; Armony & Dolan, 2002; Tabbert et al., 2005, 2006; Knight et al., 2009). Thus, our data are consistent with a subset of the fMRI literature. Importantly, our study shares certain design features with some of the studies cited above (Tabbert et al., 2005, 2006; Knight et al., 2009) that are not found in the majority of the studies discussed by Mechias et al. (2010) and Bach et al. (2011). First, unambiguously aversive USs were used (i.e. shock or 100 dB white noise). Second, 100% reinforcement between the CS+ and US was used (i.e. the CS+ was always followed by the US during training), not partial reinforcement. This may be particularly important as amygdala activation increases as a function of the probability of reinforcement (Dunsmoor et al., 2007), and the majority of human fear-conditioning studies have used partial reinforcement to avoid conflation between CS+- and US-evoked responses. These design features may be necessary, although perhaps not sufficient, to evoke differential amygdala responses to the CS+ vs. the CS−.
A further consideration concerns the levels of fear evoked in participants. Humans are aware that they will not come to any real harm during the experiment, which presumably limits their subjective experience of fear during scanning. Although we cannot know for sure, it is a reasonable assumption that rodents experience higher levels of fear than humans during fear-conditioning experiments. Equating levels of fear across species may not be possible, but a recent human fMRI study offers insights into the relationship between fear and amygdala activation. van Well et al. (2012) found that only subjects who exhibited differential fear-potentiated startle (FPS) responses to the CS+ vs. the CS− had higher CS+- than CS−-evoked amygdala BOLD signals. Subjects that did not exhibit differential FPS did not show differential amygdala activity, even when they showed normal US expectancy (i.e. they could correctly predict which CS would be followed by shock). Thus, conditioning, as indexed through correctly learning the stimulus contingencies, is not sufficient to elicit differential amygdala BOLD signals.
While van Well et al. (2012) were the first to measure FPS during human fMRI, many previous studies have used the skin conductance response (SCR), an autonomic measure of arousal, to index fear conditioning (LaBar et al., 1998; Phelps et al., 2004; Knight et al., 2005; Carter et al., 2006; Cheng et al., 2006, 2007). A robust finding from these studies is the positive correlation between differential CS+/CS− SCRs and differential amygdala BOLD signals. This is consistent with our study, which found a strong correlation between differential freezing responses and differential BLA TO2 signals. If subjects (rodent or human) do not show differential fear responses (as indexed by FPS, freezing or SCRs), it is unlikely that they will show differential amygdala activation. Thus, the levels of fear evoked by the CS+ compared with the CS− may be the critical determinant of differential amygdala activation.
HPC TO2 signals discriminate between the CS+ and CS−
The precise role of the rodent HPC in fear conditioning remains debated. Early studies suggested that the HPC was required for contextual but not discrete cue conditioning (Selden et al., 1991; Phillips & LeDoux, 1992). However, both dHPC and vHPC lesions can reduce freezing to discrete cues under some circumstances (Richmond et al., 1999; Maren & Holt, 2004; Maren, 2008; Quinn et al., 2008; Zelikowsky et al., 2012).
The present data show that both dHPC and vHPC exhibit differential TO2 responses to discrete auditory cues. HPC TO2 signals discriminated between CS+ and CS− trials, both during training (vHPC) and during extinction (vHPC and dHPC). Moreover, HPC TO2 signals were markedly different from BLA TO2 signals, which is important because it shows that TO2 signals do not simply reflect general changes due to freezing behavior or the systemic physiological changes that accompany fear conditioning (e.g. heart rate, blood pressure, blood flow, etc.). Notably, there is good concordance between our vHPC TO2 data and anterior HPC BOLD signals recorded during human fear conditioning in terms of the timing and shape of the response (Alvarez et al., 2008; note that anterior HPC is the primate equivalent of rodent vHPC). In particular, in both humans and rodents the difference between CS+- and CS−-evoked signals is transient (i.e. the CS+ response is greater than the CS− response, but only during the first few seconds of stimulus presentation). Thus, differences may not be detected in the HPC when the BOLD contrast is based on analysis of longer durations.
Another notable finding is that CS+-evoked signals were significantly lower than CS−-evoked signals in both HPC subregions during extinction (i.e. there was a CS− > CS+ contrast). We do not know why the CS+-evoked HPC TO2 response is negative (compared with both the CS− and the pre-CS baseline), but recent evidence suggests that negative BOLD signals are associated with suppression of neuronal activity (Boorman et al., 2010). Exactly why the CS+, and not the CS−, is associated with this negative HPC response is not immediately obvious and requires further investigation. Nevertheless, higher CS−- than CS+-evoked HPC BOLD signals have also been reported during extinction in humans (Phelps et al., 2004). Thus, our HPC findings during extinction are consistent with human fMRI data.
Using TO2 amperometry as a translational tool for BOLD fMRI
The present study is the first to employ time-resolved hemodynamic measurements in freely-moving rats, but previous studies have measured hemodynamic activity in rats after fear conditioning (LeDoux et al., 1983; Holschneider et al., 2006). For example, using cerebral blood flow (CBF)-autoradiography, Holschneider and colleagues found significantly increased CBF in the lateral amygdala in a fear-conditioned compared with a tone-alone group, but they also found significantly decreased CBF in the anterior BLA and central amygdala (Holschneider et al., 2006). While autoradiographic techniques can image the whole brain, their disadvantage is that they have no temporal resolution and offer only a snapshot of CBF changes in the brief (<1 min) period before the animal is killed. As a result, autoradiographic approaches are incompatible with the types of discriminative fear-conditioning designs used in human fMRI and the present study. In contrast, the TO2 approach used in the present study offers a high temporal resolution signal for studying hemodynamic changes associated with behaviour.
There are strong theoretical and empirical reasons for arguing that TO2 is closely related to BOLD (Zheng et al., 2002; Logothetis, 2007; Lowry et al., 2010). Nevertheless, there are several methodological differences between our approach and human fMRI studies of fear conditioning, including the species and the higher temporal and spatial resolution (but limited spatial sampling) of TO2 compared with BOLD. Importantly, however, our data are consistent with a subset of human fMRI studies that share certain key design features with our study, suggesting that these methodological differences are not critical.
Moreover, the TO2 approach utilized here is applicable to many other areas of neuroscience. Most of our knowledge of the cellular and molecular mechanisms that underlie behavior comes from animal experiments that for ethical and practical reasons are impossible in humans. Thus, animal models offer the best hope for understanding neuronal mechanisms underlying the dysfunctional brain states associated with neurological and psychiatric disorders. Techniques that facilitate comparisons between animal and human research are therefore essential if basic research is to translate to clinical benefits. One of the key advantages of our TO2 approach is that it can be combined with invasive methods, such as genetic modification, brain lesions, local drug infusions and electrophysiology; in other words, the techniques that allow us to uncover neuronal mechanisms. Thus, tissue oxygen amperometry has the potential to improve the translation between rodent models and human neuroimaging.
Conclusion
To conclude, in rats, hemodynamic responses in the BLA, dHPC and vHPV can detect the differential patterns of neuronal activity evoked by threatening vs. neutral stimuli.
Acknowledgments
This study was supported by the Wellcome Trust (Grant No. 074385 and 087736), and by the Biotechnology and Biological Sciences Research Council (BBSRC) and Eli Lilly as part of a University of Oxford CASE studentship. We thank Greg Daubney for his assistance with histology. There are no conflicts of interest associated with this research.
Glossary
Abbreviations
- A–P
anterior–posterior
- BLA
basolateral amygdala
- BOLD
blood oxygen level-dependent
- CBF
cerebral blood flow
- CPE
carbon paste electrode
- CS
conditioned stimulus
- dHPC
dorsal hippocampal
- D–V
dorsal–ventral
- fMRI
functional magnetic resonance imaging
- FPS
fear-potentiated startle
- HPC
hippocampus
- M–L
medial–lateral
- SCR
skin conductance response
- SME
simple main effects
- US
unconditioned stimulus
- vHPC
ventral hippocampal
Conflicts of interest
None.
Supporting Information
Additional supporting information can be found in the online version of this article:
Fig. S1. Behavioral (A) and tissue oxygen (TO2) responses in the basolateral amygdala (BLA; B), dorsal hippocampus (dHPC; C) and ventral hippocampus (vHPC; D) during pre-exposure, training and extinction of Pavlovian fear conditioning. Columns 1–4 show mean responses to the five CS− and five CS+ presentations during each day of phase I (pre-exposure, training I, training II and extinction, respectively). Columns 5 and 6 show responses for the first and last CS+ and CS− trials of extinction (i.e. column 5: CS−1 vs. CS+1; column 6: CS−5 vs. CS+5). (A) Mean (±SEM) percentage freezing during the 30 s of the CS− (blue bars) or CS+ (red bars). (B–D) Mean (±SEM) TO2 change from baseline (ΔTO2) during the 30 s of CS− (blue traces) and CS+ (red traces) in 2-s timebins. n.s., no significant difference in paired t-test, or no main effect of CS or CS × timebin interaction; *significant difference in paired t-test (P < 0.05) or main effect of CS (P < 0.05); #CS × timebin interaction (P < 0.05).
Fig. S2. Freezing responses to the CS− (blue) and CS+ (red) during the last five trials of training. There was no evidence of discriminative freezing (i.e. higher freezing during CS+ trials) during any of the training trials.
References
- Alvarez RP, Biggs A, Chen G, Pine DS, Grillon C. Contextual fear conditioning in humans: cortical-hippocampal and amygdala contributions. J. Neurosci. 2008;28:6211–6219. doi: 10.1523/JNEUROSCI.1246-08.2008. [DOI] [PMC free article] [PubMed] [Google Scholar]
- Armony JL, Dolan RJ. Modulation of spatial attention by fear-conditioned stimuli: an event-related fMRI study. Neuropsychologia. 2002;40:817–826. doi: 10.1016/s0028-3932(01)00178-6. [DOI] [PubMed] [Google Scholar]
- Bach DR, Weiskopf N, Dolan RJ. A stable sparse fear memory trace in human amygdala. J. Neurosci. 2011;31:9383–9389. doi: 10.1523/JNEUROSCI.1524-11.2011. [DOI] [PMC free article] [PubMed] [Google Scholar]
- Boorman L, Kennerley AJ, Johnston D, Jones M, Zheng Y, Redgrave P, Berwick J. Negative blood oxygen level dependence in the rat: a model for investigating the role of suppression in neurovascular coupling. J. Neurosci. 2010;30:4285–4294. doi: 10.1523/JNEUROSCI.6063-09.2010. [DOI] [PMC free article] [PubMed] [Google Scholar]
- Buchel C, Morris J, Dolan RJ, Friston KJ. Brain systems mediating aversive conditioning: an event-related fMRI study. Neuron. 1998;20:947–957. doi: 10.1016/s0896-6273(00)80476-6. [DOI] [PubMed] [Google Scholar]
- Buchel C, Dolan RJ, Armony JL, Friston KJ. Amygdala-hippocampal involvement in human aversive trace conditioning revealed through event-related functional magnetic resonance imaging. J. Neurosci. 1999;19:10869–10876. doi: 10.1523/JNEUROSCI.19-24-10869.1999. [DOI] [PMC free article] [PubMed] [Google Scholar]
- Carter RM, O'Doherty JP, Seymour B, Koch C, Dolan RJ. Contingency awareness in human aversive conditioning involves the middle frontal gyrus. Neuroimage. 2006;29:1007–1012. doi: 10.1016/j.neuroimage.2005.09.011. [DOI] [PubMed] [Google Scholar]
- Cheng DT, Knight DC, Smith CN, Helmstetter FJ. Human amygdala activity during the expression of fear responses. Behav. Neurosci. 2006;120:1187–1195. doi: 10.1037/0735-7044.120.5.1187. [DOI] [PubMed] [Google Scholar]
- Cheng DT, Richards J, Helmstetter FJ. Activity in the human amygdala corresponds to early, rather than late period autonomic responses to a signal for shock. Learn. Mem. 2007;14:485–490. doi: 10.1101/lm.632007. [DOI] [PMC free article] [PubMed] [Google Scholar]
- Davis M. The role of the amygdala in fear and anxiety. Annu. Rev. Neurosci. 1992;15:353–375. doi: 10.1146/annurev.ne.15.030192.002033. [DOI] [PubMed] [Google Scholar]
- Dunsmoor JE, Bandettini PA, Knight DC. Impact of continuous versus intermittent CS-UCS pairing on human brain activation during Pavlovian fear conditioning. Behav. Neurosci. 2007;121:635–642. doi: 10.1037/0735-7044.121.4.635. [DOI] [PubMed] [Google Scholar]
- Fanselow MS, LeDoux JE. Why we think plasticity underlying Pavlovian fear conditioning occurs in the basolateral amygdala. Neuron. 1999;23:229–232. doi: 10.1016/s0896-6273(00)80775-8. [DOI] [PubMed] [Google Scholar]
- Goosens KA, Hobin JA, Maren S. Auditory-evoked spike firing in the lateral amygdala and Pavlovian fear conditioning: mnemonic code or fear bias? Neuron. 2003;40:1013–1022. doi: 10.1016/s0896-6273(03)00728-1. [DOI] [PubMed] [Google Scholar]
- Herry C, Ciocchi S, Senn V, Demmou L, Muller C, Luthi A. Switching on and off fear by distinct neuronal circuits. Nature. 2008;454:600–606. doi: 10.1038/nature07166. [DOI] [PubMed] [Google Scholar]
- Hitchman ML. Measurement of Dissolved Oxygen. New York: John Wiley; 1978. [Google Scholar]
- Holschneider DP, Yang J, Sadler TR, Nguyen PT, Givrad TK, Maarek JM. Mapping cerebral blood flow changes during auditory-cued conditioned fear in the nontethered, nonrestrained rat. Neuroimage. 2006;29:1344–1358. doi: 10.1016/j.neuroimage.2005.08.038. [DOI] [PMC free article] [PubMed] [Google Scholar]
- Iwata J, LeDoux JE, Meeley MP, Arneric S, Reis DJ. Intrinsic neurons in the amygdaloid field projected to by the medial geniculate body mediate emotional responses conditioned to acoustic stimuli. Brain Res. 1986;383:195–214. doi: 10.1016/0006-8993(86)90020-x. [DOI] [PubMed] [Google Scholar]
- Keppel G. Design and Analysis: A Researcher's Handbook. 2nd Edn. London: Prentice-Hall; 1982. [Google Scholar]
- Kim JJ, Rison RA, Fanselow MS. Effects of amygdala, hippocampus, and periaqueductal gray lesions on short- and long-term contextual fear. Behav. Neurosci. 1993;107:1093–1098. doi: 10.1037//0735-7044.107.6.1093. [DOI] [PubMed] [Google Scholar]
- Knight DC, Nguyen HT, Bandettini PA. The role of the human amygdala in the production of conditioned fear responses. Neuroimage. 2005;26:1193–1200. doi: 10.1016/j.neuroimage.2005.03.020. [DOI] [PubMed] [Google Scholar]
- Knight DC, Waters NS, Bandettini PA. Neural substrates of explicit and implicit fear memory. Neuroimage. 2009;45:208–214. doi: 10.1016/j.neuroimage.2008.11.015. [DOI] [PMC free article] [PubMed] [Google Scholar]
- LaBar KS, Gatenby JC, Gore JC, LeDoux JE, Phelps EA. Human amygdala activation during conditioned fear acquisition and extinction: a mixed-trial fMRI study. Neuron. 1998;20:937–945. doi: 10.1016/s0896-6273(00)80475-4. [DOI] [PubMed] [Google Scholar]
- LeDoux JE, Thompson ME, Iadecola C, Tucker LW, Reis DJ. Local cerebral blood flow increases during auditory and emotional processing in the conscious rat. Science. 1983;221:576–578. doi: 10.1126/science.6867731. [DOI] [PubMed] [Google Scholar]
- LeDoux JE, Cicchetti P, Xagoraris A, Romanski LM. The lateral amygdaloid nucleus: sensory interface of the amygdala in fear conditioning. J. Neurosci. 1990;10:1062–1069. doi: 10.1523/JNEUROSCI.10-04-01062.1990. [DOI] [PMC free article] [PubMed] [Google Scholar]
- Li J, Bravo DS, Upton AL, Gilmour G, Tricklebank MD, Fillenz M, Martin C, Lowry JP, Bannerman DM, McHugh SB. Close temporal coupling of neuronal activity and tissue oxygen responses in rodent whisker barrel cortex. Eur. J. Neurosci. 2011;34:1983–1996. doi: 10.1111/j.1460-9568.2011.07927.x. [DOI] [PMC free article] [PubMed] [Google Scholar]
- Logothetis NK. The ins and outs of fMRI signals. Nat. Neurosci. 2007;10:1230–1232. doi: 10.1038/nn1007-1230. [DOI] [PubMed] [Google Scholar]
- Lowry JP, Griffin K, McHugh SB, Lowe AS, Tricklebank M, Sibson NR. Real-time electrochemical monitoring of brain tissue oxygen: a surrogate for functional magnetic resonance imaging in rodents. Neuroimage. 2010;52:549–555. doi: 10.1016/j.neuroimage.2010.04.187. [DOI] [PubMed] [Google Scholar]
- Maren S. Neurobiology of Pavlovian fear conditioning. Annu. Rev. Neurosci. 2001;24:897–931. doi: 10.1146/annurev.neuro.24.1.897. [DOI] [PubMed] [Google Scholar]
- Maren S. Pavlovian fear conditioning as a behavioral assay for hippocampus and amygdala function: cautions and caveats. Eur. J. Neurosci. 2008;28:1661–1666. doi: 10.1111/j.1460-9568.2008.06485.x. [DOI] [PubMed] [Google Scholar]
- Maren S, Holt WG. Hippocampus and Pavlovian fear conditioning in rats: muscimol infusions into the ventral, but not dorsal, hippocampus impair the acquisition of conditional freezing to an auditory conditional stimulus. Behav. Neurosci. 2004;118:97–110. doi: 10.1037/0735-7044.118.1.97. [DOI] [PubMed] [Google Scholar]
- Maren S, Quirk GJ. Neuronal signalling of fear memory. Nat. Rev. Neurosci. 2004;5:844–852. doi: 10.1038/nrn1535. [DOI] [PubMed] [Google Scholar]
- Maren S, Aharonov G, Fanselow MS. Retrograde abolition of conditional fear after excitotoxic lesions in the basolateral amygdala of rats: absence of a temporal gradient. Behav. Neurosci. 1996;110:718–726. doi: 10.1037//0735-7044.110.4.718. [DOI] [PubMed] [Google Scholar]
- McHugh SB, Fillenz M, Lowry JP, Rawlins JN, Bannerman DM. Brain tissue oxygen amperometry in behaving rats demonstrates functional dissociation of dorsal and ventral hippocampus during spatial processing and anxiety. Eur. J. Neurosci. 2011;33:322–337. doi: 10.1111/j.1460-9568.2010.07497.x. [DOI] [PMC free article] [PubMed] [Google Scholar]
- McKernan MG, Shinnick-Gallagher P. Fear conditioning induces a lasting potentiation of synaptic currents in vitro. Nature. 1997;390:607–611. doi: 10.1038/37605. [DOI] [PubMed] [Google Scholar]
- Mechias ML, Etkin A, Kalisch R. A meta-analysis of instructed fear studies: implications for conscious appraisal of threat. Neuroimage. 2010;49:1760–1768. doi: 10.1016/j.neuroimage.2009.09.040. [DOI] [PubMed] [Google Scholar]
- Moita MA, Rosis S, Zhou Y, LeDoux JE, Blair HT. Hippocampal place cells acquire location-specific responses to the conditioned stimulus during auditory fear conditioning. Neuron. 2003;37:485–497. doi: 10.1016/s0896-6273(03)00033-3. [DOI] [PubMed] [Google Scholar]
- Morris JS, Ohman A, Dolan RJ. Conscious and unconscious emotional learning in the human amygdala. Nature. 1998;393:467–470. doi: 10.1038/30976. [DOI] [PubMed] [Google Scholar]
- Morris JS, Buchel C, Dolan RJ. Parallel neural responses in amygdala subregions and sensory cortex during implicit fear conditioning. Neuroimage. 2001;13:1044–1052. doi: 10.1006/nimg.2000.0721. [DOI] [PubMed] [Google Scholar]
- Offenhauser N, Thomsen K, Caesar K, Lauritzen M. Activity-induced tissue oxygenation changes in rat cerebellar cortex: interplay of postsynaptic activation and blood flow. J. Physiol. 2005;565:279–294. doi: 10.1113/jphysiol.2005.082776. [DOI] [PMC free article] [PubMed] [Google Scholar]
- Paxinos G, Watson C. The Rat Brain in Stereotaxic Coordinates. 4th Edn. New York: Academic Press; 1998. [Google Scholar]
- Phelps EA, LeDoux JE. Contributions of the amygdala to emotion processing: from animal models to human behavior. Neuron. 2005;48:175–187. doi: 10.1016/j.neuron.2005.09.025. [DOI] [PubMed] [Google Scholar]
- Phelps EA, Delgado MR, Nearing KI, LeDoux JE. Extinction learning in humans: role of the amygdala and vmPFC. Neuron. 2004;43:897–905. doi: 10.1016/j.neuron.2004.08.042. [DOI] [PubMed] [Google Scholar]
- Phillips RG, LeDoux JE. Differential contribution of amygdala and hippocampus to cued and contextual fear conditioning. Behav. Neurosci. 1992;106:274–285. doi: 10.1037//0735-7044.106.2.274. [DOI] [PubMed] [Google Scholar]
- Quinn JJ, Wied HM, Ma QD, Tinsley MR, Fanselow MS. Dorsal hippocampus involvement in delay fear conditioning depends upon the strength of the tone-footshock association. Hippocampus. 2008;18:640–654. doi: 10.1002/hipo.20424. [DOI] [PubMed] [Google Scholar]
- Quirk GJ, Repa C, LeDoux JE. Fear conditioning enhances short-latency auditory responses of lateral amygdala neurons: parallel recordings in the freely behaving rat. Neuron. 1995;15:1029–1039. doi: 10.1016/0896-6273(95)90092-6. [DOI] [PubMed] [Google Scholar]
- Richmond MA, Murphy CA, Pouzet B, Schmid P, Rawlins JN, Feldon J. A computer controlled analysis of freezing behaviour. J. Neurosci. Methods. 1998;86:91–99. doi: 10.1016/s0165-0270(98)00150-2. [DOI] [PubMed] [Google Scholar]
- Richmond MA, Yee BK, Pouzet B, Veenman L, Rawlins JN, Feldon J, Bannerman DM. Dissociating context and space within the hippocampus: effects of complete, dorsal, and ventral excitotoxic hippocampal lesions on conditioned freezing and spatial learning. Behav. Neurosci. 1999;113:1189–1203. doi: 10.1037/0735-7044.113.6.1189. [DOI] [PubMed] [Google Scholar]
- Rogan MT, Staubli UV, LeDoux JE. Fear conditioning induces associative long-term potentiation in the amygdala. Nature. 1997;390:604–607. doi: 10.1038/37601. [DOI] [PubMed] [Google Scholar]
- Romanski LM, Clugnet MC, Bordi F, LeDoux JE. Somatosensory and auditory convergence in the lateral nucleus of the amygdala. Behav. Neurosci. 1993;107:444–450. doi: 10.1037//0735-7044.107.3.444. [DOI] [PubMed] [Google Scholar]
- Selden NR, Everitt BJ, Jarrard LE, Robbins TW. Complementary roles for the amygdala and hippocampus in aversive conditioning to explicit and contextual cues. Neuroscience. 1991;42:335–350. doi: 10.1016/0306-4522(91)90379-3. [DOI] [PubMed] [Google Scholar]
- Sierra-Mercado D, Padilla-Coreano N, Quirk GJ. Dissociable roles of prelimbic and infralimbic cortices, ventral hippocampus, and basolateral amygdala in the expression and extinction of conditioned fear. Neuropsychopharmacol. 2011;36:529–538. doi: 10.1038/npp.2010.184. [DOI] [PMC free article] [PubMed] [Google Scholar]
- Tabbert K, Stark R, Kirsch P, Vaitl D. Hemodynamic responses of the amygdala, the orbitofrontal cortex and the visual cortex during a fear conditioning paradigm. Int. J. Psychophysiol. 2005;57:15–23. doi: 10.1016/j.ijpsycho.2005.01.007. [DOI] [PubMed] [Google Scholar]
- Tabbert K, Stark R, Kirsch P, Vaitl D. Dissociation of neural responses and skin conductance reactions during fear conditioning with and without awareness of stimulus contingencies. Neuroimage. 2006;32:761–770. doi: 10.1016/j.neuroimage.2006.03.038. [DOI] [PubMed] [Google Scholar]
- Thompson JK, Peterson MR, Freeman RD. Single-neuron activity and tissue oxygenation in the cerebral cortex. Science. 2003;299:1070–1072. doi: 10.1126/science.1079220. [DOI] [PubMed] [Google Scholar]
- van Well S, Visser RM, Scholte HS, Kindt M. Neural substrates of individual differences in human fear learning: evidence from concurrent fMRI, fear-potentiated startle, and US-expectancy data. Cogn. Affect. Behav. Neurosci. 2012;12:499–512. doi: 10.3758/s13415-012-0089-7. [DOI] [PMC free article] [PubMed] [Google Scholar]
- Wilensky AE, Schafe GE, Kristensen MP, LeDoux JE. Rethinking the fear circuit: the central nucleus of the amygdala is required for the acquisition, consolidation, and expression of Pavlovian fear conditioning. J. Neurosci. 2006;26:12387–12396. doi: 10.1523/JNEUROSCI.4316-06.2006. [DOI] [PMC free article] [PubMed] [Google Scholar]
- Zelikowsky M, Pham DL, Fanselow MS. Temporal factors control hippocampal contributions to fear renewal after extinction. Hippocampus. 2012;22:1096–1106. doi: 10.1002/hipo.20954. [DOI] [PMC free article] [PubMed] [Google Scholar]
- Zheng Y, Martindale J, Johnston D, Jones M, Berwick J, Mayhew J. A model of the hemodynamic response and oxygen delivery to brain. Neuroimage. 2002;16:617–637. doi: 10.1006/nimg.2002.1078. [DOI] [PubMed] [Google Scholar]
Associated Data
This section collects any data citations, data availability statements, or supplementary materials included in this article.