Abstract
Background:
To compare the usefulness of the traditional pattern-reversal Visual Evoked Potentials (VEP) with multifocal VEP (mfVEP) and Frequency-Doubling Technology (FDT) perimetry in the evaluation of the ocular abnormalities induced by acute or subacute optic neuritis (ON).
Materials and Methods:
The test results of 24 ON patients were compared with those obtained in 40 normal control subjects. MfVEP recordings were obtained by using an Optoelectronic Stimulator that extracts topographic VEP using a pseudorandom m-sequence stimulus. Receiver operator characteristic (ROC) curves were calculated to determine the sensitivity and specificity of abnormal values.
Results:
The frequency of the abnormal ocular findings differed in the ON patients according to the used technique. Reduced visual sensitivity was demonstrated in 12 eyes (54.5%) using FDT perimetry; 17 eyes (77.2%) showed decreased amplitude and/or an increase in the implicit time of the P1 wave in mfVEP and 20 eyes (90.9%) showed an abnormal decrease in the amplitude and/or an increase in the latency of the P100 peak at VEP examination. The areas under the ROC curves ranged from 0.743 to 0.935, with VEP having the largest areas. The VEP and mfVEP amplitudes and latencies yielded the greatest sensitivity and specificity.
Conclusions:
The mfVEP and the FDT perimetry can be used for the evaluation and monitoring of visual impairment in patients with ON. The most sensitive and practical diagnostic tool in patients with ON is, however, the traditional VEP. The mfVEP can be utilized in those cases with doubtful or negative VEP results.
Keywords: Frequency-doubling technology perimetry, multifocal visual evoked potentials, optic neuritis, pattern-reversal visual evoked potentials
The traditional pattern-reversal Visual Evoked Potentials (VEP) are electrophysiological potentials obtained from the electroencephalographic activity recorded from the scalp. VEP recordings are generally regarded as an effective and objective test of the integrity of the visual system, and are able to assess damage in eyes with localized visual field defects. The results are less variable in waveform and timing than the results elicited by other stimuli. Some specialized types of VEP are not covered by the International Society for Clinical Electrophysiology of Vision (ISCEV) standards, but they provide important clinical information and can be performed by most of the world's clinical laboratories.[1,2] The multifocal VEP (mfVEP) recording technique, based on the second-order kernel analysis, was developed in 1994 to record VEP simultaneously from multiple locations of the visual field.[3] Different study groups have already used the mfVEP in normal subjects and in patients with diseases such as glaucoma and optic neuropathy.[4–12] Acute or subacute optic neuritis (ON) is characterized by a specific pattern of optic nerve and visual field damage due to the death of retinal ganglion cells, or to inflammation and demyelination of the optic nerve. Some authors have shown that the mfVEP provides a topographical measure of the damage in various optic nerve diseases and can be compared with visual fields obtained by standard automated perimetry (SAP).[4,11,13]
In this study, we compared the responses to visual stimuli recorded in ON patients with those obtained in a healthy population sample to determine whether differences in detection, threshold variation, and frequency modification might be the result of stimulus artifacts or if they could be utilized for evaluating ON patients. To the best of our knowledge, VEP, mfVEP, and Frequency-Doubling Technology (FDT) perimetry techniques have never been compared in the evaluation of ON patients. The aim of this study was also to assess the sensitivity and specificity of these three exams in detecting ON-associated abnormalities in patients with acute and/or subacute disease.
Materials and Methods
Twenty-four eyes of 24 patients (10 males, 14 females), with ON confirmed by a consultant neuro-ophthalmologist, were studied.
The work protocol included patients with:
unilateral vision loss (14 right eyes and 10 left eyes);
pain on eye movements;
normal cranial and spinal cord magnetic resonance imaging;
normal or abnormal optic disc;
spherical refractive error < ± 6 diopters, astigmatism < ± 3 diopters; and
best-corrected visual acuity (BCVA) as measured with Snellen and Early Treatment Diabetic Retinopathy Study (ETDRS) charts [logarithm of minimal angle of resolution (logMAR)] of more than 14/20 [Table 1].
Table 1.
Baseline demographic details of the 24 patients (24 eyes)
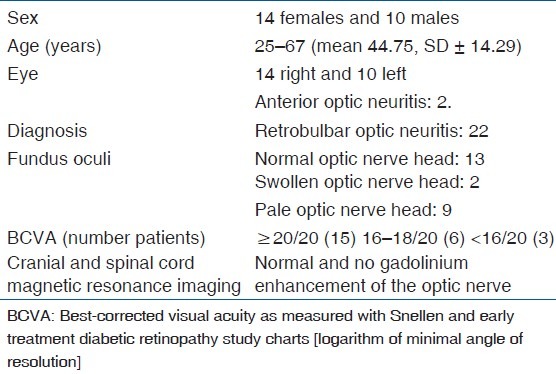
The ON patients were classified as not-multiple sclerosis (MS) using the McDonald criteria.[14] Exclusion criteria included patients with any progressive neurological syndrome, neurosyphilis, neurosarcoidosis, Leber's optic neuropathy, compressive optic neuropathy, myelopathy, and other systemic diseases. Patients with history of ocular surgery or other ocular diseases such as cataract, keratitis, hypertension, glaucoma, retinal abnormalities, ischemic optic neuropathy, or toxic/metabolic ON were also excluded. The mean age of the patients was 44.75 ± 14.29 years (range 25–67 years). The study was undertaken in compliance with the Helsinki Declaration and an informed consent from patients was obtained before enrollment. The study protocol was approved by the Ethical Committee, University Sapienza of Rome. Forty normal control subjects (20 males and 20 females), with a mean age of 39.54 ± 12.59 years (range 23–60 years) and without a history of ocular or systemic disease were recruited from the community.
ON patients and control subjects underwent full ophthalmic and neurologic examination. In order to minimize the learning effect, the patients were recalled for a follow-up assessment the next day. There was no significant difference between the test at baseline and at follow-up. In all cases, the first test was not used for the analysis.
The VEP recording was performed at 100 cm distance, with the optoelectronic stimulator Vision Monitor MonPack 120 by Metrovision (Pérenchies, France) with reference to the ISCEV guidelines.[1,2] The values of the amplitude and latency of VEP were studied at different angular dimensions of the stimulus (120′, 60′, and 15′, respectively, for stimuli with small, median, and great spatial frequencies of stimulation). VEP were characterized by a series of N75, P100, and N135 peaks, each characterized by an amplitude and latency. To record the VEP, three active skin electrodes were located on the scalp along the midline (over the inion) and on lateral positions (right and left).
The Humphrey FDT Matrix perimetry is a contrast threshold psychophysical test with a more complex target than the standard threshold automated perimetry.[15–17] Its target consists of a low spatial frequency (0.50 cpd) pattern, in combination with a high temporal frequency (18 Hz) stimulus and a mean luminance of 50 cd/m2. Each target is 5° × 5° square, except for the central target which is a 5° diameter circle. A video display unit presents the patient with a stimulus that is a monochrome sinusoidal grating of vertical black and white bars. These bars undergo rapid counterphase flickering (rate of 18 times per second). A total of 69 stimulus locations are shown, 17 in each quadrant and 1 in the macula for the 30-2 threshold program. Each target preferentially stimulates the magnocellular (M-cells) pathway.[15–18] The FDT perimetry uses a modified binary search scale in which the contrast of the frequency doubling stimulus is increased if the target is not seen and decreased if the target is seen. A severe defect is reported when a target, presented for the fourth time, at maximum contrast, is not seen.
The age of the subject is entered so that the instrument can choose expected values of contrast from an age-normalized database. The output data from the FDT perimetry includes number, location, and severity of the defects in the 69 target zones. Readings appear as a numerical table and as probability maps with five gray tones.[16,18]
The mfVEP was performed at 33 cm distance, with an alternated 35 program on the optoelectronic stimulator Vision Monitor MonPack 120 by Metrovision. The test requires a voluntary participation and a high degree of compliance of the patient for the detection and localization of defects in an area of the visual field.[3] The pattern-reversal stimulation consisted of a checkerboard stimulus with eight black checks which switch to white and vice versa. The stimulus frequency was set at 17 Hz to optimize the amplitude of responses. The four recording channels were located as follows: 4 cm above the inion, at the inion, and at 4 cm to the right and left of the inion. Electrophysiological recordings were collected using monocular stimulation, with correction for near vision if required. Monitoring of fixation based on the Hirschberg principle (position of the corneal reflex in relation to the center of the pupil) was conducted with the infrared refractor camera. The response is rejected if the eye deviates from the reference position by more than 1.6° or if the eye blinks. The modes of stimulation were used to simulate an array covering the central 25° of the retina and were cortically scaled. The number of zones was 35. The program determines automatically the best response from the four channels for each stimulus location. The implicit time is based on the vector product between each response and a model of this response that is calculated from the average of the responses obtained at the same eccentricity. This analysis is theoretically less sensitive to noise. The different analyses were done using: the average responses in each of five areas (center, superior-left, superior-right, inferior-left, and inferior-right), the average responses over a group of up to four rings from 0° to 15°, a histogram of average amplitudes of the N1, P1, and N2 peaks for each zone, and several visualization modes presented with 2D and 3D maps. The Root Mean Square (RMS) analysis characterizes the energy content of each response. The result is the summation of signal and noise components.
The VEP amplitude and latency, mfVEP amplitude and implicit time, and the FDT values were analyzed and compared to the normal controls. Criteria for abnormal VEP responses included values differing 2 SD from the normal average at different angular dimensions of the stimulus and abnormal areas examined at the mfVEP/FDT.
The affected eye in the ON population and the right eye in the control group were used in the statistical analysis performed with the means of the Student's “t” test. P values <0.05 were considered significant. Receiver operator characteristic (ROC) curves were constructed describing sensitivity and specificity of abnormal values in the control group versus patients, with optimal cut-off points chosen among normal and abnormal responses.
Results
No abnormality in VEP, mfVEP, and FDT exams was recorded in the control group.
The results obtained in two ON patients (16 and 18) were discarded from the statistical analysis because of the high noise level at mfVEP. The remaining 22 eyes showed abnormal results in a percentage varying according to the method used. [An example of the abnormal response of the various tests have been shown in Figs. 1a and b, 2a and b].
Figure 1.
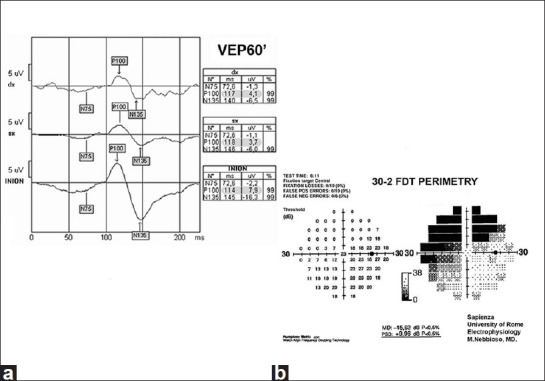
(a) Abnormal decrease and delay at VEP in the median spatial frequencies. (b) Abnormal decrease of response densities in the nasal-superior, temporal-superior, and nasal-inferior quadrants at FDT perimetry
Figure 2.
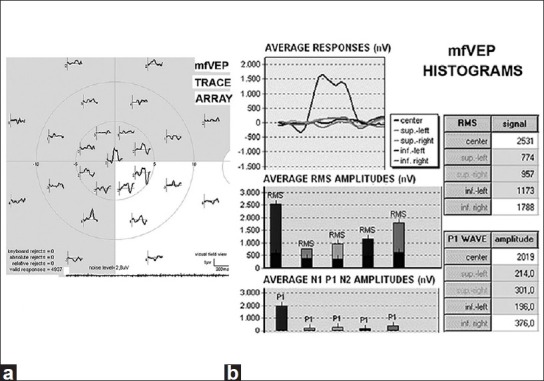
Abnormal decrease and delay at mfVEP. (a) Trace array. (b) Average responses of RMS signals and amplitude, P1 waves, in histograms
A marked relative afferent pupillary defect (APD) was seen in three cases. The rest displayed only a subtle APD.
The FDT perimetry showed focal abnormalities in 12 eyes (54.5%). The mfVEP showed reduction in the amplitude and/or an increase in the implicit time of the P1 wave in 17 eyes (77.2%). With the VEP examination, 20 eyes (90.9%) showed an abnormal decrease in the amplitude and/or abnormal increase in the latency of the P100 peak. When the data of the FDT perimetry, VEP, and mfVEP was compared, 10 eyes showed abnormalities with both the FDT perimetry and the mfVEP, and 16 showed abnormalities with both VEP and mfVEP. VEP was normal in one eye and mfVEP was normal in one eye. One eye displayed abnormality only in the mfVEP.
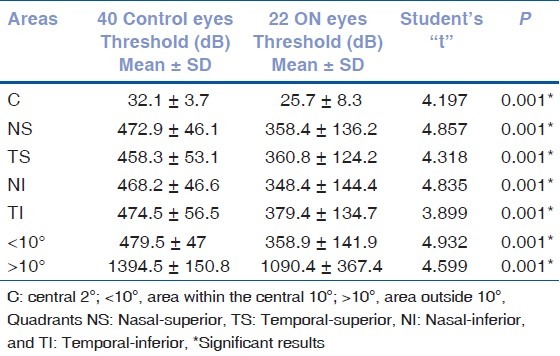
Table 2 compares the results of both VEP amplitude and latency in ON patients and controls. Tables 3 and 4 compare mfVEP and FDT values obtained in the controls with those obtained in the ON eyes measured, respectively, in the center (C), in the area within the central 10°, in the area outside 10°, and in each of the four quadrants.
Table 2.
Statistical analysis of VEP amplitude and latency results (P100 wave)
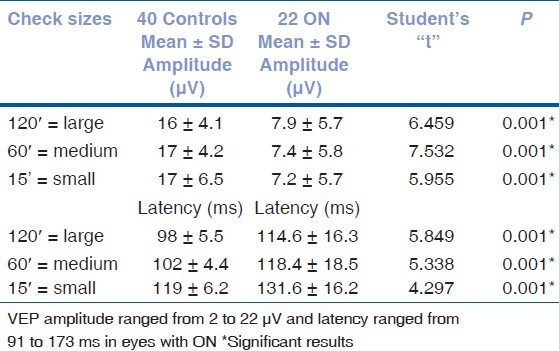
Table 3.
Statistical analysis of multifocal VEP amplitude and implicit time results
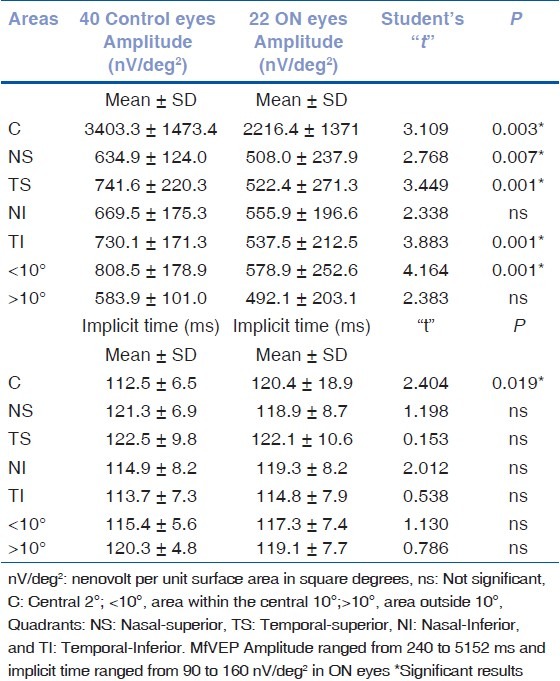
Table 4.
Statistical analysis of frequency doubling technology matrix values threshold results (clusters)
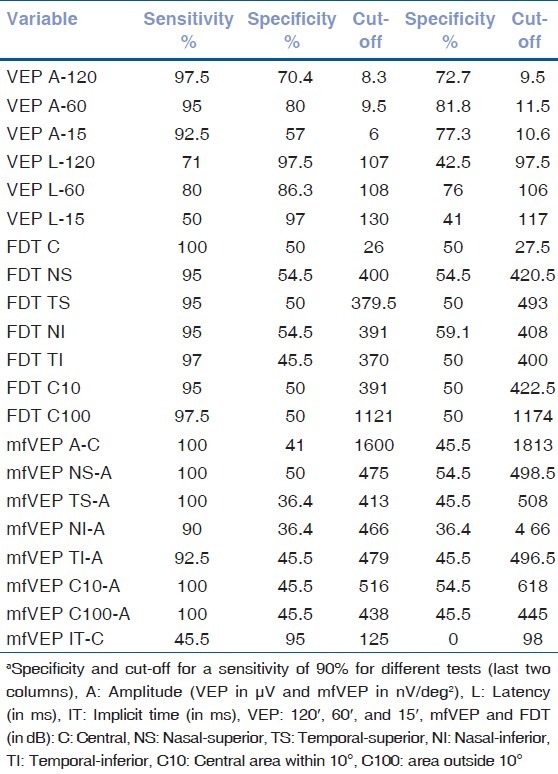
The results from the 22 ON patients and 40 controls were used to construct ROC curves for the three tests. The proportion of eyes classified as abnormal or true-positive rate (sensitivity) was plotted against the proportion of control eyes classified as abnormal or false-positive rate (1-specificity). The curves were constructed by varying the cut-offs defining abnormal amplitude, latency, implicit time, and cluster. The areas under the ROC curve ranged from 0.430 to 0.935, with the VEP (120′, 60′, and 15′) having the largest areas (from 0.743 to 0.935) [Fig. 3]. The VEP and mfVEP (amplitudes and latencies) yielded the greatest sensitivity and specificity ratio as seen in Table 5. In particular, for a sensitivity of 90%, VEP amplitudes 60′/15′/120′ and VEP latency 60′ had specificities of 81.8, 77.3, 72.7, and 76%, respectively [Table 5]. The areas under the ROC curves ranged from 0.430 to 0.791 for the mfVEP (amplitudes and implicit times) and from 0.713 to 0.777 for the FDT (clusters).
Figure 3.
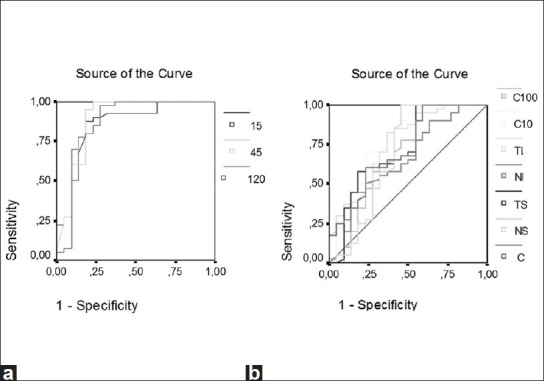
Areas under the receiver operator characteristic (ROC) curves for visual evoked potentials (VEP) (a) and mfVEP (b) exams. The areas under the ROC curves range from 0.430 to 0.935, with the VEP and multifocal VEP showing the largest areas
Table 5.
Sensitivity, specificity, and optimal cut-off point chosan between normal and abnormal values for different testsa
Discussion
The purpose of the present study was to investigate and to compare the results of the mfVEP, VEP, and FDT perimetry in ON patients.
High sensitivity and specificity of the FDT perimetry compared to that of threshold SAP was reported in some studies for detecting early moderate and advanced glaucomatous loss[16–19] and for subclinical visual involvement in MS.[20] Indeed, FDT perimetry shows less intertest and intratest variability when compared to SAP, possibly due to the larger stimulus size (5° vs. 0.43°) used.[19] The large stimulus and FDT paradigm are thought by many investigators (e.g. Maddess)[15] to preferentially stimulate the magnocellular system. Therefore, the prevailing response is that obtained beyond the central 10° of the visual field. They do not determine the retinal or neural injured site and cannot be used for patients who do not cooperate and/or lack fixation.[13,16–18]
The pattern VEP preferentially stimulates the ganglion cells of the parvocellular system (75–95% of the neural system), and therefore the prevailing response is that within the central 10°, corresponding to the macular area. This helps in detecting visual damage anywhere along the pathway from the retina to the visual cortex; consequently, VEP indiscriminately records the signals from the entire anterior visual pathway.[1,2]
The mfVEP stimulates both the magnocellular and the parvocellular systems corresponding to the central 24°. It allows the determination of the presence of visual damage and the involved area, but does not examine the blind spot and cannot be used when vision is too low. In fact, as for automated perimetry, the attention and central fixation of the patients are mandatory. Besides, the mfVEP requires a prolonged and precise application of the electrodes to the skin before performing the examination and the test in its current form lasts approximately 1 h for both eyes. Poor mfVEP recording may derive from muscle tension-associated noise or extensive alpha EEG waves' generation.[12] The electric signal recorded with the mfVEP is prevalently present in the central area and it is less represented in the different quadrants even when using cortically scaled stimuli.[6,12]
It has recently been observed that mfVEP and VEP median implicit times improved in the long term in a substantial percentage of ON patients, while the visual fields obtained with SAP remained unchanged.[21–23] Moreover, other authors observed delayed mfVEP responses in ON patients in regions with normal visual field sensitivity.[8] These delayed responses identified regions of the optic nerve that were altered[8] but where remyelination could occur.[7,14] In our study, the FDT detected abnormal responses in a lower percentage of ON patients compared to VEP and mfVEP. Generally, the agreement between the two functional tests, VEP and mfVEP, was stronger than the agreement between the psychophysical (FDT) and individual functional tests.[24]
Although it is clear that the mfVEP is an evolving technology and can detect damage missed with the automated perimetry, the opposite may also be true, since the relative advantage of the mfVEP varies with the recording characteristics, as already mentioned.[5,6,8,11,12]
Although mfVEP does not reduce the need for SAP, its now obvious[22–24] efficacy in detecting early damage in ON has proven in our hands to be a useful clinical tool, detecting damage in as much as 77% of ON patients, and may be improved technically in the future. Besides evaluating patients with unreliable or questionable automated perimetry, the mfVEP and VEP can be used for diagnosing ON and observing disease progression.[7,8,12]
It has recently been reported that the mfVEP is able to recognize a high percentage (from 89 to 94.7%) of cases of ON in comparison to the VEP (from 73 to 84.2%).[22,23] It remains to be seen if mfVEP is helpful in detecting subclinical events, as it does for eyes of MS patients that never had a manifest ON.[24] Another advantage of the mfVEP is its potential to detect subclinical demyelination, indicated by prolonged latencies in local areas.[24]
Our results, however, demonstrate that VEP and mfVEP yielded the greatest sensitivity and specificity. Comparisons with other published studies may be, however, biased by different investigative conditions.
As far as the results of VEP and mfVEP are concerned, there is not a lot of difference and probably insignificant difference. The cost consideration and the time needed for mfVEP will not make this an attractive investigation in ON.
At present, the clinical work-up and follow-up of ON patients should include firstly the conventional VEP and automated perimetry that are readily available in most centers. MfVEP may be added in those cases with early ON or with doubtful or negative test results on the previous tests. Our future studies should compare test utility longitudinally in ON patients in order to understand the processes involved in the neuronal damage.
Acknowledgment
The authors wish to thank Dr. Fiammetta Lenarduzzi for his language revision of the manuscript.
Footnotes
Source of Support: Nil.
Conflict of Interest: No.
References
- 1.Brigell M, Bach M, Barber C, Moskowitz A, Robson J. Calibration Standard Committee of the International Society for Clinical Electrophysiology of Vision. Guidelines for calibration of stimulus and recording parameters used in clinical electrophysiology of vision. Doc Ophthalmol. 2003;107:185–93. doi: 10.1023/a:1026244901657. [DOI] [PubMed] [Google Scholar]
- 2.Odom JV, Bach M, Brigell M, Holder GE, McCulloch DL, Tormene AP, et al. ISCEV standard for clinical visual evoked potentials (2009 update) Doc Ophthalmol. 2010;120:111–9. doi: 10.1007/s10633-009-9195-4. [DOI] [PubMed] [Google Scholar]
- 3.Baseler HA, Sutter EE, Klein SA, Carney T. The topography of visual evoked response properties across the visual field. Electroencephal Clin Neurophysiol. 1994;90:65–81. doi: 10.1016/0013-4694(94)90114-7. [DOI] [PubMed] [Google Scholar]
- 4.Klistorner AI, Graham SL, Grigg JR, Billson FA. Multifocal topographic visual evoked potential: improving objective detection of local visual field defects. Invest Ophthalmol Vis Sci. 1998;39:937–50. [PubMed] [Google Scholar]
- 5.Hood DC, Zhang X, Greenstein VC, Kangovi S, Odel JG, Liebmann JM, et al. An interocular comparison of the multifocal VEP: A possible technique for detecting local damage to the optic nerve. Invest Ophthalmol Vis Sci. 2000;41:1580–7. [PubMed] [Google Scholar]
- 6.Klistorner AI, Graham SL, Grigg J, Balachandran C. Objective perimetry using the multifocal visual evoked potential in central visual pathway lesions. Br J Ophthalmol. 2005;89:739–44. doi: 10.1136/bjo.2004.053223. [DOI] [PMC free article] [PubMed] [Google Scholar]
- 7.Fraser CL, Klistorner A, Graham SL, Garrick R, Billson FA, Grigg JR. Multifocal visual evoked potential analysis of inflammatory or demyelinating optic neuritis. Ophthalmology. 2006;113:323.e1–323.e2. doi: 10.1016/j.ophtha.2005.10.017. [DOI] [PubMed] [Google Scholar]
- 8.Hood DC, Odel JG, Zhang X. Tracking the recovery of local optic nerve function after optic neuritis: A multifocal VEP study. Invest Ophthalmol Vis Sci. 2000;41:4032–8. [PubMed] [Google Scholar]
- 9.Betsuin Y, Mashima Y, Ohde H, Inoue R, Oguchi Y. Clinical application of the multifocal VEPs. Curr Eye Res. 2001;22:54–63. doi: 10.1076/ceyr.22.1.54.6982. [DOI] [PubMed] [Google Scholar]
- 10.Hasegawa S, Abe H. Mapping of glaucomatous visual field defects by multifocal VEPs. Invest Ophthalmol Vis Sci. 2001;42:3341–8. [PubMed] [Google Scholar]
- 11.Hood DC, Greenstein VC, Odel JG, Zhang X, Ritch R, Liebmann JM, et al. Visual field defects and multifocal visual evoked potentials: Evidence for a linear relationship. Arch Ophthalmol. 2002;120:1672–81. doi: 10.1001/archopht.120.12.1672. [DOI] [PubMed] [Google Scholar]
- 12.Hood DC, Greenstein VC, Odel JG, Zhang X, Ritch R, Liebmann JM, et al. The multifocal VEP and ganglion cell damage: applications and limitations for the study of glaucoma. Prog Retin Eye Res. 2003;22:201–51. doi: 10.1016/s1350-9462(02)00061-7. [DOI] [PubMed] [Google Scholar]
- 13.Hood DC, Thienprasiddhi P, Greenstein VC, Winn BJ, Ohri N, Liebmann JM, et al. Detecting Early to Mild Glaucomatous Damage: A Comparison of the Multifocal VEP and Automated Perimetry. Invest Ophthalmol Vis Sci. 2004;45:492–8. doi: 10.1167/iovs.03-0602. [DOI] [PubMed] [Google Scholar]
- 14.McDonald WI, Compston A, Edan G, Goodkin D, Hartung HP, Lublin FD, et al. Recommended diagnostic criteria for multiple sclerosis: guidelines from the International Panel on the diagnosis of multiple sclerosis. Ann Neurol. 2001;50:121–7. doi: 10.1002/ana.1032. [DOI] [PubMed] [Google Scholar]
- 15.Maddes T, Henry GH. Performance of nonlinear visual units in ocular hypertension and glaucoma. Clin Vis Sci. 1992;7:371–83. [Google Scholar]
- 16.Quigley HA. Identification of glaucoma-related visual field abnormality with the screening protocol of frequency doubling technology. Am J Ophthalmol. 1998;125:819–29. doi: 10.1016/s0002-9394(98)00046-4. [DOI] [PubMed] [Google Scholar]
- 17.Allen CS, Sponsel WE, Trigo Y, Dirks MS, Flynn WJ. Comparison of the frequency doubling technology screening algorithm and the Humphrey 24-2 SITA-FAST in a large eye screening. Clin Experiment Ophthalmol. 2002;30:8–14. doi: 10.1046/j.1442-9071.2002.00478.x. [DOI] [PubMed] [Google Scholar]
- 18.Nebbioso M, Gregorio FD, Prencipe L, Pecorella I. Psychophysical and electrophysiological testing in ocular hypertension. Optom Vis Sci. 2011;88:E928–39. doi: 10.1097/OPX.0b013e31821c6ca4. [DOI] [PubMed] [Google Scholar]
- 19.Spry PG, Johnson CA, McKendrick AM, Turpin A. Variability components of standard automated perimetry and frequency-doubling technology perimetry Invest. Ophthalmol Vis Sci. 2001;42:1404–10. [PubMed] [Google Scholar]
- 20.Sisto D, Trojano M, Vetrugno M, Trabucco T, Iliceto G, Sborgia C. Subclinical visual involvement in multiple sclerosis: A study by MRI, VEPs, frequency-doubling perimetry, standard perimetry, and contrast sensitivity. Invest Ophthalmol Vis Sci. 2005;46:1264–8. doi: 10.1167/iovs.03-1213. [DOI] [PubMed] [Google Scholar]
- 21.Yang ED, Hood DC, Rodarte C, Zhang X, Odel JG, Behrens MM. Improvement in conduction velocity after optic neuritis measured with the multifocal VEP. Invest Ophthalmol Vis Sci. 2007;48:692–8. doi: 10.1167/iovs.06-0475. [DOI] [PubMed] [Google Scholar]
- 22.Klistorner A, Fraser C, Garrick R, Graham S, Arvind H. Correlation between full-field and multifocal VEPs in optic neuritis. Doc Ophthalmol. 2008;116:19–27. doi: 10.1007/s10633-007-9072-y. [DOI] [PubMed] [Google Scholar]
- 23.Grover LK, Hood DC, Ghadiali Q, Grippo TM, Wenick AS, Greenstein VC, et al. A comparison of multifocal and conventional visual evoked potential techniques in patients with optic neuritis/multiple sclerosis. Doc Ophthalmol. 2008;117:121–8. doi: 10.1007/s10633-007-9112-7. [DOI] [PMC free article] [PubMed] [Google Scholar]
- 24.Laron m, Cheng H, Zhang B, Schiffman JS, Tang RA, Frishman LJ. Comparison of multifocal visual evoked potential, standard automated perimetry and optical coherence tomography in assessing visual pathway in multiple sclerosis patients. Mult Scler. 2010;16:412–26. doi: 10.1177/1352458509359782. [DOI] [PMC free article] [PubMed] [Google Scholar]


