

Abstract
Metabolomic profiling of prostate cancer (PCa) progression identified markedly elevated levels of sarcosine (N-methyl glycine) in metastatic PCa and modest but significant elevation of the metabolite in PCa urine. Here, we examine the role of key enzymes associated with sarcosine metabolism in PCa progression. Consistent with our earlier report, sarcosine levels were significantly elevated in PCa urine sediments compared to controls, with a modest area under the receiver operating characteristic curve of 0.71. In addition, the expression of sarcosine biosynthetic enzyme, glycine N-methyltransferase (GNMT), was elevated in PCa tissues, while sarcosine dehydrogenase (SARDH) and pipecolic acid oxidase (PIPOX), which metabolize sarcosine, were reduced in prostate tumors. Consistent with this, GNMT promoted the oncogenic potential of prostate cells by facilitating sarcosine production, while SARDH and PIPOX reduced the oncogenic potential of prostate cells by metabolizing sarcosine. Accordingly, addition of sarcosine, but not glycine or alanine, induced invasion and intravasation in an in vivo PCa model. In contrast, GNMT knockdown or SARDH overexpression in PCa xenografts inhibited tumor growth. Taken together, these studies substantiate the role of sarcosine in PCa progression.
Introduction
Prostate cancer (PCa) afflicts one in nine men over the age of 65 and represents the most commonly diagnosed cancer in American men [1]. Although radiation and surgery are generally effective for the majority of men, prognosis remains poor in patients with progressive disease. A distinct set of genes, proteins, and metabolites orchestrates cancer progression from precursor lesion to localized disease and finally to metastatic cancer [2]. Although gene and protein expression profiles have been extensively studied in PCa, little is known about the global metabolomic alterations. Disease-specific metabolites represent the effective end points of the molecular pathways that are initiated at genomic, transcriptomic, and proteomic levels [3] and may serve as valuable biomarkers.
In our initial study [4], we profiled approximately 1126 metabolites across 262 prostate-derived clinical samples and found that levels of sarcosine, an N-methyl derivative of the amino acid glycine, increased progressively in benign, localized PCa and metastatic disease. Subsequent studies from Jentzmik et al. confirmed elevated levels of tissue-associated sarcosine in prostate tumors compared to benign prostate [5]. In addition, our profiling study also reported elevated sarcosine levels in post-digital rectal examination (DRE) urine specimens (sediment and supernatant) from biopsy-positive PCa patients compared to biopsy-negative controls, with an area under curve (AUC) of 0.67. On the basis of this modest discriminatory power, we had nominated sarcosine as a candidate for validation and as a potential marker for inclusion into a multiplex biomarker panel for PCa detection. Since then, multiple cross-institutional validation studies to evaluate the discriminatory power of urinary sarcosine have been carried out [6–8]. Importantly, the three major studies that have used at least 50 or more samples in their validation efforts reported identical AUC for sarcosine in the range of 0.65 to 0.68 confirming our published results [6–8]. In all of these cases, sarcosine performs modestly better than serum prostate-specific antigen (PSA) in detecting biopsy-positive PCa in a clinically challenging PSA range of 4 to 10 ng/ml, while the free/total PSA ratio (%fPSA), when used as a measure, was shown to be a better predictor in the European study [9]. Furthermore, when used in a multiplex setting, sarcosine improved the overall AUC of a multiplex biomarker panel [7], consistent with our initial prediction. A recent study in individuals with serum PSA levels < 4 ng/ml demonstrated a higher predictive value for serum-associated sarcosine in detecting PCa compared to total PSA or % fPSA [10]. Within this nested PSA-controlled subset, serum sarcosine levels were significantly higher in patients with high-grade tumors. This diagnostic ability for sarcosine was also evident in yet another independent study that reported significantly elevated levels of the metabolite in presurgical urine specimens of PCa patients who developed early biochemical recurrence [11]. Together, these findings substantiate our published data describing sarcosine as an oncometabolite in PCa [4]. In addition to highlighting its ability to detect PCa, here we characterize the role of sarcosine in modulating the tumorigenic properties of PCa cells in vitro. Further, we used an independent cohort of clinical samples to validate the modest potential of sarcosine to detect PCa at biopsy and characterized the oncogenic potential of the metabolite in a xenograft model.
An overview of the sarcosine pathway is shown in Figure 1A. The major enzymes regulating sarcosine metabolism are glycine N-methyltransferase (GNMT), sarcosine dehydrogenase (SARDH), and l-pipecolic acid oxidase (PIPOX). In cells, sarcosine (N-methyl glycine) is generated by the enzymatic transfer of a methyl group from S-adenosylmethionine (SAM) to glycine with the concomitant production of S-adenosylhomocysteine (SAH). This reaction is catalyzed by the enzyme GNMT that is expressed at high levels in mammalian liver, exocrine pancreas, and prostate [12,13] (Figure 1A). The sarcosine-metabolizing enzymes, SARDH and PIPOX, catalyze the oxidative demethylation of sarcosine converting it back to glycine [14,15] (Figure 1A). Using both in vitro and in vivo preclinical models, this study validates sarcosine as an oncometabolite in PCa.
Figure 1.
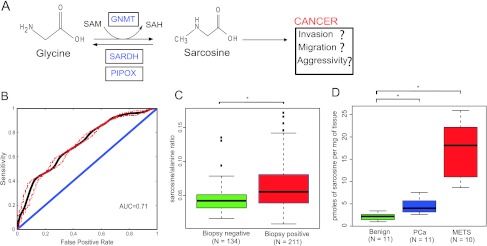
Levels of sarcosine and its pathway enzymes in PCa progression. (A) Schematic representation of the sarcosine pathway and its potential role in PCa. (B) Receiver operating characteristic curve for sarcosine in the 345 urine sediments from 211 biopsy-positive and 134 biopsy-negative individuals. Sarcosine has an AUC of 0.71. (C) Box plot showing significantly (P < .0001) higher levels of sarcosine relative to alanine in urine sediments from biopsy-proven PCa and prostate biopsy-negative controls. (D) Box plot showing progressive elevation of sarcosine during progression from benign to localized (PCa) to MET samples (benign vs PCa, P = .0006 and benign vs METS, P < .00001).
Materials and Methods
Clinical Specimens and Processing
Benign prostate and localized PCa tissues were obtained from a radical prostatectomy series at the University of Michigan Hospitals; metastatic PCa biospecimens (MET) were retrieved from the Rapid Autopsy Program, both of which are part of the University of Michigan Prostate Cancer Specialized Program of Research Excellence Tissue Core. Samples were collected with informed consent and prior Institutional Review Board approval at the University of Michigan (Ann Arbor, MI). Urine specimens were collected from patients screened in the urology clinic for PCa. The median age of these patients was 62.57 ± 8.14, who had clinically significant levels of PSA (8.59 ± 6.30). Urine was collected post-DRE and before biopsy. In addition, urine from patients undergoing prostatectomy, collected before surgery, was used as a positive control. In total, 652 urine specimens were examined in this study, which included 168 biopsy-negative, 261 biopsy-positive, and 210 radical retropubic prostatectomy (RRP) specimens. Six specimens from individuals with high-grade prostatic intraepithelial neoplasia (HGPIN) and seven samples from individuals with undetermined diagnosis were excluded from the study during data analysis. Further, as described later, urine samples with an alanine ratio greater than 2.5 were also excluded from the analysis. Thus, overall 507 urine specimens were used to examine the ability of sarcosine to distinguish PCa from controls at biopsy.
Frozen tissue, cell line pellets, or urine sediments were homogenized in methanol after spiking with labeled internal standards (D3-sarcosine for tissues and cell lines and D3-alanine and D3-sarcosine for urine sediments) and extracted overnight at 4°C, with constant shaking. The extraction was carried using 1:1 molar ratio of water/chloroform at room temperature. The aqueous methanolic layer was collected and dried completely. The dried methanolic extract was azeotroped twice by adding 100 µl of dimethylformamide, mixed by vortexing, and dried using a Speed Vac for 30 minutes. One hundred µl of dimethylformamide and N-methyl-N-tert-butylmethylsilyltrifluoroacetamide + 1% t-butyl-dimethylchlorosilane were then added to the dried sample, capped, and incubated at 60°C for 1 hour. Following this, the sample was resuspended in ethyl acetate and injected into a gas chromatograph-mass spectrometer. Selective ion monitoring was used for quantification. Importantly, both these metabolites were baseline separated before their quantification. The amount of sarcosine and alanine in the sample was calculated by measuring the peak area of the native sarcosine and alanine (both having m/z = 232) to that corresponding to spiked isotope-labeled sarcosine and alanine (both m/z = 235; Figure W1, A and B), as described in our previous study [4]. Following this, for tissues, the level of sarcosine was normalized to the tissue weight. In case of urine sediments, a ratio of normalized sarcosine to normalized alanine was derived. Urine specimens having normalized alanine levels (m/z = 232/235) > 2.5-fold were removed and not used for further analysis. This resulted in a total of 134 biopsy-negative, 211 biopsy-positive, and 162 RRP samples that were used to evaluate the biomarker potential of sarcosine. To evaluate the accuracy and limit/linearity of detection of sarcosine, we performed replicate experiments (technical and biologic) as well as developed a calibration curve for the metabolite in urine sediments (Figure W2, A and B, calibration curve for alanine and sarcosine and Figure W2, C and D, technical and biologic replicate measurements).
Plasmids, Cell Lines, and Cell Culture
Mammalian expression construct of SARDH and PIPOX were generated by subcloning the polymerase chain reaction (PCR) product into the pEF vector using Not1 and Xba1 sites. Full-length GNMT was cloned in lentiviral vector backbone FUGW (kindly gifted by David Baltimore Laboratory, Pasadena, CA) and virus generated for further transduction. The primers used are listed in Table W1. The benign immortalized prostate cell line RWPE and PCa cell lines DU145, PC3, and LNCaP were obtained from the American Type Culture Collection (ATCC, Manassas, VA). DU145, LNCaP, and PC3 PCa cells were cultured in RPMI supplemented with 10% FBS (Invitrogen, Carlsbad, CA). RWPE cells were grown in keratinocyte serum-free medium (Invitrogen) supplemented with 5 ng/ml human recombinant epidermal growth factor and 0.05 mg/ml bovine pituitary extract. All the cells used in this study were tested for mycoplasma using a PCR-based method (Lonza, Norwalk, CT). For stable knockdown of GNMT, SARDH, or PIPOX, human lentiviral shRNA clones targeting the respective gene or nonsilencing (control) lentiviral shRNA in pLKO puromycin vectors were purchased from Sigma (St Louis, MO). Viral particle infections were carried out in the presence of polybrene (8 µg/ml) in 50% to 60% confluent DU145 and RWPE cells. After 48 hours, transduced cells were grown in DU145 and RWPE culture media containing puromycin (2 µg/ml). Three weeks later, stable cells were plated into 96-well plate for clonal selection. GNMT, SARDH, and PIPOX knockdown were confirmed in pooled and single clones by quantitative PCR (qPCR) and individual clones showing highest levels of knockdown were further expanded. For overexpression studies, stable cell lines were created by transfecting the FLAG-SARDH and FLAG-PIPOX construct and vector control into DU145 cells using FuGENE 6 (Roche, Indianapolis, IN) and resulting clones were selected using 300 µg/ml G418 (Invitrogen).
Immunoblot Analysis and Antibodies
Protein extracts were prepared from benign prostate, localized PCa, and metastatic tumor tissues, and standard immunoblot analysis was performed. Briefly, prostate tissues were homogenized in NP-40 lysis buffer containing 50 mM Tris-HCl (pH 7.4), 1% NP-40 (Sigma), and complete protease inhibitor cocktail (Roche). Fifteen micrograms of protein extract was mixed with sodium dodecyl sulfate sample buffer and run on a 4% to 12% Bis-Tris gel under reducing conditions. The separated proteins were transferred onto polyvinylidene fluoride membranes (Amersham Pharmacia Biotech, Piscataway, NJ) and incubated for 1 hour in blocking buffer (Tris-buffered saline with 0.1% Tween and 5% nonfat dry milk), followed by incubation with the appropriate primary antibodies overnight at 4°C. After washing with Tris-buffered saline with 0.1% Tween buffer, the membrane was incubated with HRP-linked donkey, anti-rabbit IgG antibody (GE Healthcare Life Sciences, Piscataway, NJ) at 1:5000 for 1 hour at room temperature. Specific signals were visualized by using ECL Plus Western Detection System (GE Healthcare Life Sciences). The anti-FLAG (M2) antibody was obtained from Sigma-Aldrich (St Louis, MO). Antibody against GNMT (H-225) was acquired from Santa Cruz Biotechnology (Santa Cruz, CA). SARDH and PIPOX antibodies were obtained from Aviva Systems Biology (San Diego, CA) and Abnova (Taipei, Taiwan), respectively. Antibody for poly(ADP-ribose) polymerase (PARP) was purchased from Cell Signaling Technology (Danvers, MA). The anti-β-actin antibody was purchased from Abcam (Cambridge, MA). Protein levels for actin were used as loading control.
Quantitative PCR
Total RNA was isolated from DU145-shNS-, DU145-shGNMT-, RWPE-shNS-, RWPE-shSARDH-, or RWPE-shPIPOX-transduced cells (Qiagen, Gaithersburg, MD). qPCR was performed using SYBR Green dye on the StepOne Real-Time PCR System (Applied Biosystems, FosterCity, CA) [16]. Briefly, 1 µg of total RNA was reverse transcribed into cDNA using SuperScript III (Invitrogen) in the presence of random primers (Invitrogen). All reactions were performed in triplicates with SYBR Green Master Mix (Applied Biosystems) and 25 ng of both the forward and reverse primers according to the manufacturer's recommended thermocycling conditions and then subjected to melt curve analysis. Threshold levels for each experiment were set during the exponential phase of the qPCR reaction using Sequence Detection Software version 1.2.2 (Applied Biosystems). The relative quantity of the target gene was computed for each sample using the ΔΔCt method by comparing-mean Ct of the gene to the mean Ct of the housekeeping gene, glyceraldehyde 3-phospate dehydrogenase (GAPDH) [17]. All oligonucleotide primers were synthesized by Integrated DNA Technologies (Coralville, IA). Sequences of all primers used in qPCR analyses are listed in Table W1.
Flow Cytometry Analysis
shGNMT-DU145 cells were collected and fixed with 5 ml of ice-cold methanol for 1 hour at 4°C. Fixed cells were resuspended in phosphate-buffered saline solution containing RNase and propidium iodide (200 µg/ml; Sigma), and flow cytometry analysis was performed. Cell cycle profiles were obtained using a BD Biosciences FACSCalibur flow cytometer and CellQuest software. Apoptosis was assessed using sub-G0/G1 DNA content.
Immunohistochemistry
A study pathologist (R.M.) reviewed the slides of all tissue samples from the radical prostatectomy series and designated areas of interest. These slides were used as a template for tissue microarray (TMA) construction. All TMAs were assembled using the manual tissue arrayer (Beecher Instruments, Silver Spring, MD) with at least three tissue cores sampled from each donor block. Histologic diagnosis of the tissue cores was verified by standard hematoxylin and eosin staining of the initial TMA slide. Standard biotin-avidin complex immunohistochemistry was performed using a polyclonal anti-GNMT antibody (Santa Cruz Biotechnology). Digital images were acquired using the BLISS Imaging System (Bacus Laboratory, Lombard, IL) and evaluated using a previously validated web-based tool (TMA Profiler; University of Michigan) [18]. Staining was scored as negative (score = 1), weak (score = 2), moderate (score = 3), or strong (score = 4) based on the intensity of staining of tumor cells using a similar system that has been validated previously [19].
Cell Proliferation Assay
Cells were seeded in 24-well plates. Cell counts were estimated by trypsinizing cells and analyses by Coulter Counter (Beckman Coulter, Fullerton, CA) at the indicated time points in triplicate.
Basement Membrane Matrix Invasion Assay
For invasion assays, shNS vector or shGNMT-transduced DU145 cells, shSARDH- or shPIPOX-transduced RWPE cells, and RWPE and DU145 cells were used. Briefly, warm serum-free medium was mixed with Matrigel (Fisher Scientific, Waltham, MA) at 1:3 ratio; 100 µl of the Matrigel mixture was added into the center of each cell well inserts of the Chemicon 24-well plate (Chemicon, Temecula, CA) and allowed to solidify at room temperature for 3 to 4 hours. Cells were trypsinized and resuspended in serum-free medium. In each insert, approximately 1 x 10⁵ cells in 100 µl of serum-free medium were placed in the upper chamber and 500 µl of full medium with FBS was added to the lower chamber as a chemoattractant. Cells were then grown in the upper chamber for 48 hours. The noninvading cells inside the insert were removed using a cotton swab and the inserts were stained for invaded cells on the lower surface of the membrane. Invaded cells were stained with crystal violet and photographed. The inserts were treated with 10% acetic acid, and absorbance was measured at 560 nm. Cell proliferation and invasion assays were performed as described [20–22].
Soft Agar Colony Assay
Fifty microliters of base layer of agar (0.6% agar in Dulbecco's modified Eagle's medium with 10% FBS) was allowed to solidify in a 96-well flat-bottom plate before the addition of 75 µl of suspension of stable knockdown cells (shNS vector control, DU145-shGNMT, RWPE-shSARDH, or RWPE-shPIPOX) containing 4000 cells in 0.4% agar in Dulbecco's modified Eagle's medium with 10% FBS. The cell-containing layer was then solidified at 4°C for 15 minutes before the addition of 100 µl of minimum essential medium (MEM) with 5% FBS. Colonies were allowed to grow for 21 days before imaging under a light microscope.
Chicken Chorioallantoic Membrane Assay
Briefly, fertilized eggs were incubated in a rotary humidified incubator at 38°C for 10 days. Chicken chorioallantoic membrane (CAM) was released by applying mild amount of low pressure to the hole over the air sac and cutting a square 1-cm2 window encompassing a second hole near the allantoic vein. Cultured DU145 cells were transduced with shGNMT virus, or FLAG-SARDH overexpressing cells were detached by trypsinization and resuspended in complete medium before implantation adjacent to the mesenchyme in each egg. Similarly, 2 million RWPE cells were pretreated with vehicle, sarcosine, alanine, or glycine and applied to the upper CAM of a fertilized chicken embryo. Cells used in the invasion assays were labeled with red fluorescent protein and processed as previously described [23]. The windows were subsequently sealed and the eggs were returned to a stationary incubator. For invasion and intravasation experiments, the upper or lower CAM was isolated after 72 hours, respectively. For tumor growth and metastasis, the eggs were incubated for 18 days in total, after which the extraembryonic tumor were exercised and weighed, and the embryonic liver were harvested and analyzed for the presence of tumor cells by quantitative human Alu-specific PCR. Genomic DNA from lower CAM and liver was prepared using Puregene DNA purification system (Qiagen). Quantification of human cells in the extracted DNA was performed as described [24]. Fluorogenic TaqMan qPCR probes were applied as above and DNA copy numbers were quantified.
Prostate Tumor Xenograft Models
Five-week-old male nude athymic BALB/c nu/nu mice (Charles River Laboratory, Wilmington, MA) were used for xenograft studies. Stable shNS and shGNMT cells (5 x 10⁶), SARDH overexpressing cells (5 x 10⁶), or vector control cells (5 x 10⁶) were resuspended in 100 µl of phosphate-buffered saline with 20% Matrigel (BD Biosciences) and implanted subcutaneously into the left flank regions of the mice. Growth in tumor volume was recorded weekly using digital calipers, and tumor volumes were calculated using the formula (π/6)(L x W2), where L is the length of tumor and W is the width. Tumor growth inhibition was defined as percent decrease in the mean tumor volume for shGNMT relative to shNS vector and SARDH overexpressing cells relative to the vector control. All experimental procedures involving mice were approved by the University Committee on Use and Care of Animals at the University of Michigan and conform to their relevant regulatory standards.
Statistical Analysis
To examine the biomarker potential of sarcosine for PCa, a classificatory model based on logistic regression was developed. Here, the value of normalized sarcosine was used as the predictor variable, and biopsy status, i.e., positive or negative, was used as the binary outcome variable. The performance of the model was examined by using the area under the receiver operating characteristic curve (AUROC). AUROC was determined using a cross-validation approach, by partitioning the specimens (n = 345, both biopsy positive and negative) equally into training and testing groups. The cross-validation was carried out by repeating this partitioning process 5000 times. The receiver operating characteristic reflecting the mean AUROC across all the iterations along with the associated 95% confidence band is shown in Figure 1B.
For the functional studies, all values are presented as means ± SEM. The significant differences between the groups were analyzed by a Student's t test and a P value < .05 was considered significant.
Results
Sarcosine Levels Are Significantly Elevated in PCa
We reconfirmed our earlier results on the modest ability of sarcosine to detect PCa at biopsy, using a training/testing approach, on independent sets of urine specimens. To build the training model, we used 211 biopsy-positive and 134 biopsy-negative urine sediments, collected post-DRE and pre-biopsy. Using a logistic regression model, sarcosine was found to have a cross-validated AUROC of 0.71, for distinguishing biopsy-positive patients from biopsy-negative controls (Figure 1B), verifying our earlier findings [4]. Sarcosine levels were found to be significantly higher in urine sediments (P < .0001; Figure 1C) derived from biopsy-positive PCa patients compared to biopsynegative controls. In addition, using a similar approach, the AUROC for sarcosine to distinguish biopsy-negative controls from the combined group consisting of biopsy-proven PCa as well as patients who underwent RRP was 0.695 (Figure W3). Following this, we next verified elevated sarcosine levels in localized PCa and metastatic tissues. Sarcosine levels were significantly elevated in localized PCa (n = 11) compared to benign adjacent prostate samples (n = 11, P = .0006; Figure 1D). The levels of the metabolite were even greater in metastatic samples (n = 10) compared to localized PCa (P < .00001; Figure 1D). Interestingly, during the course of these validations, we observed that the metabolite levels in noncancer-containing tissues were sensitive to the “field effect” generated by the adjacent tumor. Thus, as shown in Figure W4, the levels of sarcosine were elevated and comparable in both the site of metastatic tumor and the adjacent pathologically normal tissue. The levels of the metabolite, however, were undetectable in the benign tissues that were distant from the metastatic site in the same patient (Figure W4).
Transcript and Protein Levels of GNMT, SARDH, and PIPOX Are Dysregulated during PCa Progression
Having confirmed elevated levels of sarcosine in localized/metastatic tissues as well as biopsy-positive urine sediments, we examined the role of sarcosine in PCa development and progression. To this end, we first measured the mRNA levels of the enzymes in the sarcosine pathway that included GNMT, SARDH, and PIPOX in prostate tissues. We carried out SYBR Green real-time qPCR on 12 benign prostates, 14 localized PCa, and 14 metastatic samples. Our results confirmed elevated transcript levels for GNMT (t test, P < .001; Figure 2A, left panel) and reduced mRNA expression for SARDH and PIPOX in PCa and MET relative to benign prostate tissues (t test, P < .001; Figure 2A, middle and right panels). This expression profile was further confirmed at the protein level using immunoblot analysis (Figure 2B). In addition, tissue microarray-based analyses of GNMT protein expression in prostate tissues (23 benign, 56 PCa, and 6 MET) revealed cytoplasmic staining that was very high in metastatic tissues and moderate to strong in PCa, while being low to undetectable in benign adjacent prostate tissue (t test, P < .001; Figure 2, C and D). These results allude to a stepwise increase in levels of sarcosine, from benign prostate tissue to localized PCa to metastatic disease, as reported earlier [4].
Figure 2.
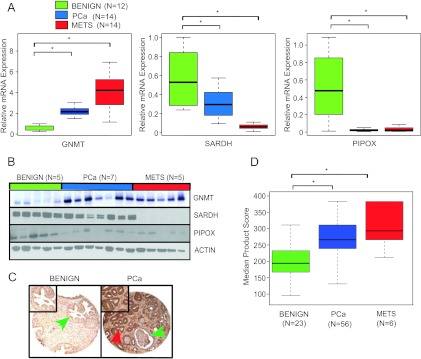
GNMT, SARDH, and PIPOX mRNA and protein expression are dysregulated in PCa. (A) Quantitative SYBR Green reverse transcription-PCR (qRT-PCR) assessment of GNMT, SARDH, and PIPOX expression in prostate tumor specimens. Expression was determined in a cohort of 12 benign adjacent prostate (benign), 14 localized PCa, and 14 metastatic PCa (MET) tissues. For qRT-PCR, expression of target genes was normalized to the expression of the housekeeping gene, GAPDH. (B) Immunoblot analysis showing GNMT, SARDH, and PIPOX expression in benign, PCA, and MET. The protein levels of actin were used as loading control. (C) Representative prostate tissue sections stained with an antibody to GNMT. (Left) GNMT expression in benign tissue was observed primarily in cytoplasm (green arrow). (Right) In clinically localized PCa, the expression of GNMT was increased in the cytoplasm (red arrow) compared to weak expression in benign gland from the same sample (green arrow). (D) Box plot of GNMT product score across PCa progression.
Perturbation of Sarcosine-Generating Enzyme, GNMT, Modulates Neoplastic Progression of Prostate Cell Lines
Our data thus far suggest an elevation of sarcosine metabolism in PCa progression. Furthermore, our earlier results that were based on transient knockdown of enzymes in the sarcosine pathway indicated a tumor-promoting role for this metabolite in PCa. To explore this further, we examined the effect of ectopic overexpression of GNMT in benign prostate epithelial cells, RWPE. To achieve this, we transduced these benign cells with a lentiviral construct expressing GNMT [or green fluorescent protein (GFP) as control] and measured their sarcosine levels as well as examined its effect on proliferation and invasive potential. Overexpression of GNMT in RWPE cells elevated sarcosine levels (Figure 3A) with concomitant increase in invasion (Figure 3A; P = .0009) but had no effect on cell proliferation (Figure W5).
Figure 3.

The role of the sarcosine-generating enzyme, GNMT, in prostate cell lines. (A) Benign immortalized prostate RWPE cells were transduced with GFP-GNMT lentivirus or mock or GFP control. Increased levels of sarcosine were found in GFP-GNMT lentivirus-transduced RWPE cells compared to mock or GFP control. GNMT overexpression also increased invasion in RWPE cells as measured by Boyden chamber Matrigel invasion assay. Representative photomicrographs showing cell invasion assay (top inset) are shown. (B) Cell proliferation assay using pooled shGNMT, shGNMT clone 7, shGNMT clone 9, or shNS cells at the indicated time points showing decreased cell proliferation in shGNMT knockdown cells. (C) shGNMT clone 7 and shGNMT clone 9 or shNS DU14 cells were plated for 48 hours. The amount of sub-G0/G1 cells was calculated using the CellQuest program for fluorescence-activated cell sorting (FACS). Cleavage of PARP by immunoblot assessment is shown in the top inset. (D) Assessment of sarcosine levels by GC-MS showing decreased levels of sarcosine in shGNMT knockdown cells compared to shNS vector. The invasion was quantitated by absorbance and cells were photographed after invasion through Matrigel and stained with crystal violet (top inset). (E) Pooled shGNMT, shGNMT clone 7, or shGNMT clone 9 blocked anchorage-independent growth in soft agar assay compared to shNS vector control. Representative photomicrographs showing soft agar (top inset) are shown. All experiments were independently performed in triplicates. (F) Exogenous sarcosine or alanine was spiked to shGNMT clone 7 or shGNMT clone 9 cells and invasion assay was performed. The addition of sarcosine resulted in the rescue of invasion phenotype in these GNMT knockdown cells. Data shown in the figure represent means ± SEM. Asterisks indicate significant comparisons (P < .05, two-sided Student's t test).
Subsequently, we carried out a stable knockdown of the enzyme in DU145 PCa cells that are known to be invasive. Here, we used two independent GNMT-specific shRNA (shGNMT), individually as well as in a pooled format, along with nontargeted shRNA (shNS) as a control. In all of these instances, we observed >70% reduction in GNMT expression both at the mRNA (Figure W6A) and protein levels (Figure W6B). This was concomitantly associated with a reduction in cell proliferation compared to nontarget-transduced controls (54% and 60% reduction, respectively; Figure 3B). This was reflected in flow cytometry data, which showed an increase in the sub-G1 fraction, in the knockdown cells (Figure 3C). Furthermore, these cells also exhibited a greater percentage of cell death, possibly due to apoptosis. To confirm this, we evaluated PARP family of proteins that are known to be cleaved during programmed cell death. As expected, cells in which GNMT was knocked down showed higher levels of cleaved PARP compared to controls (Figure 3C, top inset), suggestive of apoptosis, as an additional mechanism leading to reduced cell numbers.
In addition to changes in cell numbers, GNMT knockdown cells also showed >65% reduction in both invasion and anchorage-dependent growth compared to nontarget-transduced controls, as assessed by Boyden chamber Matrigel assay and soft agar colony-forming assay (Figure 3, D, gray bars, and E; P < .005 for both invasion and soft agar assay). Notably, all of the above phenotypes in cells with reduced GNMT expression were also associated with markedly lower levels of sarcosine (Figure 3D, black bars). Consistent with this, addition of sarcosine to these cells partially rescued their invasive properties, while addition of a control metabolite alanine failed to rescue the invasive phenotype (Figure 3F; P < .05). Addition of exogenous sarcosine did not completely rescue invasive phenotype of DU145 cells expressing low levels of GNMT possibly because endogenous SARDH and PIPOX activity converted sarcosine to glycine. This needs to be verified by flux analysis using isotopically labeled sarcosine and the study of the kinetics of 13C incorporation into the breakdown products. Furthermore, we believe that wild-type DU145 cells are highly invasive, and hence, addition of sarcosine to these cells may not show a significant increase in invasion. Similar results were also obtained with LNCaP and PC3 (both PCa) cell lines harboring GNMT knockdown but not RWPE (benign) cells (Figures W7–W9), reconfirming the importance of the metabolite in PCa.
A Functional Role for SARDH and PIPOX in PCa Progression In Vitro
Next, we examined the effect of perturbing the enzyme machinery that regulates the metabolism of sarcosine to glycine on the phenotype of the prostate cell lines. As described earlier in Figure 1A, SARDH and PIPOX convert sarcosine back to glycine. First, we examined the effect of SARDH and PIPOX overexpression on growth and invasive potential of DU145 PCa cells (Figure W10). Notably, in case of DU145 cells, overexpression of these enzymes markedly decreased sarcosine levels and attenuated invasion (Figure 4A), while only SARDH overexpression reduced proliferation (Figure 4B). Consistent with this, only overexpression of SARDH but not PIPOX reduced colony formation in soft agar relative vector control (Figure 4C). In contrast, knockdown of SARDH in RWPE cells increased sarcosine levels and resulted in increased proliferation (Figure 4D), invasion (Figure 4E), and anchorage-independent growth (Figure 4F). However, knockdown of PIPOX in RWPE increased sarcosine levels and made them invasive, while having no effect on their proliferation and anchorage-independent growth.
Figure 4.
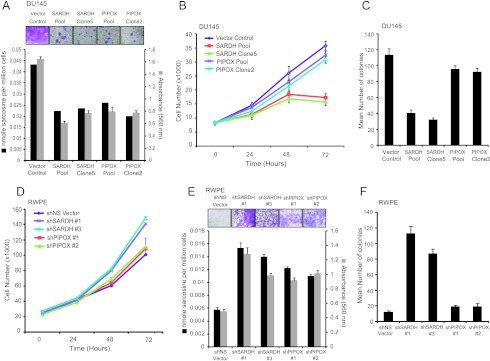
The role of the sarcosine-degrading enzymes, SARDH and PIPOX, in prostate cell lines. (A) FLAG-SARDH and FLAG-PIPOX overexpressing cells showed decreased levels of sarcosine and attenuated invasion in DU145 cells. The invasion was quantitated by absorbance and cells were photographed after invasion through Matrigel and stained with crystal violet (top inset). (B) FLAG-SARDH and FLAG-PIPOX were stably overexpressed in DU145 cells. Cell proliferation assay performed using pooled SARDH, SARDH clone 5, pooled PIPOX, PIPOX clone 2, or vector control cells at the indicated time points showed decreased cell proliferation in SARDH but not PIPOX overexpressing cells. (C) Pooled SARDH or SARDH clone 5 showed decreased number of colonies in soft agar compared to vector control. (D) Same as in B but for shSARDH knockdown RWPE cells (clones 1 and 3) and shPIPOX knockdown RWPE cells (clones 1 and 2) or their respective shNS controls at the indicated time points. (E) Same as in A but for shSARDH and shPIPOX knockdown RWPE cells compared to their respective shNS controls. (F) Same as in C but for shSARDH and shPIPOX knockdown RWPE cells compared to their respective shNS controls.
Sarcosine-mediated Invasion and Intravasation In Vivo
Further developing our in vitro findings, we examined the ability of sarcosine, glycine, and alanine to trigger local invasion and intravasation, in nontumorigenic RWPE cells, using a CAM assay [23]. Consistent with our in vitro data, addition of sarcosine but not glycine or alanine induced invasion and intravasation in RWPE cells that migrated across the upper CAM junction (Figure 5, A and B, arrows; P < .01). GNMT knockdown or SARDH overexpression in DU145 PCa cells, however, resulted in a significant reduction in tumor weight (P = .02 and P = .03, respectively) as well as decreased intravasation (P = .01 for GNMT knockdown and P = .05 for SARDH overexpression, respectively; Figure 6A), and ability of the cells to metastasize to the liver (P < .05), compared to controls (Figure 6B). Similar results were obtained using PC3 PCa cells as shown in Figure W11.
Figure 5.

The role of sarcosine in PCa growth in vivo. (A) CAM invasion assay performed using RWPE cells transduced with red fluorescent protein virus for visualization. After puromycin selection, cells were treated with vehicle, sarcosine, glycine, or alanine as indicated. Seventy-two hours after implantation, the upper CAM was harvested. Frozen sections were created and stained for hematoxylin and eosin (left column), human-specific cytokeratin (immunohistochemistry, middle column), or chicken-specific type IV collagen (green immunofluorescence, right column). Arrowheads indicate cells that invaded through the upper CAM. Representative images are shown. Scale bars, 200 µM. (B) CAM intravasation assay performed using RWPE cells treated with vehicle, sarcosine, glycine, or alanine as indicated. Seventy-two hours after implantation, the lower CAM was harvested. Total DNA was isolated from the lower CAM, and qPCR was performed using human-specific Alu PCR primers. Total cell number was determined by comparing to a standard curve derived by using known quantities of input RWPE cells.
Figure 6.

The role of sarcosine pathway enzymes, GNMT and SARDH, in PCa growth in vivo. (A) CAM intravasation assay was performed using shGNMT clone 7, SARDH clone 5, and vector control in DU145 cells. Number of intravasated DU145 cells and tumor weight was decreased in both shGNMT and SARDH overexpressing xenografted cell lines compared to vector control. (B) Liver metastasis in chicken embryos was assessed 8 days following implantation of either shGNMT clone 7 or SARDH clone 5 or vector control cells onto the upper CAM. Total number of metastasized cells were quantified and found to be significantly decreased in both shGNMT and SARDH overexpressing xenografted cell lines compared to vector control. (C) shGNMT (clones 7 and 9) decreased DU145 tumor growth in mice. Means ± SEM are shown, *P < .05. (D) Stably overexpressed SARDH (pool and clone 5) decreased DU145 tumor growth in mice. Means ± SEM are shown, *P < .05. (E) Box plots showing decreased sarcosine levels in shGNMT (clones 7 and 9) mouse xenograft compared to shNS vector control. (F) Box plot showing decreased sarcosine levels in SARDH overexpressed (pool and clone 5) mouse xenograft tumors compared to vector control.
To confirm these in vivo results further, we examined the effect of GNMT knockdown and SARDH overexpression on in vivo tumor growth using a mouse xenograft model. We implanted DU145 cells containing either stable GNMT knockdown or ectopic overexpression of SARDH and their respective controls in nude male mice. At 5 weeks post-implantation, DU145 cells containing GNMT knockdown formed significantly smaller tumors (∼75% reduction, P = .0001) compared to control cells (Figure 6C). Similarly, SARDH overexpressing tumors were also significantly reduced in size (∼70% reduction, P = .0001) compared to their corresponding controls (Figure 6D). As expected, in both GNMT knockdown and SARDH overexpressing tumors, sarcosine levels were significantly reduced compared to controls (Figure 6, E and F). Furthermore, the tumors containing GNMT knockdown also had significantly elevated levels of SAM and lower levels of SAH, indicative of reduced activity through the GNMT-catalyzed reactome (Figure W12, A and B; P = .05).
Discussion
Our prior unbiased survey of the PCa metabolome identified sarcosine as a potential marker for aggressive disease that could be detected noninvasively in urine [4]. Further, in vitro studies showed that exogenous addition of sarcosine induced an invasive phenotype in benign prostate epithelial cells [4]. In the present study, we confirmed elevated levels of sarcosine in PCa tissues and urine and establish a role for sarcosine in promoting PCa growth and progression, using both in vitro and in vivo models of the disease.
Our studies on tissues revealed that the levels of sarcosine in pathologically benign tissues could potentially be influenced by the presence of an adjacent tumor. PCa like many tumors is known to exhibit a “field effect” that influences the metabolism of adjacent benign tissues [4,25]. Although the sensitivity of sarcosine levels to the underlying “field effect” needs to be more extensively characterized, it could partially explain the modest change in the metabolite levels seen in organ-confined PCa compared to its matched benign adjacent tissues [4]. Irrespectively, our results confirm a progressive elevation in sarcosine levels from benign adjacent tissue to localized tumors and metastatic disease, nominating sarcosine as an oncometabolite in PCa.
In addition, here we also verified significantly elevated levels of the metabolite in urine of biopsy-proven PCa patients compared to biopsynegative controls. The cross-validated AUROC of 0.71 that we obtained for an independent cohort of more than 500 urine sediments is comparable to the AUROC published by us and others [6–8]. Although, this amounts to a modest discriminatory power, we expect sarcosine to be a useful biomarker in a multiplex setting. Studies aimed at building such a multiplex panel containing sarcosine for PCa detection are currently underway.
Further, to verify its role as an oncometabolite, we altered the levels of sarcosine in prostate cell lines by modulating the expression of its regulatory enzymes and examining the resulting phenotype, both in in vitro and in vivo settings. Our results underscore the importance of specific key enzymes associated with sarcosine metabolism, namely, GNMT, SARDH, and PIPOX, in PCa progression. For example, both the metabolite and its biosynthetic enzyme GNMT are elevated in localized and metastatic PCa relative to benign tissues. Our present data are supported by the work of Song et al. who indicate that PCa patients with high GNMT cytoplasmic expression showed significantly lower disease-free survival rates compared to patients with lower expression levels of this enzyme [26]. We also acknowledge that these findings are contrary to the results published by Huang et al., who reported loss of a single GNMT copy in a significant proportion of human PCas, leading to its lower expression in these tumors [27,28]. However, our data on overexpression of GNMT are also supported by the observation of decreased levels of sarcosine-metabolizing enzymes SARDH and PIPOX in PCa. Together, we believe, these findings portray elevated flux toward sarcosine production in PCa, which is consistent with its higher metabolite levels.
Mechanistically, elevated levels of sarcosine potentiate tumor progression by having a positive influence on proliferation, invasion, and intravasation. Accordingly, GNMT knockdown or SARDH overexpression in PCa cells attenuated tumor growth and metastasis, while SARDH knockdown in benign epithelial cells promoted their proliferation, invasion, and anchorage-independent growth. Intriguingly however, an alteration in PIPOX expression affected only the invasive property of the cells while having no bearing on their proliferation or anchorage-independent growth. The reason for this disparity could be that these enzymes have different subcellular localization and it is likely that they distinctly affect downstream metabolism as potential determinants for the observed differences in proliferation. Irrespective of this, our data confirm SARDH as a potential tumor suppressor in PCa, consistent with a recent report by Chen et al. [29]. In summary, this study reiterates an important role for sarcosine in PCa progression and highlights the potential of using the metabolite to develop a multiplex urine-based marker for PCa detection.
Supplementary Material
Acknowledgments
We thank V. Vitvitsky from R. Banerjee Laboratory for SAM and SAHA estimations and X. Cao, Robert J. Lonigro, and N. Palanisamy for helpful discussions. We also thank Khalid Suleman and Rong Zhao for technical support.
Abbreviations
- PCa
prostate cancer
- GNMT
glycine N-methyltransferase
- SARDH
sarcosine dehydrogenase
- PIPOX
pipecolic acid oxidase
Footnotes
This work is supported in part by Early Detection Research Network (UO1 CA111275), Prostate Cancer Specialized Program of Research Excellence (P50CA69568), National Institutes of Health (R01CA132874, RO1CA133458, RO3CA139489, UO1CA167234, and R01CA13345), and Department of Defense (W81XWH-12-1-0130). A.M.C. is supported by the Doris Duke Charitable Foundation Clinical Scientist Award, the Prostate Cancer Foundation, and the Howard Hughes Medical Institute. A.M.C. is an American Cancer Society Research Professor and an A. Alfred Taubman Scholar. A.M.C. serves on the Scientific Advisory Board of Metabolon, Inc. Metabolon has licensed sarcosine and other prostate cancer metabolites for diagnostic use in prostate cancer from the University of Michigan. Metabolon was not involved in the development or approval of this study.
This article refers to supplementary materials, which are designated by Table W1 and Figures W1 to W12 and are available online at www.neoplasia.com.
References
- 1.Jemal A, Bray F, Center MM, Ferlay J, Ward E, Forman D. Global cancer statistics. CA Cancer J Clin. 2011;61:69–90. doi: 10.3322/caac.20107. [DOI] [PubMed] [Google Scholar]
- 2.Abate-Shen C, Shen MM. Molecular genetics of prostate cancer. Genes Dev. 2000;14:2410–2434. doi: 10.1101/gad.819500. [DOI] [PubMed] [Google Scholar]
- 3.Abate-Shen C, Shen MM. Diagnostics: the prostate-cancer metabolome. Nature. 2009;457:799–800. doi: 10.1038/457799a. [DOI] [PubMed] [Google Scholar]
- 4.Sreekumar A, Poisson LM, Rajendiran TM, Khan AP, Cao Q, Yu J, Laxman B, Mehra R, Lonigro RJ, Li Y, et al. Metabolomic profiles delineate potential role for sarcosine in prostate cancer progression. Nature. 2009;457:910–914. doi: 10.1038/nature07762. [DOI] [PMC free article] [PubMed] [Google Scholar] [Research Misconduct Found]
- 5.Jentzmik F, Stephan C, Lein M, Miller K, Kamlage B, Bethan B, Kristiansen G, Jung K. Sarcosine in prostate cancer tissue is not a differential metabolite for prostate cancer aggressiveness and biochemical progression. J Urol. 2011;185:706–711. doi: 10.1016/j.juro.2010.09.077. [DOI] [PubMed] [Google Scholar]
- 6.Cao DL, Ye DW, Zhu Y, Zhang HL, Wang YX, Yao XD. Efforts to resolve the contradictions in early diagnosis of prostate cancer: a comparison of different algorithms of sarcosine in urine. Prostate Cancer Prostatic Dis. 2011;14:166–172. doi: 10.1038/pcan.2011.2. [DOI] [PubMed] [Google Scholar]
- 7.Cao DL, Ye DW, Zhang HL, Zhu Y, Wang YX, Yao XD. A multiplex model of combining gene-based, protein-based, and metabolite-based with positive and negative markers in urine for the early diagnosis of prostate cancer. Prostate. 2011;71:700–710. doi: 10.1002/pros.21286. [DOI] [PubMed] [Google Scholar]
- 8.Bianchi F, Dugheri S, Musci M, Bonacchi A, Salvadori E, Arcangeli G, Cupelli V, Lanciotti M, Masieri L, Serni S, et al. Fully automated solid-phase microextraction-fast gas chromatography-mass spectrometry method using a new ionic liquid column for high-throughput analysis of sarcosine and N-ethylglycine in human urine and urinary sediments. Anal Chim Acta. 2011;707:197–203. doi: 10.1016/j.aca.2011.09.015. [DOI] [PubMed] [Google Scholar]
- 9.Jentzmik F, Stephan C, Miller K, Schrader M, Erbersdobler A, Kristiansen G, Lein M, Jung K. Sarcosine in urine after digital rectal examination fails as a marker in prostate cancer detection and identification of aggressive tumours. Eur Urol. 2010;58:12–18. doi: 10.1016/j.eururo.2010.01.035. discussion 20–11. [DOI] [PubMed] [Google Scholar]
- 10.Lucarelli G, Fanelli M, Larocca AM, Germinario CA, Rutigliano M, Vavallo A, Selvaggi FP, Bettocchi C, Battaglia M, Ditonno P. Serum sarcosine increases the accuracy of prostate cancer detection in patients with total serum PSA less than 4.0 ng/ml. Prostate. 2012;72:1611–1621. doi: 10.1002/pros.22514. [DOI] [PubMed] [Google Scholar]
- 11.Stabler S, Koyama T, Zhao Z, Martinez-Ferrer M, Allen RH, Luka Z, Loukachevitch LV, Clark PE, Wagner C, Bhowmick NA. Serum methionine metabolites are risk factors for metastatic prostate cancer progression. PLoS One. 2011;6:e22486. doi: 10.1371/journal.pone.0022486. [DOI] [PMC free article] [PubMed] [Google Scholar]
- 12.Kerr SJ. Competing methyltransferase systems. J Biol Chem. 1972;247:4248–4252. [PubMed] [Google Scholar]
- 13.Yeo EJ, Wagner C. Tissue distribution of glycine N-methyltransferase, a major folate-binding protein of liver. Proc Natl Acad Sci USA. 1994;91:210–214. doi: 10.1073/pnas.91.1.210. [DOI] [PMC free article] [PubMed] [Google Scholar]
- 14.Porter DH, Cook RJ, Wagner C. Enzymatic properties of dimethylglycine dehydrogenase and sarcosine dehydrogenase from rat liver. Arch Biochem Biophys. 1985;243:396–407. doi: 10.1016/0003-9861(85)90516-8. [DOI] [PubMed] [Google Scholar]
- 15.Dodt G, Kim DG, Reimann SA, Reuber BE, McCabe K, Gould SJ, Mihalik SJ. l-pipecolic acid oxidase, a human enzyme essential for the degradation of l-pipecolic acid, is most similar to the monomeric sarcosine oxidases. Biochem J. 2000;345(pt 3):487–494. [PMC free article] [PubMed] [Google Scholar]
- 16.Ateeq B, Tomlins SA, Laxman B, Asangani IA, Cao Q, Cao X, Li Y, Wang X, Feng FY, Pienta KJ, et al. Therapeutic targeting of SPINK1-positive prostate cancer. Sci Transl Med. 2011;3:72ra17. doi: 10.1126/scitranslmed.3001498. [DOI] [PMC free article] [PubMed] [Google Scholar]
- 17.Livak KJ, Schmittgen TD. Analysis of relative gene expression data using real-time quantitative PCR and the 2-ΔΔCT method. Methods. 2001;25:402–408. doi: 10.1006/meth.2001.1262. [DOI] [PubMed] [Google Scholar]
- 18.Mehra R, Varambally S, Ding L, Shen R, Sabel MS, Ghosh D, Chinnaiyan AM, Kleer CG. Identification of GATA3 as a breast cancer prognostic marker by global gene expression meta-analysis. Cancer Res. 2005;65:11259–11264. doi: 10.1158/0008-5472.CAN-05-2495. [DOI] [PubMed] [Google Scholar]
- 19.Varambally S, Dhanasekaran SM, Zhou M, Barrette TR, Kumar-Sinha C, Sanda MG, Ghosh D, Pienta KJ, Sewalt RG, Otte AP, et al. The polycomb group protein EZH2 is involved in progression of prostate cancer. Nature. 2002;419:624–629. doi: 10.1038/nature01075. [DOI] [PubMed] [Google Scholar]
- 20.Yu J, Cao Q, Mehra R, Laxman B, Tomlins SA, Creighton CJ, Dhanasekaran SM, Shen R, Chen G, Morris DS, et al. Integrative genomics analysis reveals silencing of beta-adrenergic signaling by polycomb in prostate cancer. Cancer Cell. 2007;12:419–431. doi: 10.1016/j.ccr.2007.10.016. [DOI] [PubMed] [Google Scholar]
- 21.Cao Q, Yu J, Dhanasekaran SM, Kim JH, Mani RS, Tomlins SA, Mehra R, Laxman B, Cao X, Kleer CG, et al. Repression of E-cadherin by the polycomb group protein EZH2 in cancer. Oncogene. 2008;27:7274–7284. doi: 10.1038/onc.2008.333. [DOI] [PMC free article] [PubMed] [Google Scholar]
- 22.Varambally S, Cao Q, Mani RS, Shankar S, Wang X, Ateeq B, Laxman B, Cao X, Jing X, Ramnarayanan K, et al. Genomic loss of microRNA-101 leads to overexpression of histone methyltransferase EZH2 in cancer. Science. 2008;322:1695–1699. doi: 10.1126/science.1165395. [DOI] [PMC free article] [PubMed] [Google Scholar]
- 23.Asangani IA, Ateeq B, Cao Q, Dodson L, Pandhi M, Kunju LP, Mehra R, Lonigro RJ, Siddiqui J, Palanisamy N, et al. Characterization of the EZH2-MMSET histone methyltransferase regulatory axis in cancer. Mol Cell. 2013;49:80–93. doi: 10.1016/j.molcel.2012.10.008. [DOI] [PMC free article] [PubMed] [Google Scholar]
- 24.van der Horst EH, Leupold JH, Schubbert R, Ullrich A, Allgayer H. TaqMan-based quantification of invasive cells in the chick embryo metastasis assay. Biotechniques. 2004;37:940–942. 944–946. doi: 10.2144/04376ST02. [DOI] [PubMed] [Google Scholar]
- 25.Risk MC, Knudsen BS, Coleman I, Dumpit RF, Kristal AR, LeMeur N, Gentleman RC, True LD, Nelson PS, Lin DW. Differential gene expression in benign prostate epithelium of men with and without prostate cancer: evidence for a prostate cancer field effect. Clin Cancer Res. 2010;16:5414–5423. doi: 10.1158/1078-0432.CCR-10-0272. [DOI] [PMC free article] [PubMed] [Google Scholar]
- 26.Song YH, Shiota M, Kuroiwa K, Naito S, Oda Y. The important role of glycine N-methyltransferase in the carcinogenesis and progression of prostate cancer. Mod Pathol. 2011;24:1272–1280. doi: 10.1038/modpathol.2011.76. [DOI] [PubMed] [Google Scholar]
- 27.Huang YC, Chen M, Shyr YM, Su CH, Chen CK, Li AF, Ho DM, Chen YM. Glycine N-methyltransferase is a favorable prognostic marker for human cholangiocarcinoma. J Gastroenterol Hepatol. 2008;23:1384–1389. doi: 10.1111/j.1440-1746.2008.05488.x. [DOI] [PubMed] [Google Scholar]
- 28.Huang YC, Lee CM, Chen M, Chung MY, Chang YH, Huang WJ, Ho DM, Pan CC, Wu TT, Yang S, et al. Haplotypes, loss of heterozygosity, and expression levels of glycine N-methyltransferase in prostate cancer. Clin Cancer Res. 2007;13:1412–1420. doi: 10.1158/1078-0432.CCR-06-1551. [DOI] [PubMed] [Google Scholar]
- 29.Chen X, Overcash R, Green T, Hoffman D, Asch AS, Ruiz-Echevarria MJ. The tumor suppressor activity of the transmembrane protein with epidermal growth factor and two follistatin motifs 2 (TMEFF2) correlates with its ability to modulate sarcosine levels. J Biol Chem. 2011;286:16091–16100. doi: 10.1074/jbc.M110.193805. [DOI] [PMC free article] [PubMed] [Google Scholar]
Supplemental Reference
- 1.Sreekumar A, Poisson LM, Rajendiran TM, Khan AP, Cao Q, Yu J, Laxman B, Mehra R, Lonigro RJ, Li Y, et al. Metabolomic profiles delineate potential role for sarcosine in prostate cancer progression. Nature. 2009;457:910–914. doi: 10.1038/nature07762. [DOI] [PMC free article] [PubMed] [Google Scholar] [Research Misconduct Found]
Associated Data
This section collects any data citations, data availability statements, or supplementary materials included in this article.