

Abstract
Although it is increasingly accepted that temporal expectation can modulate early perceptual processing, the underlying neural computations remain unknown. In the present study, we combined a psychophysical paradigm with electrophysiological recordings to investigate the putative contribution of low-frequency oscillatory activity in mediating the modulation of visual perception by temporal expectation. Human participants judged the orientation of brief targets (visual Gabor patterns tilted clockwise or counterclockwise) embedded within temporally regular or irregular streams of noise-patches used as temporal cues. Psychophysical results indicated that temporal expectation enhanced the contrast sensitivity of visual targets. A diffusion model indicated that rhythmic temporal expectation modulated the signal-to-noise gain of visual processing. The concurrent electrophysiological data revealed that the phase of delta oscillations overlying human visual cortex (1–4 Hz) was predictive of the quality of target processing only in regular streams of events. Moreover, in the regular condition, the optimum phase of these perception-predictive oscillations occurred in anticipation of the expected events. Together, these results show a strong correspondence between psychophysical and neurophysiological data, suggesting that the phase entrainment of low-frequency oscillations to external sensory cues can serve as an important and flexible mechanism for enhancing sensory processing.
Introduction
In our environment predictable temporal regularities are common, and relevant events often occur in rhythmic streams. The idea that we can use these rhythmic temporal predictions to enhance perception has been strongly advocated by Jones (1976). Across several studies, Jones and colleagues have shown that perceptual discrimination of rhythmic auditory stimuli is at its best when targets coincide with the peak of the carrier rhythm (Klein and Jones, 1996; Barnes and Jones, 2000; Jones et al., 2002, 2006). Similarly, there has been increasing evidence that temporal regularities can be used to improve perceptual processing of visual events (Correa et al., 2005; Doherty et al., 2005; Rolke and Hofmann, 2007; Mathewson et al., 2010; Jepma et al., 2012; Rohenkohl et al., 2012; Vangkilde et al., 2012). In a first step toward characterizing the mechanisms by which rhythmic temporal expectations modulate perception, we have recently shown that a rhythmic temporal structure of external events increases the signal-to-noise efficiency for perceptual discrimination of targets (Rohenkohl et al., 2012).
Accepting the increasing evidence that rhythmic temporal predictions modulate perception, the next issue becomes how they influence neural processing. It has been recently proposed that the phase synchronization of low-frequency oscillatory brain activity to the temporal pattern of events can optimize cortical excitability and enhance the processing of stimuli occurring at predicted moments (Lakatos et al., 2008, 2009; Schroeder and Lakatos, 2009). However, although this phase entrainment has been observed in primary sensory areas, its possible contribution to modulating psychological perceptual processes has not yet been tested rigorously.
To link entrainment of sensory areas to optimization of perceptual processes, it is necessary to demonstrate a concurrent increase in psychophysical parameters related to perceptual sensitivity. To date, however, experiments testing entrainment of slow oscillations have documented improvements in performance using primarily reaction-time measures (Lakatos et al., 2008, 2009; Stefanics et al., 2010). Improvements in reaction times may come about for many different reasons, ranging from enhanced sensory processing to increased motor preparation. Moreover, previous studies have tended to use paradigms requiring detection of occasional highly salient target stimuli. The low perceptual demands in these tasks limit their sensitivity for detecting perceptual modulations.
Here, we combined a sensitive psychophysical task with electrophysiological recordings to test whether the phase entrainment of low-frequency oscillations to a carrier rhythm modulates the contrast gain during visual processing. We used a similar task as in our previous behavioral study (Rohenkohl et al., 2012), where participants judged the orientation of brief targets embedded within temporally regular or irregular streams of distractors used as temporal cues.
Analysis of the psychophysical data replicated our recent finding that rhythmic temporal expectations enhances the perceptual processing of targets (Rohenkohl et al., 2012). Time–frequency analysis of EEG recordings showed that temporal expectations led to phase locking of slow oscillatory activity in anticipation of expected events so that the stimulus occurred at the phase with optimal performance. Our results support that phase entrainment of slow oscillations in sensory cortex modulates perceptual processing according to environmental demands.
Materials and Methods
Participants.
Sixteen participants (aged 19–33 years, 8 females, all right-handed) gave informed consent to take part in the experiment. Visual acuity was normal or corrected to normal. All experimental methods had ethical approval from the Central University Research Ethics Committee of the University of Oxford.
Apparatus.
The stimuli were created on MATLAB v.7.10 (The MathWorks) and presented using the Psychtoolbox v.3.0 package for MATLAB (Brainard, 1997). Images were displayed on a 21 inch CRT (CTX ultra screen) with a spatial resolution of 1024 by 768 pixels and a vertical refresh rate of 60 Hz, placed 100 cm in front of the participant. A chin rest was used to maintain a constant viewing distance and head position. Responses were collected via a response box (DirectIN High SpeedButton, Empirisoft).
Stimuli and task.
The task was based on a previous behavioral study (Rohenkohl et al., 2012). Each trial consisted of a stream of 140 foveally presented stimuli (14 targets and 126 standards) with a duration of 50 ms each (Fig. 1A). All stimuli were circular patches (diameter: 4 degrees of visual angle). The standards consisted of Gaussian noise patches, while targets contained Gabor patches embedded within the Gaussian noise. The Gabor patches were tilted at ±45 degrees, and their spatial frequency was fixed at 2 cycles per degree of visual angle.
Figure 1.
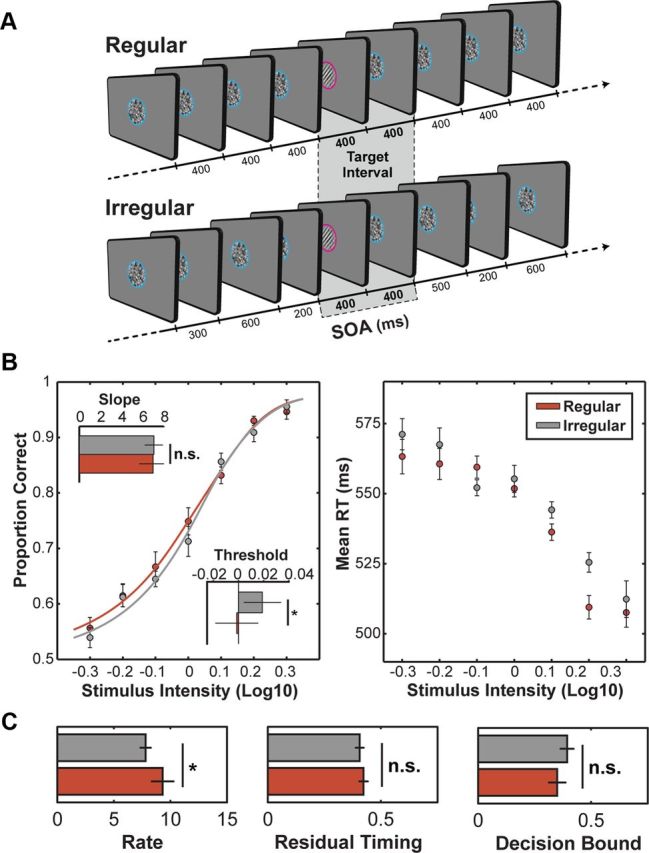
Schematic illustration of task structure and behavioral results. A, Each trial consisted of a stream of stimuli foveally presented either with a fixed (Regular condition) or jittered (Irregular condition) SOA. Intervals surrounding the targets were the same for the Regular and Irregular condition. Targets were brief (50 ms) visual gratings (Gabors) tilted 45° clockwise or counterclockwise, presented at seven contrast levels based on participants threshold. Participants were asked to respond to the orientation of the target (i.e., left or right) whenever a target was presented. Target presentation was always indicated by a change in the placeholder color to prevent responses to standard stimuli. B, Psychometric functions (left) describing performance on regular (red line) and irregular (gray line) conditions as a function of target contrast. Bar plots (insets) show the average fitted values of slope and threshold in regular and irregular conditions across subjects. Average reaction times for correct responses from the regular and irregular conditions as a function of target contrast (right). Error bars indicate SEM. C, Diffusion model parameters for regular and irregular conditions. Bar plots show the average fitted values of the accumulation rate (k), residual timing (tr), and decision bound (A) across subjects. Error bars indicate SEM.
The Gaussian noise patches were created by smoothing a pixel-by-pixel luminance Gaussian noise patch with a two-dimensional Gaussian smoothing kernel, so that their spatial frequency characteristics closely matched those of the Gabor patches (Wyart et al., 2012a). Both the smoothing dimension (0.083 degree of visual angle) and the root-mean-square contrast of the noise (10%) were fixed across participants and stimuli. Targets were inserted within the stimulus stream in a pseudorandomized order, ensuring a minimum of five and maximum of 14 standards between each target. Since a large number of targets were presented with a contrast lower than the threshold, isoluminant circles (pink and blue) were positioned around the patches to help the participants discriminate between targets and standard stimuli. This procedure also prevented participants from responding to standards, and thereby reduced the numbers of false alarms.
Temporal expectation was manipulated by varying the regularity of the stimulus-onset asynchrony (SOA) between successive events in a trial. In regular trials, SOA was fixed at 400 ms, allowing participants to use the temporal regularity of the stimulation to reduce the uncertainty about when stimuli could be presented. In irregular trials, the SOAs were drawn randomly from 200, 300, 400, 500, and 600 ms. As a result of the jittering, irregular trials had an arrhythmic beat, preventing focused temporal expectations about stimulus appearance. Importantly, the intervals preceding and succeeding each target were the same in the regular and irregular trials (400 ms). This control was introduced to avoid any possible confound related to foreperiod or masking effects caused by the proximity of the standards surrounding the target.
Procedures.
Each participant underwent a calibration session before the experiment using an adaptive psychophysical staircase procedure to estimate the threshold contrast for perceiving the Gabor gratings within the noise patches. Task difficulty was adjusted for each participant by titrating the contrast of the Gabor patch for which orientation discrimination was performed at 75% accuracy. Seven levels of contrast were chosen for target presentation, based on each subject's threshold values. These values ranged from −0.3 to +0.3 (in steps of 0.1) on a logarithmic scale, with 0 being the measured threshold during the psychophysical staircase procedure. The calibration was performed on 12 irregular trials. Therefore, any enhancement in contrast sensitivity could not be explained merely by learning effects.
After the calibration session, participants performed 50 trials (25 regular and 25 irregular). Regular and irregular trials were presented in a randomized order. Participants were instructed to respond to the orientation of each target with their left or right index finger according to the target orientation. Since the targets were also identified by the color of the placeholder, participants were prompted to respond to targets even at contrast levels below their threshold level. The experimental session lasted ∼1 h. Each trial contained 14 targets; altogether each participant was presented with a total of 700 targets (50 at each contrast level within each of the regular and irregular conditions).
Psychometric and diffusion model fitting.
The psychometric data from each participant and condition were fitted with sigmoidal Weibull functions, each defined by three parameters: a threshold α, a slope β, and lapse-rate γ as implemented in Palamedes toolbox (Prins and Kingdom, 2009). Guess rates were fixed at 0.5 (i.e., at chance level) across subjects and conditions, and the three parameters were fitted separately for each subject and condition (regular or irregular). Threshold was taken as the predicted contrast level (expressed in logarithmic units) corresponding to an accuracy of 75%. Goodness of fit for each participant was tested comparing predicted and observed accuracy (mean r2 = 0.88, lowest = 0.70).
The diffusion model predicts that the psychometric function for accuracy P(x) and the chronometric function for the mean response time t(x) are functions of stimulus strength x according to the following two equations:
 |
 |
where k corresponds to the normalized accumulation rate, A to the normalized decision bound, and tR to the residual time constant. Stimulus strength x relates to signal contrast following a power law whose exponent—which controls the overall slope of both psychometric and chronometric functions as a function of signal contrast—was determined empirically for each subject by maximum-likelihood estimation and remained fixed across conditions. Goodness of fit for each participant was tested comparing predicted and observed values (mean r2 = 0.92, lowest = 0.86).
EEG recording and preprocessing.
The EEG was acquired continuously from 35 Ag/AgCl electrodes at 1000 Hz referenced to the right mastoid site (AFZ ground; 300 Hz low-pass filter). The electrodes were positioned according to the 10-05 International system (AEEGS, 1991) and recorded using NuAmp amplifiers (Neuroscan, El Paso, TX). Electrode impedances were kept below 5 kΩ. The montage included seven midline sites (Fz, FCz, Cz, CPz, Pz, POz, and OZ) and 14 sites over each hemisphere (FP1/FP2, F1/F2, F3/F4, FC1/FC2, FC3/FC4, C1/C2, C3/C4, CP1/CP2, CP3/CP4, P1/P2, P3/P4, PO3/PO4, PO7/PO8, and O1/O2). Six additional electrodes were used as ground and reference sites and for recording the EOG. EOG electrodes were placed to the side of each eye (horizontal EOG) and above and below the left eye (vertical EOG), and bipolar signals were subsequently derived by computing the difference between these electrodes.
EEG preprocessing was performed using Neuroscan version 4.3 and SPM8 toolbox for MATLAB. Continuous EEG was re-referenced to the algebraic average of the right and left mastoids. For the parametric regressions (see below), the data were filtered offline with a 40 Hz low-pass filter (24 db/octave) and epoched from −500 ms to 800 ms relative to target onsets. Epochs containing excessive noise or drift (±100 μV at any electrode) or eye artifacts (blinks or saccades) were rejected. Blinks and saccades were identified as large deflections (±50 μV) in the horizontal or vertical EOG electrodes, and subsequently checked by visual inspection. The number of trials rejected for each subject because of blinks or eye movements was small in both conditions (average across subjects of 9% of trials, maximum of 19%). Importantly, the number of trials excluded in each condition did not differ significantly (t(15) = 0.25, p > 0.80).
Time–frequency analyses were performed on the unfiltered data using the SPM8 and Fieldtrip toolbox (Oostenveld et al., 2011) for MATLAB. To avoid edge effects at low frequencies, longer epochs from −2000 ms to 2000 ms relative to target onsets were used. However, epoch rejection was based on trials from the parametric regressions, thus the same trials were used for both analyses. Individual frequency bands (delta, 1–4 Hz; theta, 4–8 Hz; alpha, 8–16 Hz; and beta, 16–32) were extracted using second-order dual-pass Butterworth filters, and the phase and power of these narrow-band signals were calculated using the Hilbert transform (Kayser et al., 2009; Besle et al., 2011; Ng et al., 2012, 2013). Power was defined as the squared absolute value, and phase as the phase angle of the Hilbert signal.
Delta-band statistical analyses.
For all time–frequency analyses, delta-band (1–4 Hz) measures of power and phase were extracted from single-trial data using second-order Butterworth filters, and calculated using the Hilbert transform separately for each of five occipital electrodes (O1/O2/Oz/PO8/PO7) and averaged (either by normal average or by circular averaging of phase).
To explore whether delta phase was correlated with perceptual sensitivity, we investigated the correlation between delta phase and contrast gain in two steps. (1) For each time point and participant, delta phase was separated into 36 successive but partly overlapping bins (the width of each bin in radians varied so that each bin contained 30% of all trials). For each bin corresponding to a particular delta-phase range, the proportion correct as a function of target contrast was calculated, and performance was measured by fitting sigmoidal Weibull functions. In other words, the analysis used was identical as the one used on behavioral data, but now separated according to different phases of delta phase. By doing so, we were able to observe how psychophysical threshold values varied as a function of delta phase. As in the behavioral data, threshold was taken as the predicted contrast level (expressed in logarithmic units) corresponding to an accuracy of 75%. The negative signed threshold was used as a measure of contrast gain, as this value works as an index of a performance gain from their estimated threshold. (2) At the group level, data from all participants were pooled and the circular-linear correlation was calculated, as implemented in the CircStat toolbox (Berens, 2009).
To investigate whether delta phase was concentrated, in terms of phase locking, around the phase that corresponded to the best performance (or “best phase”), we first estimated what would be the best phase for each subject, time, and condition. Because phase is a circular variable, we performed a linear regression of contrast gain with the sine and cosine of delta phase and calculated the corresponding preferred phase as:
 |
where Y is the corresponding contrast gain value for that subject and time point, ϕ is the delta phase, and β0, β1, and β2 are the estimated coefficients for the linear regression (Wyart et al., 2012b). After having estimated the values of best phase, we then compared them with the observed mean phase. First, we calculated the circular distance (the circular equivalent of a subtraction) of the best phases for each subject with the observed phases. When similar, these distances would be concentrated around zero. We then performed a V test to test whether these values were significantly concentrated around zero. This test is a modified version of the Rayleigh test for uniformity, and tests the null hypothesis that the population is uniformly distributed around the circle with the alternative hypothesis that the population is not uniformly distributed, but rather has a specified mean angle. We used the test as implemented in the CircStat toolbox (Berens, 2009).
For the fit of the accumulation rate for different delta bins, a two-step procedure was adopted for each subject. (1) All parameters (decision bound A, accumulation rate k, residual timing tr, lapse rate and scaling coefficient) were first estimated using all data points (similar to the behavioral data). (2) For each bin, the proportion correct and the mean reaction time as a function of target contrast were calculated. Then, a fit was performed for each bin allowing only the accumulation rate k to vary. This procedure was adopted since this is our main variable of interest, compensating the smaller number of trials used in each bin and avoiding large fluctuations in the parameter space due to this smaller number of trials.
To test whether the relationship between delta phase and accumulation rate was different across experimental conditions, a similar linear regression as previously described was used with the sine and cosine of delta phase as regressors for each participant (Wyart et al., 2012b). The peak-to-peak effect size βpref was estimated for each participant and condition using:
 |
At the group level, a paired t test was used to compare the peak-to-peak effect across conditions.
All cluster-based analyses were performed by calculating permutations tests where experimental conditions were randomly intermixed within each subject (Maris and Oostenveld, 2007) and repeated 1000 times. For power and phase-locking value (PLV) analyses, thresholds were chosen based on t-values for the number of subjects. For r-values (circular-linear coefficient) and u-values (from the V test) threshold were chosen as the 99.5th percentile of the permuted data.
EEG amplitude regressions.
To evaluate possible differences in the sensitivity of neural response to Target Intensity, we regressed single-trial EEG signals against target contrast at successive time samples using the following linear model:
 |
where Y is the amplitude of the single-trial EEG amplitude and the fitted value of β0 is an estimate of EEG amplitude for the target with the lowest contrast (Wyart et al., 2012b). The fitted parameter of β1 furnishes an estimate of sensitivity of the broadband EEG signal to stimulus strength x. Values of β1 close to zero suggest that EEG amplitude in that electrode and time is not modulated by stimulus strength. On the other hand, values further from zero indicate that the EEG amplitude is largely dependent of stimulus strength—i.e., positive and negative values indicate an increase and decrease of the EEG amplitude as a function of target strength respectively. Stimulus strength x is related to target contrast (c) and in the simplest model, EEG scales linearly to target strength so that stimulus strength x = c1. Importantly, we did not restrict the relation between target contrast (c) and EEG amplitude to be necessarily linear (in fact, as can been seen in Fig. 4, this is clearly not the case). We considered a more general model, in which target strength and EEG amplitude followed a power function x = cγ. The coefficient γ was determined empirically for each subject, electrode and time point; but remained fixed across conditions. Therefore, while it could assume different values for subjects and time-samples, it was restricted to assume the same value between regular and irregular conditions at each fit. By doing so, it is assumed that while target strength and EEG amplitude should be condition-invariant, the sensitivity of EEG amplitude to target strength can be modulated by task condition. Also, γ was bounded to assume values between 1 and 4. It is worth emphasizing that situations where γ would assume values above/below the bounds were likely to be conditions where β1 tended to 0.
Figure 4.

EEG broadband signal is correlated to target strength. A, Event-related potentials evoked by targets of low, medium, and high contrast. B, Average estimates of β1 for occipital sites across experimental conditions. Gray shaded area represents time period used to compare experimental conditions. C, Relationship between EEG broadband signal and stimulus intensity for Regular and Irregular conditions. Lines represent the best fitting model (see main text for equations). Topographies show distribution of the effect across sensors. Error bars indicate SEM in both panels.
Our single-trial regression-based analyses were conducted independently for each participant, electrode, condition and time point (Wyart et al., 2012b). To avoid large intersubject differences in parameters estimates due to EEG amplitude intersubject variability, EEG amplitudes were normalized (using z-score) before each fit. Fits were performed by nonlinear least-squares regressions, as implemented in lsqcurvefit in MATLAB.
Results
Signal enhancement and reaction times
Figure 1B, left, shows the mean psychometric functions (proportion correct as a function of target contrast) in regular and irregular conditions. Fitted threshold and slope values for each participant were submitted to paired t tests (all t tests used in our analyses were two-sided). Thresholds were significantly lower for the regular condition (regular = −0.0014 ± 0.017; irregular = 0.019 ± 0.015; t(15) = 2.17, p < 0.05), while there was no difference between slopes values (regular = 6.99 ± 1.28; irregular = 7.05 ± 0.83; t(15) = 0.04, p > 0.5). These findings suggest that participants needed less contrast to perform the task when stimuli were presented in a regular rhythmic stream, showing an effect of contrast gain by temporal expectations.
Reaction times (RTs) for correct responses from the two conditions (Fig. 1B, right) were submitted to a repeated-measures ANOVA with Temporal Expectation (regular and irregular) and Target Contrast (seven levels) as factors. We found a significant main effect of Target Contrast (F(6,90) = 29.9; p < 0.001), with shorter RTs for targets with a higher contrast. There was also a significant main effect of Temporal Expectation (F(1,15) = 6.44; p < 0.05), showing shorter RTs for targets in the regular condition. The interaction between the factors was not significant (F(6,90) = 1.42; p > 0.2). This finding rules out the possibility that the observed increase in perceptual accuracy in the regular condition could have been due to a speed–accuracy trade-off—i.e., to delayed response times in the regular condition. The simultaneous improvement in the speed and accuracy of perceptual decisions in the regular condition replicates our previous observations (Rohenkohl et al., 2012) and is fully consistent with an increase in signal contrast under regular stimulation.
Diffusion model
As in our recent study (Rohenkohl et al., 2012), we used a diffusion model to determine which component of information processing was responsible for the concurrent increase in target discriminability and reaction speed observed between regular and irregular conditions. For each subject, we fitted simultaneously the psychometric (relationship between target contrast and discriminability) and chronometric (relationship between target contrast and reaction times) functions using a diffusion model of the decision process as proposed by Palmer and Shadlen (Palmer et al., 2005). The model consisted of three free parameters that we fitted to individual subject data: the accumulation rate k, the decision bias A, and the residual time constant tR. In this framework, simple perceptual decisions are based on gradual accumulation of noisy sensory evidence at an accumulation rate k until a signed decision bound ±A is reached. Reaction times correspond to the decision time required to reach either of the decision bounds. A residual time constant tR accounts for other non-decision processes such sensory and motor encoding latencies.
We fitted, for each participant, the regular and irregular conditions simultaneously with the three parameters of interest free to vary between conditions (Fig. 1C). At the group level, parameters from all participants were subjected to paired t tests. The results indicated that the accumulation rate k was significantly higher in regular than in irregular conditions (regular = 9.41 ± 1.02; irregular = 7.81 ± 0.51; t(15) = 2.2, p < 0.05). There was no significant difference between the decision bound A (regular = 0.35 ± 0.04; irregular = 0.39 ± 0.03; t(15) = 1.67, p > 0.11) or the residual time constant tR (regular = 0.42 ± 0.22; irregular = 0.41 ± 0.20; t(15) = 1.09, p > 0.2).
Modulation of contrast gain by entrainment of slow EEG oscillations
Delta phase and power (1–4 Hz) were extracted from single-trial data using second-order Butterworth filters, and calculated using the Hilbert transform. We used a cluster-based analysis (Maris and Oostenveld, 2007) to compare anticipatory phase concentration (indexed by the PLV) across experimental conditions. As can be seen in Figure 2, in the period between −400 ms and target presentation, phase concentration was significantly higher across trials in regular condition (cluster p < 0.01). Delta power was widely distributed across electrode sites in both conditions, and there was no significant difference between conditions (cluster p > 0.3).
Figure 2.
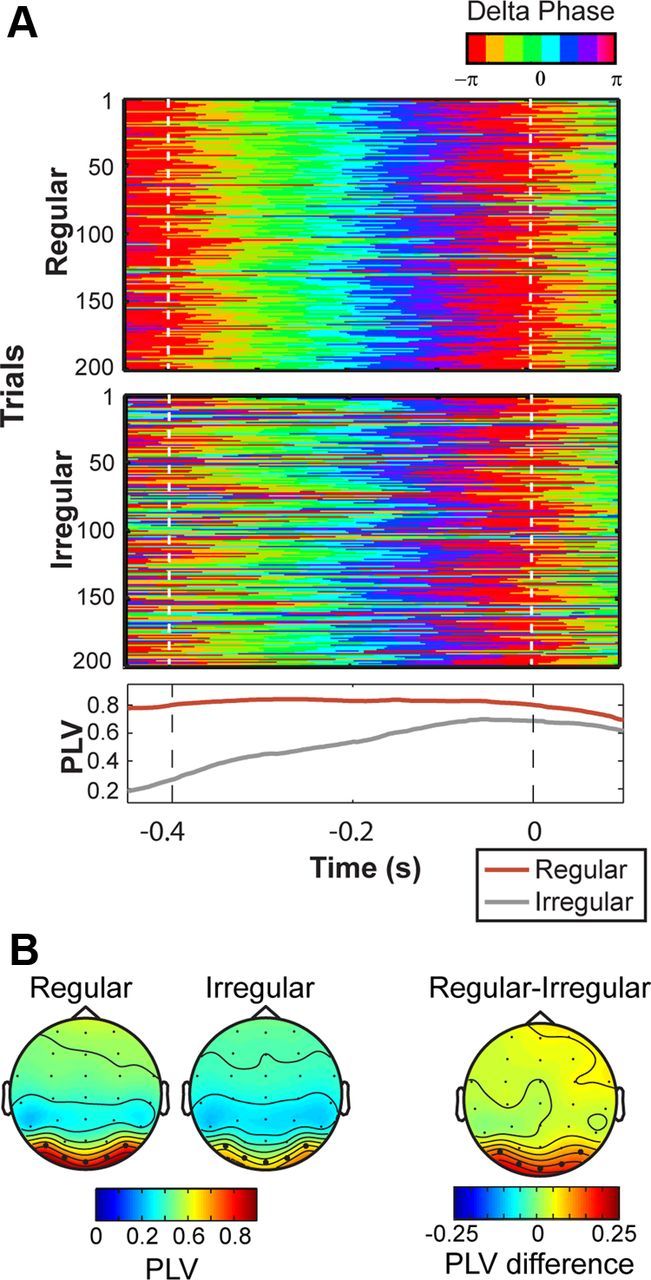
Delta-phase entrainment on occipital sites. A, Binned occipital (O1/Oz/O2/PO7/PO8) delta phase (1–4 Hz) for 200 successive trials in a representative participant (top, color maps). Bottom shows the PLV for regular and irregular conditions for that participant. B, Topography of grand average delta PLV (1–4 Hz) for the period between last cue and target presentation (−400 ms to 0) in regular (left) and irregular (middle). Topography of the difference in PLV between conditions (right).
Given the difference in phase distribution across experimental conditions, we explored the relationship between delta phase and perceptual contrast gain. Occipital delta phase (O1/Oz/O2/PO7/PO8) was separated into 36 successive and partly overlapping bins (each with 30% of the data). For each bin, the proportion correct as a function of target contrast was calculated, and performance was measured by fitting sigmoidal Weibull functions. As in the behavioral data, threshold was taken as the predicted contrast level (expressed in logarithmic units) corresponding to an accuracy of 75%. Importantly, a reduction in threshold corresponds to a measure of contrast gain. Intuitively, this value works as an index of a performance gain from their estimated threshold.
As can be seen in Figure 3A, contrast gain was highly dependent on delta phase in the last hundreds of milliseconds preceding target onset. The statistical comparison between regular and irregular conditions showed a significantly higher correlation between delta phase and contrast gain in the regular condition for the period between 140 and 30 ms before target presentation (cluster p < 0.01). Figure 3B shows how contrast gain and RTs varied as function of the distance from mean phase in this pretarget period (−140 to −30 ms). In regular conditions, contrast gain decreased as distance from mean phase increased (peak-to-trough t(15) = 3.39, p < 0.01), while no significant effect was found in the irregular condition (peak-to-trough t(15) = 0.55, p > 0.5). For RTs, we first regressed RT with signal contrast and then observed if the residual response time varied as the distance from mean phase increased. We observed that in regular conditions RTs increased as the distance from mean phase increased (peak-to-trough t(15) = −2.20, p < 0.05), and, as for contrast gain, no clear phase modulation pattern was observed in the irregular condition (peak-to-trough t(15) = −0.88, p > 0.3).
Figure 3.

Delta phase predicts contrast gain in Regular conditions. A, Color maps show the relationship between delta phase and contrast gain in regular (top) and irregular (bottom) conditions. Black line superimposed onto color maps indicates the mean delta phase across participants. Notice how the mean phase in regular conditions is closely superimposed to what is the optimal phase for performance. Lower line plot shows the correlation between delta phase and contrast gain in time. Black line indicates where correlation between delta phase and contrast gain was higher in regular than in irregular conditions (cluster p < 0.05). Shaded error bars indicate confidence intervals (5–95%) estimated by a jackknife procedure (removing one subject per time). B, Left, Line plots show contrast gain as a function of the distance from mean phase in the pretarget period (140–30 ms). In regular conditions, contrast gain decreases as distance from mean phase increases (peak-to-trough t(15) = 3.39, p < 0.01). No clear pattern is observed in irregular conditions (peak-to-trough t(15) = 0.55, p > 0.5). Right, Line plots show residual response times as a function of the distance from mean phase in the same pretarget period (140–30 ms). In regular conditions, response times increases as distance from mean phase increases (peak-to-trough t(15) = −2.20, p < 0.05). No clear pattern is observed in irregular conditions (peak-to-trough t(15) = −0.88, p > 0.3). C, Line plots shows the concentration of delta phase around the best phase for performance (V test, see main text) in regular and irregular conditions. Black line indicates where concentration around best phase was significantly higher in regular conditions (cluster p < 0.05). Shaded error bars indicate confidence intervals (5–95%) estimated by a jackknife procedure (removing one subject per time). Circular plot indicates the distribution of delta phase around the best phase (0°) in the pretarget period (140–30 ms). The size of the arrows indicates the phase locking factor of the distribution. Dashed inset lines indicates PLV values of 0.2 and 0.4.
We then investigated whether delta phase was concentrated, in terms of phase locking, around the delta phase that corresponded to the best performance (or best phase). We first estimated what would be the best phase for performance for each subject and condition (see Materials and Methods for more details). Afterward, we compared trial-averaged delta phases to the best phase estimated. As can be seen in Figure 3C, delta phase was highly concentrated around the optimum phase in the regular condition. Comparison between conditions showed higher concentration around the best phase in the regular condition for the period between 165 ms and 10 ms before target onset (cluster p < 0.01).
Modulation of accumulation rate by delta
Given the strong relationship between delta phase and contrast gain, we explored whether parameters of the diffusion model would also be related to these low-frequency oscillations. We focused our analyses on the 50 ms time window in which contrast gain and delta phase had the highest correlation (80–30 ms before target onset). An analysis similar to the one used on contrast gain was performed, with occipital delta phase binned into 36 successive and partly overlapping segments. However, instead of calculating the threshold for each bin, we estimated the accumulation rate k. Similar to the contrast–gain effect, the modulation of accumulation rate by delta phase was stronger for regular than irregular conditions (peak-to-trough difference in percentage for regular: 12.87 ± 1.77; irregular: 9.34 ± 1.41; t(15) = 2.22, p < 0.05). Finally, to test whether the best phase for contrast gain was similar to the best phase for the accumulation rate, we performed a V test on the difference between best phase for contrast gain and for accumulation rate. We found that this difference was phase-locked to zero across participants (V = 23.29, p < 0.01), suggesting that both effects depended on similar mechanisms.
Statistical analyses of other frequency bands
Similarly to delta PLV, we performed cluster-based analyses on occipital sites (O1/O2/Oz/PO8/PO7) comparing PLV and power between regular and irregular conditions for different frequency bands (delta, 1–4 Hz; theta, 4–8 Hz; alpha, 8–16 Hz; and beta, 16–32). All analyses used the time period between −400 ms and 400 ms relative to target onset. We found no significant differences in power between conditions for delta (cluster p value > 0.3), theta (cluster p value > 0.9), alpha (cluster p value > 0.35), or beta (cluster p value > 0.2). For PLV values, we found no significant differences between conditions for alpha (cluster p value > 0.61) or beta (cluster p value > 0.8). There was a higher theta PLV in regular trials for the period between 330 ms and 50 ms before target onset (p < 0.01). Given this PLV difference, we performed a similar analysis as for delta phase investigating a possible relationship between theta phase and contrast gain. However, we found no significant difference between the correlation of theta phase and contrast gain across experimental conditions (cluster p > 0.8), raising the possibility that the effect of theta PLV might be due to spectral “bleeding” from the delta band.
Modulation of early broadband EEG signal by target contrast
Figure 4A shows the ERPs elicited by different levels of target contrast. In our experimental setup there were several targets sequentially presented, resulting in an overlap of ERPs evoked by targets and standards. Therefore, to isolate potentials evoked by the targets, we subtracted the ERP from the lowest contrast (−0.3 in log scale) from the other contrasts (from −0.2 to 0.3). To increase signal-to-noise, we then averaged over each pair of increasing contrasts levels to calculate the ERPs to low contrast (−0.2 and −0.1), medium contrast (0 and 0.1) and high contrast (0.2 and 0.3). Because the contrast level of the preceding and succeeding items was constant, this procedure resulted in the subtracting out of ERPs from the adjacent stimuli, and highlighted the aspects of the ERP related to systematic changes in target contrast only. As can be seen in the figure, the earliest contrast-related modulation, isolating visual sensitivity to contrast levels, occurred between 200 and 300 ms after target presentation. Moreover, there was a late modulation over a P300-like late positive potential, probably reflecting non-sensory processes occurring simultaneously with motor selection and execution (O'Connell et al., 2012).
As previously explained, to investigate the differences in the sensitivity of neural response to Target Intensity, we regressed single-trial EEG signals against target contrast. The fitted parameter of β1 furnishes an estimate of sensitivity of the broadband EEG signal to stimulus strength x. The model fitting was conducted independently for each participant and condition. At the group level, we used standard parametric tests (t tests) to assess the reliability of our effects across the subjects. Figure 4 shows the magnitude of EEG signal sensitivity (β1 parameters) in occipital (PO7/PO8) sites averaged across subjects and conditions. As can be seen in the figure, EEG amplitude was modulated by stimulus strength in an early period (200–300 ms after target presentation). Importantly, a direct comparison between conditions in this time period indicated that EEG amplitude was more sensitive to target contrast in the regular than in the irregular condition (t(15) = 2.16, p < 0.05).
Discussion
In the present study, we investigated how rhythmic temporal expectation modulates brain oscillations and perceptual processing. We found that temporal rhythms increase phase entrainment of oscillatory activity at electrodes overlying human visual cortex. Importantly, this entrainment was closely related to a concurrent enhancement of perceptual discrimination to relevant events. Our results show a strong correspondence between neurophysiological and psychophysical data, providing new compelling supportive evidence for recent theories of the temporal dynamics of attention.
Our main findings indicated: (1) that the phase of occipital low-frequency oscillations is tightly related to target discriminability in regular streams of events, and (2) that delta phase is locked to the best phase for processing in rhythmic conditions in anticipation of relevant events. This strongly suggests that the entrainment of oscillatory activity to the regular structure of targets can influence sensory information processing. Specifically, we show that delta-phase entrainment is closely related to an increase in contrast gain for attended events. Contrast enhancement is a key principle in perceptual and attentional processes, and it has been postulated as an important mechanism by which attention can modulate perception (Liu et al., 2009; Carrasco, 2011). Importantly, this contrast enhancement was accompanied by a change in accumulation rate and a decrease in response times. The combination of an increased contrast gain with shorter response times strongly suggests that delta phase is modulating the quality of sensory information.
These results are in agreement with the recent proposal made by Schroeder and colleagues that the entrainment of attention to environmental rhythms is instrumental for perceptual selection (Lakatos et al., 2008, 2009; Schroeder and Lakatos, 2009). Furthermore, it adds to the increasing electrophysiological studies that have shown modulation of activity in sensory areas by temporal expectation (Ghose and Maunsell, 2002; Praamstra et al., 2006; Anderson and Sheinberg, 2008; Ghose and Bearl, 2010; Jaramillo and Zador, 2011; Lima et al., 2011; Ng et al., 2012). However, as previously mentioned, most of these studies have used tasks and stimuli that are not optimal for looking at mechanisms of perceptual enhancement at the behavioral level. Here, on the other hand, we show that this phase entrainment is directly correlated with perceptual contrast gain measured during a concurrent psychophysical task. It is worth mentioning that a difference in steady-state responses across conditions could also theoretically explain our findings. However, we believe that this alternative explanation is unlikely because we found a difference in the phase distributions of delta oscillations which was not accompanied by a difference in delta power.
Further support for the effects of temporal regularities on perceptual processing comes from the analysis of the broadband EEG signals. Previous studies have shown modulation of visual potentials by temporal attention (Griffin et al., 2002; Doherty et al., 2005; Correa et al., 2006; Rohenkohl and Nobre, 2011); however, they did not isolate the visual activity that tracks contrast sensitivity. By using a trial-by-trial GLM approach (Wyart et al., 2012b), we were able to measure the modulation of the visual activity most strongly sensitive to changes in contrast and thereby show compelling complementary neural evidence to the modulation of contrast gain by temporal expectation. The modulation we observed most resembled the visual N2 potential, given its distribution across time and sensors. In support of this interpretation, several studies have shown that the N2 is one of the earliest potentials related to target discriminability (Sergent et al., 2005; Busch et al., 2009; Wyart et al., 2011). Possibly, the stronger modulation of this potential in regular conditions can lead to a higher perceptual discriminability.
In a previous study, we found that different hazard rates predicting the time of motor responses also modulated low-frequency oscillations (in the theta range), in this case over central sites (Cravo et al., 2011). Similarly, central midline delta phase has also been related to reaction times in cued temporal attention tasks using auditory stimuli (Stefanics et al., 2010). These findings, in conjunction with the present results, suggest not only that temporal expectations can affect different behavioral outputs, but, more importantly, that oscillations can carry modulations by temporal expectations generated by different methods, such as hazard rates (Cravo et al., 2011), symbolic cues (Stefanics et al., 2010), and rhythmic tasks (Lakatos et al., 2008; Gomez-Ramirez et al., 2011). In all cases, alignment of brain oscillations ensures that information reaches task-relevant areas in periods of optimal excitability. Unsurprisingly, the sites where temporal expectations modulate low-frequency oscillations, and consequently the behavioral correspondence, are highly dependent on the task demands. Thus, although the role of oscillations in regulating neural excitability may be pervasive and operate in different levels of information processing, the exact stage that will be modulated by temporal expectation seems to be depend on task goals and the availability of neuronal groups whose excitability can be timed to relevant moments (Schroeder and Lakatos, 2009; Nobre et al., 2012).
Given the evidence that temporal expectations may modulate different brain areas through similar mechanisms, an important next step is to understand whether there are sources of temporal expectations beyond the entrainment of task-relevant areas. For example, left intraparietal sulcus has been implicated in the control of temporal attention for different types of task demands regardless of motor output (Cotti et al., 2011; Davranche et al., 2011; Marchant and Driver, 2012). However, it is difficult to tell whether this activation precedes, and controls, modulation of sensory or motor areas leading to performance benefits, or whether it is a downstream consequence of activity in perceptual or motor areas becoming structured according to temporal regularities in the stimulus stream.
In conclusion, our results suggest that the role of oscillations in regulating neural excitability is pervasive and operates in different levels of information and brain areas and that the entrainment of low-frequency oscillations to external events is an important mechanism for the enhancement of perceptual processing.
Footnotes
This work was funded by the Wellcome Trust WT 089903 (A.C.N.). In addition, the research was supported by the National Institute for Health Research (NIHR) Oxford Biomedical Research Centre based at Oxford University Hospitals Trust, Oxford University as part of the Cognitive Health program. The views expressed are those of the author(s) and not necessarily those of the National Health Service, the NIHR, or the Department of Health. A.M.C. was supported by Fundação de Amparo à Pesquisa do Estado de São Paulo (FAPESP) and Coordenação de Aperfeiçoamento de Pessoal de Nível Superior (CAPES). V.W. was supported by the Fyssen Foundation.
The authors declare no competing financial interests.
References
- AEEGS. American Electroencephalographic Society guidelines for standard electrode position nomenclature. J Clin Neurophysiol. 1991;8:200–202. [PubMed] [Google Scholar]
- Anderson B, Sheinberg DL. Effects of temporal context and temporal expectancy on neural activity in inferior temporal cortex. Neuropsychologia. 2008;46:947–957. doi: 10.1016/j.neuropsychologia.2007.11.025. [DOI] [PMC free article] [PubMed] [Google Scholar]
- Barnes R, Jones MR. Expectancy, attention, and time. Cogn Psychol. 2000;41:254–311. doi: 10.1006/cogp.2000.0738. [DOI] [PubMed] [Google Scholar]
- Berens P. CircStat: a MATLAB Toolbox for circular statistics. J Stat Softw. 2009;31:128–129. [Google Scholar]
- Besle J, Schevon CA, Mehta AD, Lakatos P, Goodman RR, McKhann GM, Emerson RG, Schroeder CE. Tuning of the human neocortex to the temporal dynamics of attended events. J Neurosci. 2011;31:3176–3185. doi: 10.1523/JNEUROSCI.4518-10.2011. [DOI] [PMC free article] [PubMed] [Google Scholar]
- Brainard DH. The Psychophysics Toolbox. Spat Vis. 1997;10:433–436. [PubMed] [Google Scholar]
- Busch NA, Dubois J, VanRullen R. The phase of ongoing EEG oscillations predicts visual perception. J Neurosci. 2009;29:7869–7876. doi: 10.1523/JNEUROSCI.0113-09.2009. [DOI] [PMC free article] [PubMed] [Google Scholar]
- Carrasco M. Visual attention: the past 25 years. Vision Res. 2011;51:1484–1525. doi: 10.1016/j.visres.2011.04.012. [DOI] [PMC free article] [PubMed] [Google Scholar]
- Correa A, Lupiáñez J, Tudela P. Attentional preparation based on temporal expectancy modulates processing at the perceptual level. Psychon Bull Rev. 2005;12:328–334. doi: 10.3758/bf03196380. [DOI] [PubMed] [Google Scholar]
- Correa A, Lupiáñez J, Madrid E, Tudela P, Correa Á. Temporal attention enhances early visual processing: a review and new evidence from event-related potentials. Brain Res. 2006;1076:116–128. doi: 10.1016/j.brainres.2005.11.074. [DOI] [PubMed] [Google Scholar]
- Cotti J, Rohenkohl G, Stokes M, Nobre AC, Coull JT. Functionally dissociating temporal and motor components of response preparation in left intraparietal sulcus. Neuroimage. 2011;54:1221–1230. doi: 10.1016/j.neuroimage.2010.09.038. [DOI] [PMC free article] [PubMed] [Google Scholar]
- Cravo AM, Rohenkohl G, Wyart V, Nobre AC. Endogenous modulation of low frequency oscillations by temporal expectations. J Neurophysiol. 2011;106:2964–2972. doi: 10.1152/jn.00157.2011. [DOI] [PMC free article] [PubMed] [Google Scholar]
- Davranche K, Nazarian B, Vidal F, Coull J. Orienting attention in time activates left intraparietal sulcus for both perceptual and motor task goals. J Cogn Neurosci. 2011;23:3318–3330. doi: 10.1162/jocn_a_00030. [DOI] [PubMed] [Google Scholar]
- Doherty JR, Rao A, Mesulam MM, Nobre AC. Synergistic effect of combined temporal and spatial expectations on visual attention. J Neurosci. 2005;25:8259–8266. doi: 10.1523/JNEUROSCI.1821-05.2005. [DOI] [PMC free article] [PubMed] [Google Scholar]
- Ghose G, Bearl DW. Attention directed by expectations enhances receptive fields in cortical area MT. Vision Res. 2010;50:441–451. doi: 10.1016/j.visres.2009.10.003. [DOI] [PMC free article] [PubMed] [Google Scholar]
- Ghose GM, Maunsell JHR. Attentional modulation in visual cortex depends on task timing. Nature. 2002;419:616–620. doi: 10.1038/nature01057. [DOI] [PubMed] [Google Scholar]
- Gomez-Ramirez M, Kelly SP, Molholm S, Sehatpour P, Schwartz TH, Foxe JJ. Oscillatory sensory selection mechanisms during intersensory attention to rhythmic auditory and visual inputs: a human electrocorticographic investigation. J Neurosci. 2011;31:18556–18567. doi: 10.1523/JNEUROSCI.2164-11.2011. [DOI] [PMC free article] [PubMed] [Google Scholar]
- Griffin IC, Miniussi C, Nobre AC. Multiple mechanisms of selective attention: differential modulation of stimulus processing by attention to space or time. Neuropsychologia. 2002;40:2325–2340. doi: 10.1016/s0028-3932(02)00087-8. [DOI] [PubMed] [Google Scholar]
- Jaramillo S, Zador AM. The auditory cortex mediates the perceptual effects of acoustic temporal expectation. Nat Neurosci. 2011;14:246–251. doi: 10.1038/nn.2688. [DOI] [PMC free article] [PubMed] [Google Scholar]
- Jepma M, Wagenmakers EJ, Nieuwenhuis S. Temporal expectation and information processing: a model-based analysis. Cognition. 2012;122:426–441. doi: 10.1016/j.cognition.2011.11.014. [DOI] [PubMed] [Google Scholar]
- Jones MR. Time, our lost dimension: toward a new theory of perception, attention, and memory. Psychol Rev. 1976;83:323–355. [PubMed] [Google Scholar]
- Jones MR, Moynihan H, MacKenzie N, Puente J. Temporal aspects of stimulus-driven attending in dynamic arrays. Psychol Sci. 2002;13:313–319. doi: 10.1111/1467-9280.00458. [DOI] [PubMed] [Google Scholar]
- Jones MR, Johnston HM, Puente J. Effects of auditory pattern structure on anticipatory and reactive attending. Cogn Psychol. 2006;53:59–96. doi: 10.1016/j.cogpsych.2006.01.003. [DOI] [PubMed] [Google Scholar]
- Kayser C, Montemurro MA, Logothetis NK, Panzeri S. Spike-phase coding boosts and stabilizes information carried by spatial and temporal spike patterns. Neuron. 2009;61:597–608. doi: 10.1016/j.neuron.2009.01.008. [DOI] [PubMed] [Google Scholar]
- Klein JM, Jones MR. Effects of attentional set and rhythmic complexity on attending. Percept Psychophys. 1996;58:34–46. doi: 10.3758/bf03205473. [DOI] [PubMed] [Google Scholar]
- Lakatos P, Karmos G, Mehta AD, Ulbert I, Schroeder CE. Entrainment of neuronal oscillations as a mechanism of attentional selection. Science. 2008;320:110–113. doi: 10.1126/science.1154735. [DOI] [PubMed] [Google Scholar]
- Lakatos P, O'Connell MN, Barczak A, Mills A, Javitt DC, Schroeder CE. The leading sense: supramodal control of neurophysiological context by attention. Neuron. 2009;64:419–430. doi: 10.1016/j.neuron.2009.10.014. [DOI] [PMC free article] [PubMed] [Google Scholar]
- Lima B, Singer W, Neuenschwander S. Gamma responses correlate with temporal expectation in monkey primary visual cortex. J Neurosci. 2011;31:15919–15931. doi: 10.1523/JNEUROSCI.0957-11.2011. [DOI] [PMC free article] [PubMed] [Google Scholar]
- Liu T, Abrams J, Carrasco M. Voluntary attention enhances contrast appearance. Psychol Sci. 2009;20:354–362. doi: 10.1111/j.1467-9280.2009.02300.x. [DOI] [PMC free article] [PubMed] [Google Scholar]
- Marchant JL, Driver J. Visual and audiovisual effects of isochronous timing on visual perception and brain activity. Cereb Cortex. 2012 doi: 10.1093/cercor/bhs095. Advance online publication. Retrieved April 24th, 2012. [DOI] [PMC free article] [PubMed] [Google Scholar]
- Maris E, Oostenveld R. Nonparametric statistical testing of EEG- and MEG-data. J Neurosci Methods. 2007;164:177–190. doi: 10.1016/j.jneumeth.2007.03.024. [DOI] [PubMed] [Google Scholar]
- Mathewson KE, Fabiani M, Gratton G, Beck DM, Lleras A. Rescuing stimuli from invisibility: inducing a momentary release from visual masking with pre-target entrainment. Cognition. 2010;115:186–191. doi: 10.1016/j.cognition.2009.11.010. [DOI] [PubMed] [Google Scholar]
- Ng BSW, Schroeder T, Kayser C. A precluding but not ensuring role of entrained low-frequency oscillations for auditory perception. J Neurosci. 2012;32:12268–12276. doi: 10.1523/JNEUROSCI.1877-12.2012. [DOI] [PMC free article] [PubMed] [Google Scholar]
- Ng BSW, Logothetis NK, Kayser C. EEG phase patterns reflect the selectivity of neural firing. Cereb Cortex. 2013;23:389–398. doi: 10.1093/cercor/bhs031. [DOI] [PubMed] [Google Scholar]
- Nobre AC, Rohenkohl G, Stokes M. Nervous anticipation: top-down biasing across space and time. In: Posner MI, editor. Cognitive neuroscience of attention. Ed 2. New York: Guilford; 2012. pp. 159–186. [Google Scholar]
- O'Connell RG, Dockree PM, Kelly SP. A supramodal accumulation-to-bound signal that determines perceptual decisions in humans. Nat Neurosci. 2012;15:1729–1735. doi: 10.1038/nn.3248. [DOI] [PubMed] [Google Scholar]
- Oostenveld R, Fries P, Maris E, Schoffelen JM. FieldTrip: Open source software for advanced analysis of MEG, EEG, and invasive electrophysiological data. Comput Intell Neurosci. 2011;2011:156869. doi: 10.1155/2011/156869. [DOI] [PMC free article] [PubMed] [Google Scholar]
- Palmer J, Huk AC, Shadlen MN. The effect of stimulus strength on the speed and accuracy of a perceptual decision. J Vis. 2005;5:376–404. doi: 10.1167/5.5.1. [DOI] [PubMed] [Google Scholar]
- Praamstra P, Kourtis D, Kwok HF, Oostenveld R. Neurophysiology of implicit timing in serial choice reaction-time performance. J Neurosci. 2006;26:5448–5455. doi: 10.1523/JNEUROSCI.0440-06.2006. [DOI] [PMC free article] [PubMed] [Google Scholar]
- Prins N, Kingdom F. Palamedes: Matlab routines for analyzing psychophysical data. 2009 http://www.palamedestoolbox.org. [Google Scholar]
- Rohenkohl G, Nobre AC. Alpha oscillations related to anticipatory attention follow temporal expectations. J Neurosci. 2011;31:14076–14084. doi: 10.1523/JNEUROSCI.3387-11.2011. [DOI] [PMC free article] [PubMed] [Google Scholar]
- Rohenkohl G, Cravo AM, Wyart V, Nobre AC. Temporal expectation improves the quality of sensory information. J Neurosci. 2012;32:8424–8428. doi: 10.1523/JNEUROSCI.0804-12.2012. [DOI] [PMC free article] [PubMed] [Google Scholar]
- Rolke B, Hofmann P. Temporal uncertainty degrades perceptual processing. Psychon Bull Rev. 2007;14:522–526. doi: 10.3758/bf03194101. [DOI] [PubMed] [Google Scholar]
- Schroeder CE, Lakatos P. Low-frequency neuronal oscillations as instruments of sensory selection. Trends Neurosci. 2009;32:9–18. doi: 10.1016/j.tins.2008.09.012. [DOI] [PMC free article] [PubMed] [Google Scholar]
- Sergent C, Baillet S, Dehaene S. Timing of the brain events underlying access to consciousness during the attentional blink. Nat Neurosci. 2005;8:1391–1400. doi: 10.1038/nn1549. [DOI] [PubMed] [Google Scholar]
- Stefanics G, Hangya B, Hernádi I, Winkler I, Lakatos P, Ulbert I. Phase entrainment of human delta oscillations can mediate the effects of expectation on reaction speed. J Neurosci. 2010;30:13578–13585. doi: 10.1523/JNEUROSCI.0703-10.2010. [DOI] [PMC free article] [PubMed] [Google Scholar]
- Vangkilde S, Coull JT, Bundesen C. Great expectations: temporal expectation modulates perceptual processing speed. J Exp Psychol Hum Percept Perform. 2012;38:1183–1191. doi: 10.1037/a0026343. [DOI] [PubMed] [Google Scholar]
- Wyart V, Dehaene S, Tallon-Baudry C. Early dissociation between neural signatures of endogenous spatial attention and perceptual awareness during visual masking. Front Hum Neurosci. 2011;6:16. doi: 10.3389/fnhum.2012.00016. [DOI] [PMC free article] [PubMed] [Google Scholar]
- Wyart V, Nobre AC, Summerfield C. Dissociable prior influences of signal probability and relevance on visual contrast sensitivity. Proc Natl Acad Sci U S A. 2012a;109:3593–3598. doi: 10.1073/pnas.1120118109. [DOI] [PMC free article] [PubMed] [Google Scholar]
- Wyart V, de Gardelle V, Scholl J, Summerfield C. Rhythmic fluctuations in evidence accumulation during decision making in the human brain. Neuron. 2012b;76:847–858. doi: 10.1016/j.neuron.2012.09.015. [DOI] [PMC free article] [PubMed] [Google Scholar]