

Abstract
Large-scale cattle and crop production are the primary drivers of deforestation in the Amazon today. Such land-use changes can degrade stream ecosystems by reducing connectivity, changing light and nutrient inputs, and altering the quantity and quality of streamwater. This study integrates field data from 12 catchments with satellite-derived information for the 176 000 km2 upper Xingu watershed (Mato Grosso, Brazil). We quantify recent land-use transitions and evaluate the influence of land management on streamwater temperature, an important determinant of habitat quality in small streams. By 2010, over 40 per cent of catchments outside protected areas were dominated (greater than 60% of area) by agriculture, with an estimated 10 000 impoundments in the upper Xingu. Streams in pasture and soya bean watersheds were significantly warmer than those in forested watersheds, with average daily maxima over 4°C higher in pasture and 3°C higher in soya bean. The upstream density of impoundments and riparian forest cover accounted for 43 per cent of the variation in temperature. Scaling up, our model suggests that management practices associated with recent agricultural expansion may have already increased headwater stream temperatures across the Xingu. Although increased temperatures could negatively impact stream biota, conserving or restoring riparian buffers could reduce predicted warming by as much as fivefold.
Keywords: riparian forests, agriculture, land management, pasture, soya beans
1. Introduction
The recent expansion of cattle ranching and soya bean agriculture has fundamentally changed the landscape of the southern Amazon by replacing native forests and savannahs with pasture grasses and croplands. These land-use/cover changes (LUCs) can have a number of consequences for freshwater ecosystems, including degrading riparian areas [1], altering hydrological cycles [2,3] and decreasing hydrologic connectivity (defined as the ‘water-mediated transfer of matter, energy or organisms within or between elements of the hydrologic cycle’ [4,5])—with the potential to impact fisheries, hydroelectric energy generation and food production. Some of these impacts are inevitable trade-offs associated with agricultural development in the tropics, whereas others could be substantially mitigated through improved land management. Numerous studies have demonstrated the negative consequences of agriculture for stream ecosystems and explored the role of riparian buffers in mitigating these impacts [6–9], although relatively few have been focused in the tropics. Most field studies in the Amazon have been limited to the scale of small watersheds and fail to consider the cumulative, landscape-scale effects of agricultural expansion.
This study integrates field-based data and satellite-derived information to quantify the influence of recent agricultural expansion (2001–2010) on headwater streams in the Xingu basin, a rapidly changing agricultural landscape in Mato Grosso, Brazil (figure 1). We focus on stream temperature because it is an important determinant of habitat quality [11,12] and, in small streams, is directly influenced by management decisions at the farm level. Specifically, increased stream temperatures have been linked to land management practices, including watershed deforestation [13], failure to conserve riparian forest buffers [7] and thermal pollution from river impoundments [14]. The integrated analysis presented here allows us to identify specific mechanisms by which agricultural LUC alters stream temperatures locally, as well as quantify the spatial distribution and prevalence of these management practices regionally.
Figure 1.
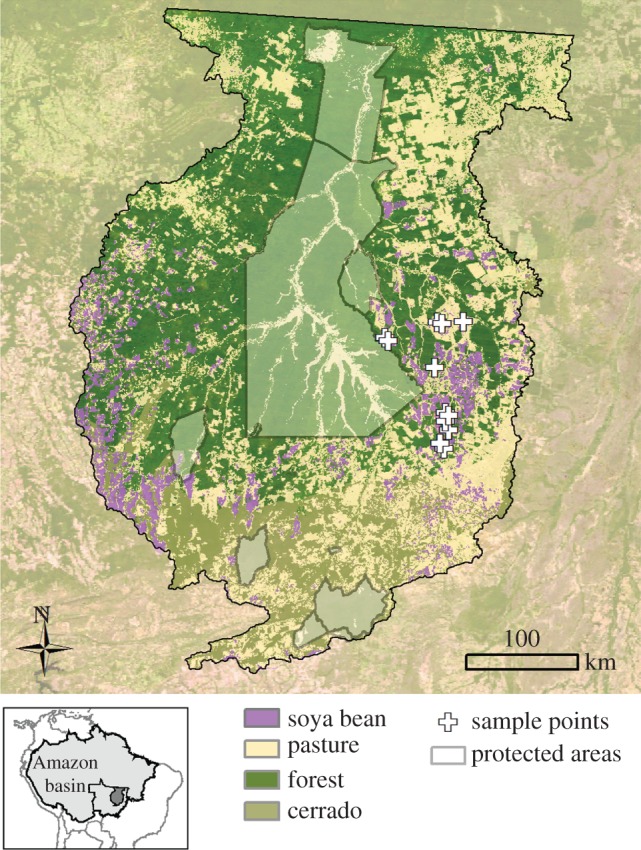
A map of the study area. The land cover classification was based on the MODIS EVI time series for 2010 [10]. White crosses indicate the long-term sampling locations to the east of the Xingu Indigenous Park. Lower left (inset): the upper Xingu basin is located in the southeastern Amazon basin within the state of Mato Grosso, Brazil.
(a). Stream thermal regimes
In small headwater streams (figure 2), roughly 82 per cent of heat exchange occurs at the air/water surface [15]. Diel variations are generally small in forested headwater streams, where riparian vegetation provides shade and shelter that maintains relatively cool and stable temperatures throughout the day [15]. These streams are particularly vulnerable to agricultural LUCs, which can reduce streamside vegetation, exposing streams to increased solar radiation [13]. The resulting temperature increases may be exacerbated by the fact that, compared with forests, pasture grasses and soya beans have a lower leaf area and shallower rooting depth, which leads to reduced evapotranspiration [16] and net increases in surface temperatures [17]. In Brazil's agricultural frontier, these changes have been associated with increased stream discharge [2,3] and air temperatures [18], which in turn may influence diel and annual streamwater temperature cycles.
Figure 2.
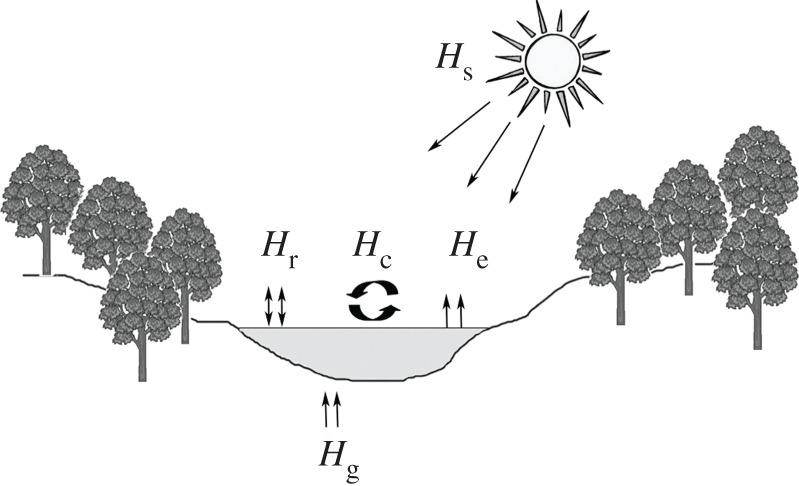
River heat exchange processes. Heat exchange at the air/water interface occurs as a result of: (i) solar (net shortwave) radiation (Hs); (ii) net long-wave radiation (Hr); (iii) latent heat flux due to evaporation (He); and (iv) sensible heat flux (Hc) owing to conduction and convection as a result of river–atmosphere temperature differences. Heat flux at the streambed/water interface is primarily a function of groundwater contributions (Hg) and subsurface exchange. Adapted from Caissie [13].
Stream temperature patterns exert a strong influence on the evolution, distribution and ecology of aquatic organisms [19,20]. This is due, in large part, to the fact that most aquatic organisms are strict ectotherms, with each species having evolved to occupy a specific thermal niche [21]. Higher water temperatures can directly impact basic life-history parameters, including incubation and development time [22], growth rates [23], metabolism [24] and survival. They may also have indirect effects by facilitating the spread of invasive species and disease [25], increasing the toxicity of environmental contaminants [26], and constraining the abundance and distribution of species [13,27].
(b). Riparian forest buffers
In temperate systems, studies indicate that temperature is a critical determinant of suitable fish habitat and that the influence of human activity on stream thermal regimes has had a strong negative influence on the quality and distribution of available habitat [28,29]. These relationships have not been well explored in tropical streams, but there is some evidence that they are governed by similar mechanisms. In Costa Rica, for example, riparian forest removal and associated increases in stream temperature have been shown to alter the taxonomic composition of benthic macroinvertebrates, reduce diversity and eliminate the most sensitive taxa [30]. Similarly, the removal of riparian buffers in pasture areas increased temperature, reduced inputs of organic matter and altered fish community composition compared with streams with intact buffers [7]. A recent study in the Xingu basin also suggests that the diversity of Odonata decreased with increasing temperature [31].
(c). Small impoundments
The effects of elevated mean temperature may be exacerbated by increases in diel temperature variability or fragmentation by impoundments, physical barriers that alter the flow of water, sediments and organisms within headwater streams. In the Amazon's agricultural frontier, small impoundments have historically been associated with local hydroelectric power production, the expansion of the road network and provision of drinking water for cattle. Several studies indicate that these small, surface release dams can have a large cumulative impact on stream habitats by increasing water temperature [32]; changing current velocity, water volume and depth above and below reservoirs [33]; and trapping fine sediments as a result of the slackwater created behind reservoirs [34]. When coupled with agricultural land uses, which often increase the supply of sediments and pollutants, impoundments have the potential to fundamentally alter the geomorphology and habitat quality of streams.
Despite the importance of temperature in structuring stream ecosystems and the increasing pace of anthropogenic changes in many tropical regions, few studies exist on the influence of LUC on the temperature regimes of tropical streams. Most information on stream temperatures is scattered in the literature, having been collected as routine background information during site-specific ecological studies. Rarely is temperature the focus of study and, as a result, temperature measurements are usually not collected at sufficient temporal or spatial resolution to provide insights into diel and annual patterns, nor how human activity may alter these patterns. This study is among the first to combine satellite-based observations of LUC and management with long-term field observations of water temperature in small tropical streams. We address four central questions:
(1) How have the spatial distributions of soya bean agriculture and cattle ranching changed over the past decade within small watersheds in the upper Xingu basin?
(2) How does watershed land-use history relate to the distribution of farm impoundments in the Xingu landscape?
(3) How does streamwater temperature vary with land management variables (i.e. watershed forest cover, riparian buffers and impoundments) at the catchment scale?
(4) How might current land-use practices (i.e. riparian forest conservation and stream impoundment) be managed to mitigate the regional impacts of agricultural expansion on headwater stream temperature?
2. Material and methods
(a). Study area and general approach
The headwaters of the Xingu occur on the Mato Grosso plateau (approx. 600 m elevation), which has low topographic relief and slopes gently from the southern headwaters towards the Amazon river in the north. Upland areas in the southern part of the study region are dominated by cerrado, a mixed savannah and woodland ecosystem, with gallery forests occurring in the wetter areas along stream corridors. The remainder of the study area occurs within the Amazon biome and is dominated by transitional forests, with an average height of 20 m and leaf area index ranging from 4 to 5.5 [35]. The rainfall gradient is consistent with this vegetation transition, with lower rainfall in the south and higher rainfall in the north. Average annual precipitation in the region ranges from 1500 to 2400 mm and is highly seasonal, with a pronounced dry season from May to August, a pronounced rainy season from November to February, and intermediate levels of rainfall in the interim months [36].
We established long-term sampling points in 12 headwater catchments within the forest biome to the east of the Xingu Indigenous Park (figure 1). Rather than characterize the spatial variability of temperature within individual streams, our sampling approach aimed to understand variations through time and across streams under different management scenarios. Each sample point drained a catchment area dominated by a single land cover, with four catchments in forest, three in pasture and five in soya beans. Catchment areas ranged in size from 5 to 23 km2. To the extent possible, sites were selected to encompass a range of land management scenarios with varying land use, riparian forest cover and upstream impoundment densities (see the electronic supplementary material, table S1). All soya bean watersheds in this study were converted from pasture after 2000, a land-use history that is typical of soya bean areas in the region [10].
(b). Remote sensing of land-use dynamics
To map recent (2001–2010) land-use transitions within the Xingu basin, we used the enhanced vegetation index (EVI) data product collected by the moderate resolution imaging spectroradiometer (MODIS), as described in previous studies [10]. The repeat interval of the MODIS sensor (approx. 2 days) offers advantages over that of higher resolution alternatives (16+ days) because it allows for greater cloud-free coverage during the rainy season, when agricultural land uses (e.g. pasture and cropland) are spectrally distinct. To distinguish between pasture and savannah, we fused our MODIS-based classification [10] with an existing time series of cerrado extent [37,38]. The final classification was used to determine the proportion of soya beans, pasture, forest and cerrado within small watersheds in the upper Xingu basin. Our unit of analysis was the smallest hydrological unit defined by Brazil's National Water Agency (ANA), which totals 2851 watersheds (mean area of approx. 61 km2) in the upper Xingu basin [39].
To map the distribution of farm impoundments in the Xingu region, we used a high-resolution (15 m) image mosaic, which comprised 89 image tiles acquired primarily in 2007 by the advanced space-borne thermal emission and reflection radiometer (ASTER). Our object-oriented classification approach used the Trimble eCognition software package to perform image segmentation and subsequent extraction of object-level attributes (see the electronic supplementary material). Based on these attributes and ground data collected in August 2010, we classified impoundment and non-impoundment segments, using the randomForest classification tree algorithm in R [40]. Finally, we estimated the density of impoundments in the landscape and assessed how their distribution was influenced by land-use history (see the electronic supplementary material).
Catchment boundaries for our sample streams were delineated, using vegetation-corrected shuttle radar topography mission data, as described by Hayhoe et al. [3]. For the 12 study catchments, we used a 2009 Landsat 5 image mosaic to create a finer-scale (30 m) analysis of riparian forest and agricultural cover in the watershed (see the electronic supplementary material). The final classification consisted of four classes—agriculture, forest, water and wetland—and was generated using the randomForest algorithm (see the electronic supplementary material). This classification was used to summarize percentage agriculture in each watershed, as well as the percentage forest cover in riparian buffer areas defined by 30, 100 and 500 m upstream of each sampling point. All buffers were defined as 30 m wide, in keeping with requirements under the Brazilian Forest Code during the sampling period [41]. Accuracy assessments for each of the remote sensing analyses described earlier are provided in the electronic supplementary material, table S3.
(c). Field measurements of stream temperature
To measure stream temperature at each sample catchment, we deployed HOBO Pendant temperature and light data loggers (Onset; Bourne, MA, USA) to record water temperature and light (lux) every 30 min. Each sample point was paired with one of nine weather stations that logged precipitation events and hourly air temperature. The present analysis focuses on 16 months of data (August 2009–December 2010) collected by the data loggers at each site. In order to verify that the temperature patterns observed in this study were representative of a typical year, we also examined a longer time series, consisting of hourly temperature data collected in a subset of the study area from 2007 to 2010 [3].
To directly measure the effect of impoundments on stream temperature, we placed pairs of synchronized temperature loggers upstream and downstream of six typical impoundments, each located on a different headwater stream under soya bean cultivation (July 2010). The rate of temperature recovery was evaluated by installing a series of 11 loggers downstream of one of these impoundments. Preliminary area estimates derived from ASTER (lower limit of detection of approx. 0.0002 km2) indicated that the impoundment sampled was comparable in area (approx. 0.03 km2) to others found in the region (mean: approx. 0.02 km2, median: approx. 0.01 km2). One (baseline) logger was placed immediately upstream of the impoundment; two loggers were placed at the outlets of the impoundment and averaged to yield the mean temperature 0 m below the impoundment; seven loggers were placed downstream of the impoundment outlet, from 0 to 1050 m at 150 m intervals; and one logger was placed approximately 2350 m downstream. The riparian forest buffer downstream of the impoundment was intact (greater than 30 m) along the entire length of the temperature transect.
(d). Predictors of stream temperature
In addition to land use/cover, we considered several potential predictor variables that have been shown to affect stream temperature [13], including precipitation; percentage light transmitted at the sample location (from hemispheric photographs); light at the stream surface (lux); air temperature; number and density of upstream impoundments; distance to the nearest impoundment; percentage forest cover in riparian buffers at 30, 100 and 500 m upstream from the sample location; and percentage forest cover in the watershed. Because extreme temperatures and diel variability are more likely to limit aquatic organisms than mean temperature, we used the upper quantile (75% probability) daytime temperature as the dependent variable. Light and rainfall data were log-transformed for analysis and all covariates were standardized to facilitate interpretability across variables [42].
We conducted exploratory analyses to examine the importance of each predictor variable and choose the optimal (temporal or spatial) lag for predicting stream temperature (see the electronic supplementary material). After eliminating collinear variables, we developed linear mixed models to explore the relative importance of different land management variables in predicting observed stream temperature (see the electronic supplementary material, table S2). The final model included the following variables: percentage forest in the upstream riparian buffer (30 m wide × 500 m long); air temperature; (log) light at the stream surface; (log) weekly rainfall, with a two-week lag; density of impoundments upstream of the sampling location; a term reflecting the interaction between riparian forest buffers and air temperature; and a random effect term, which included sampling month and location to account for seasonality and repeated measures at each site [43].
(e). Landscape-scale temperature modelling
To provide insights into potential management strategies for mitigating the impacts of agricultural expansion on headwater stream temperature, we used the relationships established by the catchment-level temperature model to scale up our analysis to the entire Xingu landscape. First, we calculated the impoundment density for each small watershed based on our impoundment map and a government stream map [39], using the ANA watershed boundaries as our unit of analysis. Next, we used gridded climatological datasets to calculate the long-term mean values for air temperature [44] and rainfall [45] in each watershed. Based on these datasets, we estimated headwater stream temperature for the following three scenarios: 100, 50 and 0 per cent conservation of riparian buffers in agricultural areas. Watersheds within protected areas were assumed to have 100 per cent riparian cover in all three scenarios. Although land use was not included as a predictor in the temperature model, we used our 2010 land-use map to constrain the analysis to existing agricultural areas where riparian forests could be managed (deforested or restored). The final results for each scenario were expressed as the deviation from a hypothetical reference scenario, which assumed 100 per cent riparian conservation and no impoundments for all small watersheds.
3. Results
(a). Xingu basin land-use changes
Remote sensing analyses of the spatial distribution of pasture and soya beans in the upper Xingu basin indicated that the number of small watersheds dominated by agriculture doubled over the past decade. Whereas in 2000 14 per cent of watersheds outside protected areas had over half of their area occupied by agriculture, by 2010 this number had increased to 28 per cent. In 2001, the average watershed had 25 per cent of its area occupied by agriculture, nearly all of it in pasture. Cattle ranching continued to expand throughout the upper Xingu and, by 2010, dominated many of the watersheds south and east of the Xingu Indigenous Park (figure 3a). By 2010, the average watershed had 40 per cent of its area occupied by agriculture, with over 15 per cent in soya beans and the remainder in pasture. The areas of most rapid soya bean expansion were the watersheds close to the BR-163 highway in the western Xingu and the municipality of Querência, to the east of the park (figure 3b).
Figure 3.

Proportion of Xingu microbasins occupied by cattle ranching (a) and soya beans (b) in 2001 (i) and 2010 (ii). Watershed boundaries were acquired from the Brazilian Water Agency [39] and land use from our MODIS-based classification.
(b). Influence of land use on impoundments
Based on our ASTER classification, we estimated that there were approximately 10 000 impoundments in the upper Xingu basin as of 2007 (see the electronic supplementary material, table S4). With few exceptions, all of these occurred in headwater streams outside protected areas, averaging one impoundment per 7.4 km of stream. In 2007, the concentration of impoundments in pasture areas (0.14 km2) was twice as high as that in soya bean areas (0.06 km2), whereas the concentration in cerrado (0.05 km2) and forest (0.02 km2) areas was lower than that in either agricultural land use (see the electronic supplementary material, figure S1). A chi-squared test confirmed that the distribution of impoundments was not independent of land use (p = 0.001). Pasture areas and cropland areas with a pasture legacy were more likely to have impoundments than all other land-use categories (see the electronic supplementary material, table S4 for details).
(c). Correlates of stream temperature
The integration of remote sensing and field-based measurements provided new insights into the relationships between landscape management and catchment-scale stream temperature. In general, water temperature in reference (forested) watersheds was cooler and less variable than that in agricultural watersheds (figure 4). During the 16 months of sampling, the mean daily maximum temperature in forested streams (25.8±0.03°C, mean±s.e., n = 486) was more than 4°C cooler than pasture (30.1±0.1°C, mean±s.e., n = 486) and 3°C cooler than soya bean (29.0±0.05°C, mean±s.e., n = 486) streams (figure 4b). Streams in forested watersheds were relatively buffered against extreme temperatures compared with those in agricultural watersheds. This buffering capacity is illustrated by the fact that stream temperatures in pasture watersheds frequently exceeded 30°C during the hottest part of the day and reached a daily maximum between 35°C and 36°C on several occasions, whereas forested streams had an absolute maximum of 27°C during the entire time series. A comparison of long-term data in soya bean and forest watersheds indicated that stream temperature was highly seasonal and followed a sinusoidal pattern, with higher temperatures during the peak of the rainy season (austral summer) and lower temperatures during the dry season. This pattern mirrored seasonal variations in air temperature, and differences among forested and soya bean watersheds were consistent across years (see the electronic supplementary material, figure S2).
Figure 4.
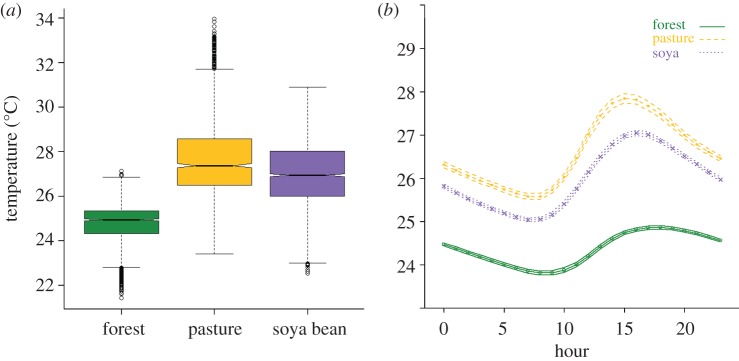
Relationship between land use and stream temperature. (a) A summary of daytime stream temperature (upper quantile) by land use. Land use is a significant predictor of stream temperature (p < 0.001, r2 = 0.38). (b) Mean diel temperature patterns, with bootstrapped non-parametric confidence intervals. The x-axis represents the hour of the day (0–23), and the y-axis represents the mean hourly temperature (°C).
Although soya bean and pasture catchments were both associated with warmer streamwater temperatures, they exhibited different patterns in management-related covariates (see the electronic supplementary material, table S1). We developed linear mixed models (see the electronic supplementary material, table S2) to understand the relative importance of each predictor, while controlling for environmental variables (rainfall, air temperature and light). Upstream riparian forests and impoundment density were the most important predictors (see the electronic supplementary material, figure S3), jointly accounting for 43 per cent of the variation in stream temperature, followed by air temperature, which accounted for 13 per cent of the variation (see the electronic supplementary material, figure S5). Riparian forests showed a significant interaction with air temperature (p < 0.001), with the former having a strong cooling effect and the latter having a strong warming effect. The interaction parameter indicated that (at average stream temperatures) each additional unit of riparian forest resulted in a 17.5 per cent reduction in the warming effect of air temperature, supporting the notion that riparian forests serve an important buffering function.
Direct measurements of temperature upstream and downstream of impoundments indicated that they had a pronounced warming effect. Both mean and upper quantile temperatures downstream of the impoundments were significantly warmer than temperatures upstream (ANOVA, p < 0.001; see the electronic supplementary material, figure S4a), with a mean temperature increase of 1.7±0.39°C (mean±s.e., n = 6). Results from the transect below one of these impoundments indicated a linear pattern of recovery downstream, as riparian shading and groundwater inputs brought the temperature back towards equilibrium. The temperature had not completely recovered to the baseline level 2.4 km downstream of the impoundment (see the electronic supplementary material, figure S4b).
(d). Managing stream temperature in agricultural landscapes
To understand how land-use practices (i.e. stream impoundments and riparian buffers) might be managed to reduce the impacts of agricultural production on small streams, we combined the impoundment map with field measurements of temperature recovery and estimated the proportion of the stream network altered by impoundment-induced warming. Based on the downstream temperature transect, we estimated a cooling rate of 0.6±0.08°C km−1 (mean±s.e., n = 9). Given this cooling rate and the mean change in temperature (ΔT) below impoundments, the average recovery distance would be 2.74 km downstream of the outlet. Assuming that these measured relationships were representative of the average impoundment, we estimated that 37 per cent (27 380 km) of the stream network outside protected areas was potentially under the thermal influence of impoundments in 2007. Including the average stream length occupied by the impoundments themselves (approx. 0.6 km) would increase this estimate to 45 per cent.
Scaling up these results to the Xingu landscape, we examined the potential for management of riparian forest cover to reduce land-use-related stream warming. To do this, we assumed that existing impoundments and agricultural lands were constant in the landscape and considered several scenarios of riparian forest conservation. As riparian forest conservation decreased from 100 to 0 per cent, the predicted ΔT—expressed as the deviation from a hypothetical reference scenario with no impoundments and 100 per cent riparian forest conservation—increased and the relative importance of existing impoundments as a driver of stream warming decreased (figure 5). Note that these scenarios project changes in mean upper quantile temperature and do not address diel or seasonal variability. Under the conservation scenario (100% riparian forest conservation), the mean ΔT in watersheds outside protected areas was 0.3°C±0.02°C (95% CI) and 1 per cent of watersheds had a ΔT > 2°C. Under the scenario with 50 per cent riparian forest conservation, the mean ΔT was 0.9°C±0.03°C (95% CI) and 8 per cent of watersheds outside protected areas had a ΔT > 2°C. Under the scenario with no riparian forest conservation, the mean ΔT was 1.5°C±0.04°C (95% CI) and 62 per cent of watersheds outside protected areas had a ΔT > 2°C.
Figure 5.

Predicted increases in mean daytime stream temperature (upper quantile) under different management scenarios. Temperature was calculated for each watershed [39] in the upper Xingu basin, and is expressed as the deviation from a hypothetical reference scenario that assumed no impoundments and 100 per cent riparian forest (RF) conservation. All three scenarios used the impoundment density (2007) and land use (2010) maps derived from this study. Riparian forest buffers were modelled as (a) 100%, (b) 50% and (c) 0% conserved within agricultural areas.
4. Discussion and conclusions
Global demand for agricultural products is expected to increase by as much as 70 per cent by 2050 [46], and tropical regions are the only remaining areas with land available to meet these demands [47]. Although socially and economically important, the expansion of industrial agriculture in the tropics involves a number of potential trade-offs [48], including the fragmentation and degradation of freshwater ecosystems and associated changes in stream temperature. Meeting growing food demands while minimizing the negative impacts of agricultural expansion will be one of the greatest challenges of the coming decades. Achieving it will require thoughtful landscape-scale management of agricultural lands and the development of region-specific mitigation strategies based on solid science. This study documents the extent to which agricultural expansion may be contributing to increased stream temperatures in southeastern Amazonia and expands our understanding of how to manage these impacts in this and other agricultural frontiers.
Despite recent reductions in deforestation in the southern Amazon, soya beans and cattle ranching are expanding and intensifying rapidly in the Xingu [10]. Within the past decade, small watersheds outside protected areas have seen a steady decline in forest cover and a proportional increase in agricultural land uses (figure 3). In addition to deforestation, cattle pastures are strongly associated with the installation of impoundments to provide drinking water for cattle. Previous research suggests that ranching is also associated with degradation of riparian areas, due both to direct effects of grazing and encroachment of pasture grasses into the stream channel [1]. Our impoundment analysis suggests that the fingerprint of this pasture legacy may be evident even after conversion to soya beans (see the electronic supplementary material, table S4 and figure S1). Furthermore, it appears that many impoundments are a by-product of the growing network of roads in the region, which may explain their presence in areas of natural vegetation, as well as those converted directly to soya beans.
Although little is known about the thermal tolerances of fish in this region, studies in other regions indicate that stream temperature increases on the order of 1°C—well below those reported here—can directly affect fish physiology, growth and behaviour [21,23,24]. At the catchment scale, our results indicate that land management can play an important role in mitigating these impacts by reducing land-use-related increases in stream temperature. The amount of forest cover in upstream riparian buffers is a key predictor of stream temperature, suggesting that the conservation and restoration of riparian buffers can help maintain stream habitats in agricultural landscapes. In this regard, temperature can serve as a simple and relatively inexpensive measure of the long-term impact of these efforts on the ground. The presence of instream impoundments also had a measurable impact on downstream temperature and, given the density of impoundments in the landscape, is likely to be an important factor in the overall integrity of the stream network. Although our sample locations captured a wide range in the variation of riparian forest cover, they were largely dominated by a single land use. Future research efforts could expand on this work by including a gradient of land-use/cover configurations that would lend more insights into the thresholds beyond which declines in stream integrity become evident.
At the landscape scale, our results confirm the importance of riparian buffers for mitigating the thermal impacts of land use and thereby buffering streams against land-use-related degradation. The Brazilian Forest Code requires the conservation of 30 m forest buffers around small streams (less than 10 m wide) and even wider buffers around springs and impoundments. Historically, compliance with these requirements has been low due to a combination of unclear land tenure, lack of capacity for monitoring and enforcement, and poor dissemination of the requirements to landholders. Recently, state and federal governments have made much progress in clarifying land tenure, educating landowners and improving enforcement through satellite-based monitoring and environmental licensing [49]. Extension activities through non-profit organizations and government programmes have raised awareness and built capacity for restoration of riparian areas in the region, although restoration is often challenging owing to high labour costs, a scarcity of native seedlings and low survival rates in areas with aggressive pasture grasses. Recent changes in Brazilian environmental legislation (finalized in late 2012) reduced the width requirements for riparian buffer restoration on small properties (less than 1000 ha on average), but maintained requirements for conservation of (existing) 30 m buffers on all properties. Our results do not address the potential consequences of these changes, both because of the limited (30 m) resolution of the satellite datasets used and because of a lack of empirical research into the ecological implications of different buffer widths.
Finally, this study highlights impoundments as a pervasive and previously undocumented threat to the headwaters of the Xingu. These water bodies are installed in an ad hoc manner in the landscape, primarily as a result of conversion for pasture and expansion of the road network. At least one impoundment is present in nearly all first- and second-order streams in agricultural watersheds in the Xingu basin and each is associated with measurable increases in stream temperature. Our landscape-scale analysis suggests that these impoundments may have a large cumulative impact on headwater streams by altering the thermal regimes, hydrology and connectivity of stream networks. This is of particular concern in the Xingu basin, where these changes to the headwaters have the potential to influence downstream water quality and fisheries within the Xingu Indigenous Park. While the existing impoundments cannot be easily removed, there has been considerable effort to disseminate sound management practices (e.g. fencing cattle out of riparian areas or installing artificial watering holes far from the riparian zone), which could reduce the need for additional impoundments. Mitigating the impacts of future agricultural expansion and intensification on stream quality would require expanding these efforts and limiting the number of impoundments in emerging agricultural landscapes.
Acknowledgements
We thank E. Davidson, P. Lefebvre, M. Fagan and two anonymous reviewers for helpful comments on earlier drafts of this manuscript. This work was supported by a National Aeronautics and Space Administration (NASA) Earth and Space Science Fellowship (NNX08AX08H) and grants from the Gordon and Betty Moore Foundation, the National Science Foundation (DEB0949996, DEB0743703, DEB0949370), the Packard Foundation and Brazilian Council for Scientific and Technological Development (CNPq). The Amazon Environmental Research Institute (IPAM) provided indispensable support for field data collection. We also thank Grupo A. Maggi, Grupo Roncador, José Marcolini e Outros and Fazendas Gabriela S/A for graciously providing access to their properties for this research.
References
- 1.Deegan L, Neill C, Haupert C, Ballester M, Krusche A, Victoria R, Thomas SM, Moor E. 2011. Amazon deforestation alters small stream structure, nitrogen biogeochemistry and connectivity to larger rivers. Biogeochemistry 105, 53–74 10.1007/s10533-010-9540-4 (doi:10.1007/s10533-010-9540-4) [DOI] [Google Scholar]
- 2.Coe MT, Latrubesse EM, Ferreira ME, Amsler ML. 2011. The effects of deforestation and climate variability on the streamflow of the Araguaia River, Brazil. Biogeochemistry 105, 119–131 10.1007/s10533-011-9582-2 (doi:10.1007/s10533-011-9582-2) [DOI] [Google Scholar]
- 3.Hayhoe SJ, Neill C, Porder S, McHorney R, Lefebvre P, Coe MT, Elsenbeer H, Krusche AV. 2011. Conversion to soy on the Amazonian agricultural frontier increases streamflow without affecting stormflow dynamics. Glob. Change Biol. 17, 1821–1833 10.1111/j.1365-2486.2011.02392.x (doi:10.1111/j.1365-2486.2011.02392.x) [DOI] [Google Scholar]
- 4.Freeman MC, Pringle CM, Jackson CR. 2007. Hydrologic connectivity and the contribution of stream headwaters to ecological integrity at regional scales. J. Am. Water Resource Assoc. 43, 5–14 10.1111/j.1752-1688.2007.00002.x (doi:10.1111/j.1752-1688.2007.00002.x) [DOI] [Google Scholar]
- 5.Pringle C. 2003. What is hydrologic connectivity and why is it ecologically important? Hydrol. Process. 17, 2685–2689 10.1002/hyp.5145 (doi:10.1002/hyp.5145) [DOI] [Google Scholar]
- 6.Uriarte M, Yackulic CB, Lim Y, Arce-Nazario JA. 2011. Influence of land use on water quality in a tropical landscape: a multi-scale analysis. Landscape Ecol. 26, 1151–1164 10.1007/s10980-011-9642-y (doi:10.1007/s10980-011-9642-y) [DOI] [PMC free article] [PubMed] [Google Scholar]
- 7.Lorion CM, Kennedy BP. 2009. Riparian forest buffers mitigate the effects of deforestation on fish assemblages in tropical headwater streams. Ecol. Appl. 19, 468–479 10.1890/08-0050.1 (doi:10.1890/08-0050.1) [DOI] [PubMed] [Google Scholar]
- 8.Gergel SE, Turner MG, Miller JR, Melack JM, Stanley EH. 2002. Landscape indicators of human impacts to riverine systems. Aquat. Sci. 64, 118–128 10.1015-1621/02/020118-11 (doi:10.1015-1621/02/020118-11) [DOI] [Google Scholar]
- 9.Benstead JP, Douglas MM, Pringle CM. 2003. Relationships of stream invertebrate communities to deforestation in eastern Madagascar. Ecol. Appl. 13, 1473–1490 10.1899/07-171.1 (doi:10.1899/07-171.1) [DOI] [Google Scholar]
- 10.Macedo M, DeFries R, Morton D, Stickler C, Galford G, Shimabukuro Y. 2012. Decoupling of deforestation and soy production in the southern Amazon during the late 2000s. Proc. Natl Acad. Sci. USA 109, 1341–1346 10.1073/pnas.1111374109 (doi:10.1073/pnas.1111374109) [DOI] [PMC free article] [PubMed] [Google Scholar]
- 11.Buisson L, Blanc L, Grenouillet G. 2008. Modelling stream fish species distribution in a river network: the relative effects of temperature versus physical factors. Ecol. Freshwater Fish. 17, 244–257 10.1111/j.1600-0633.2007.00276.x (doi:10.1111/j.1600-0633.2007.00276.x) [DOI] [Google Scholar]
- 12.Eaton JG, Scheller RM. 1996. Effects of climate warming on fish thermal habitat in streams of the United States. Limnol. Oceanogr. 41, 1109–1115 10.4319/lo.1996.41.5.1109 (doi:10.4319/lo.1996.41.5.1109) [DOI] [Google Scholar]
- 13.Caissie D. 2006. The thermal regime of rivers: a review. Freshwater Biol. 51, 1389–1406 10.1111/j.1365-2427.2006.01597.x (doi:10.1111/j.1365-2427.2006.01597.x) [DOI] [Google Scholar]
- 14.Webb BW, Nobilis F. 2007. Long-term changes in river temperature and the influence of climatic and hydrological factors. Hydrol. Sci. J. 52, 74–85 10.1623/hysj.52.1.74 (doi:10.1623/hysj.52.1.74) [DOI] [Google Scholar]
- 15.Evans EC, McGregor GR, Petts GE. 1998. River energy budgets with special reference to river bed processes. Hydrol. Process. 12, 575–595 (doi:10.1002/(SICI)1099-1085(19980330)12:4<575::AID-HYP595>3.0.CO;2-Y) [DOI] [Google Scholar]
- 16.Bruijnzeel LA. 2004. Hydrological functions of tropical forests: not seeing the soil for the trees? Agr. Ecosyst. Environ. 104, 185–228 10.1016/j.agee.2004.01.015 (doi:10.1016/j.agee.2004.01.015) [DOI] [Google Scholar]
- 17.Costa MH, Yanagi SNM, Souza PJOP, Ribeiro A, Rocha EJP. 2007. Climate change in Amazonia caused by soybean cropland expansion, as compared to caused by pastureland expansion. Geophys. Res. Lett. 34, L07706. 10.1029/2007GL029271 (doi:10.1029/2007GL029271) [DOI] [Google Scholar]
- 18.Loarie SR, Lobell DB, Asner GP, Mu QZ, Field CB. 2011. Direct impacts on local climate of sugar-cane expansion in Brazil. Nat. Clim. Change 1, 105–109 10.1038/nclimate1067 (doi:10.1038/nclimate1067) [DOI] [Google Scholar]
- 19.Ward JV, Stanford JA. 1982. Thermal responses in the evolutionary ecology of aquatic insects. Annu. Rev. Entomol. 27, 97–117 10.1146/annurev.en.27.010182.000525 (doi:10.1146/annurev.en.27.010182.000525) [DOI] [Google Scholar]
- 20.Ward JV. 1985. Thermal characteristics of running waters. Hydrobiologia 125, 31–46 10.1007/BF00045924 (doi:10.1007/BF00045924) [DOI] [Google Scholar]
- 21.Hochachka PW, Somero GN. 2002. Biochemical adaptation: mechanism and process in physiological evolution. New York, NY: Oxford University Press [Google Scholar]
- 22.Gillooly JF, Charnov EL, West GB, Savage VM, Brown JH. 2002. Effects of size and temperature on developmental time. Nature 417, 70–73 10.1038/417070a (doi:10.1038/417070a) [DOI] [PubMed] [Google Scholar]
- 23.Neuheimer AB, Thresher RE, Lyle JM, Semmens JM. 2011. Tolerance limit for fish growth exceeded by warming waters. Nat. Clim. Change 1, 110–113 10.1038/nclimate1084 (doi:10.1038/nclimate1084) [DOI] [Google Scholar]
- 24.Gillooly JF, Brown JH, West GB, Savage VM, Charnov EL. 2001. Effects of size and temperature on metabolic rate. Science 293, 2248–2251 10.1126/science.1061967 (doi:10.1126/science.1061967) [DOI] [PubMed] [Google Scholar]
- 25.Roth TR, et al. 2010. Stream temperature response to three riparian vegetation scenarios by use of a distributed temperature validated model. Environ. Sci. Technol. 44, 2072–2078 10.1021/es902654f (doi:10.1021/es902654f) [DOI] [PubMed] [Google Scholar]
- 26.Rehwoldt R, Menapace LW, Alessand D, Nerrie B. 1972. Effect of increased temperature upon acute toxicity of some heavy-metal ions. Bull. Environ. Contam. Toxicol. 8, 91–96 10.1007/BF01684513 (doi:10.1007/BF01684513) [DOI] [PubMed] [Google Scholar]
- 27.Vannote RL, Minshall GW, Cummins KW, Sedell JR, Cushing CE. 1980. The river continuum concept. Can. J. Fish Aquat. Sci. 37, 130–137 10.1139/f80-017 (doi:10.1139/f80-017) [DOI] [Google Scholar]
- 28.Franco EAD, Budy P. 2005. Effects of biotic and abiotic factors on the distribution of trout and salmon along a longitudinal stream gradient. Environ. Biol. Fishes 72, 379–391 10.1007/s10641-004-2591-4 (doi:10.1007/s10641-004-2591-4) [DOI] [Google Scholar]
- 29.Theurer FD, Lines I, Nelson T. 1985. Interaction between riparian vegetation, water temperature, and salmonid habitat in the Tucannon River. Water Resour. Bull. 21, 53–64 10.1111/j.1752-1688.1985.tb05351.x (doi:10.1111/j.1752-1688.1985.tb05351.x) [DOI] [Google Scholar]
- 30.Lorion CM, Kennedy BP. 2009. Relationships between deforestation, riparian forest buffers and benthic macroinvertebrates in neotropical headwater streams. Freshwater Biol. 54, 165–180 10.1111/j.1365-2427.2008.02092.x (doi:10.1111/j.1365-2427.2008.02092.x) [DOI] [Google Scholar]
- 31.Batista JD. 2010. Sazonalidade, impacto ambiental e o padrão de deiversidade beta de Odonata em riachos tropicais no Brasil Central. Viçosa, Minas Gerais, Brazil: Federal University of Viçosa [Google Scholar]
- 32.Cumming GS. 2004. The impact of low-head dams on fish species richness in Wisconsin, USA. Ecol. Appl. 14, 1495–1506 10.1890/03-5306 (doi:10.1890/03-5306) [DOI] [Google Scholar]
- 33.Lehner B, et al. 2011. High-resolution mapping of the world's reservoirs and dams for sustainable river-flow management. Front. Ecol. Environ. 9, 494–502 10.1890/100125 (doi:10.1890/100125) [DOI] [Google Scholar]
- 34.Walter RC, Merritts DJ. 2008. Natural streams and the legacy of water-powered mills. Science 319, 299–304 10.1126/science.1151716 (doi:10.1126/science.1151716) [DOI] [PubMed] [Google Scholar]
- 35.Rocha W, et al. Submitted Ecosystem productivity and carbon cycling in intact and annually burnt forest at the dry southern limit of the Amazon rainforest (Mato Grosso, Brazil). [Google Scholar]
- 36.Hijmans RJ, Cameron SE, Parra JL, Jones PG, Jarvis A. 2005. Very high resolution interpolated climate surfaces for global land areas. Int. J. Climatol. 25, 1965–1978 10.1002/joc.1276 (doi:10.1002/joc.1276) [DOI] [Google Scholar]
- 37.Sano EE, Rosa R, Brito JLSB, Ferreira LG. 2007. Mapeamento de cobertura vegetal do bioma Cerrado: estratégias e resultados. Planaltina, DF, Brazil: EMBRAPA (Brazilian Agricultural Research Corporation) - Cerrado division [Google Scholar]
- 38.Ferreira N, Ferreira L, Huete A, Ferreira M. 2007. An operational deforestation mapping system using MODIS data and spatial context analysis. Int. J. Remote Sens. 28, 47–62 10.1080/01431160600835861 (doi:10.1080/01431160600835861) [DOI] [Google Scholar]
- 39.National Hydrographic Division - Ottobacias 2010. See http://www.ana.gov.br/bibliotecavirtual/solicitacaoBaseDados.asp Brazilian National Water Agency (Accessed on 15 June 2010).
- 40.Breiman L. 2001. Random forests. Mach. Learn. 45, 5–32 10.1023/A:1010933404324 (doi:10.1023/A:1010933404324) [DOI] [Google Scholar]
- 41.Stickler CM. 2009. Defending public interests in private forests: land use policy alternatives for the Xingu River headwaters region of southeastern Amazônia. Gainesville, FL: University of Florida [Google Scholar]
- 42.Schielzeth H. 2010. Simple means to improve the interpretability of regression coefficients. Methods Ecol. Evol. 1, 103–113 10.1111/j.2041-210X.2010.00012.x (doi:10.1111/j.2041-210X.2010.00012.x) [DOI] [Google Scholar]
- 43.Gelman A, Hill J. 2007. Data analysis using regression and multilevel/hierarchical models. Cambridge, UK: Cambridge University Press [Google Scholar]
- 44.Fan Y, van den Dool H. 2008. A global monthly land surface air temperature analysis for 1948–present. J. Geophys. Res. 113, D01103. 10.1029/2007jd008470 (doi:10.1029/2007jd008470) [DOI] [Google Scholar]
- 45.Huffman GJ, et al. 2007. The TRMM multi-satellite precipitation analysis: quasi-global, multi-year, combined-sensor precipitation estimates at fine scale. J. Hydrometeor. 8, 38–55 10.1175/JHM560.1 (doi:10.1175/JHM560.1) [DOI] [Google Scholar]
- 46.Bruinsma J. 2009. The resource outlook to 2050. By how much do land, water use and crop yields need to increase by 2050? Expert Meeting on How to Feed the World in 2050; June 24. Rome, Italy: Food and Agriculture Organization of the United Nations Economic and Social Development Department [Google Scholar]
- 47.DeFries R, Rosenzweig C. 2010. Toward a whole-landscape approach for sustainable land use in the tropics. Proc. Natl Acad. Sci. USA 107, 19627–19632 10.1073/pnas.1011163107 (doi:10.1073/pnas.1011163107) [DOI] [PMC free article] [PubMed] [Google Scholar]
- 48.Foley JA, et al. 2011. Solutions for a cultivated planet. Nature 478, 337–342 10.1038/nature10452 (10.1038/nature10452) [DOI] [PubMed] [Google Scholar]
- 49.Azevedo AA. 2009. Legitimating unsustainability? Analysis of the environmental licensing system for rural properties - SLAPR (Mato Grosso). Brasília, Brazil: University of Brasília [Google Scholar]