

Abstract
Fertilizer-intensive soya bean agriculture has recently expanded in southeastern Amazonia, and whereas intensive fertilizer use in the temperate zone has led to widespread eutrophication of freshwater ecosystems, the effects in tropical systems are less well understood. We examined the fate of fertilizer phosphorus (P) by comparing P forms and budgets across a chronosequence of soya bean fields (converted to soya beans between 2003 and 2008) and forests on an 800 km2 soya bean farm in Mato Grosso, Brazil. Soya bean fields were fertilized with 50 kg P ha−1 yr−1 (30 kg P ha−1 yr−1 above what is removed in crops). We used modified Hedley fractionation to quantify soil P pools and found increases in less-plant-available inorganic pools and decreases in organic pools in agricultural soils compared with forest. Fertilizer P did not move below 20 cm. Measurements of P sorption capacity suggest that while fertilizer inputs quench close to half of the sorption capacity of fast-reacting pools, most added P is bound in more slowly reacting pools. Our data suggest that this agricultural system currently has a low risk of P losses to waterways and that long time-scales are required to reach critical soil thresholds that would allow continued high yields with reduced fertilizer inputs.
Keywords: phosphorus fertilizer, phosphorus sorption, Amazon, soya bean agriculture
1. Introduction
Understanding the fate of phosphorus (P) fertilizer has long been a priority for soil science [1–3]. While increasing fertilizer inputs of P, an essential plant nutrient, has helped facilitate a doubling of crop production in the past 50 years [4], this same increase has contributed to P run-off, driving eutrophication and decreased water quality from local to regional scales [5,6]. In addition, P is irreplaceable, reserves are finite and the vast majority of phosphate rock is mined from only a handful of countries [2,7,8]. The predictability of supply and price of P fertilizer may have economic ramifications for farmers, particularly in agricultural systems that require large P inputs [7–9].
Phosphorus fertilizer efficiencies were once seen as very low: if measured directly (traced with isotopes, for example), generally less than 25 per cent of added P fertilizer is taken up by the crop, whereas the rest of crop P demand is taken from soil reserves [3]. While some fertilizer P remains readily available to plants in soil solution, much is bound into less-plant-available pools [3]. This requires that more P fertilizer be added than is removed by crops, often for many years [10]. With time in cultivation, however, this accumulating P in soil feeds back to crops, increasing P fertilizer efficiency in the longer term [1,3,11]. None of the reactions that sorb P into soil pools of varying plant availability are irreversible [1,3]. Readily available pools exchange P with the least-plant-available pools, though the rates of exchange and amounts of available P vary with soil properties, land use and P additions. In many soils, a threshold of soil solution P is eventually reached [12], where the accumulated P surplus is large enough that only enough P fertilizer to replace that removed by crops is required to maintain yields, though this threshold will vary by crop, soil type and farming practices [3,13].
Accumulated P in less-plant-available pools has allowed many regions, including the Midwestern USA, to greatly reduce their P inputs, in some cases such that croplands now have net negative P balances annually [14]. A recent global model suggested that P inputs required to support global agriculture in 2050 may be 10–40 per cent lower than previously estimated when residual soil P pools are taken into account [11].
However, increasing labile P above another threshold, or ‘critical point’, often lower than the maximum sorption capacity of soil, has contributed to increased P losses from farm fields and associated eutrophication of surface waters [15–18]. Most examination of regional eutrophication, and much of the research on the dynamics of P pools in agricultural soils, has focused on the temperate zone [1,15,17,18]. But input-intensive agriculture is now expanding most rapidly in tropical regions [19,20], where the fate of fertilizer P both on and off the farm is less well understood.
The Amazon is one of the world's most active agricultural frontiers [21]. Recently, intensive soya bean agriculture has been rapidly expanding along the southern and eastern edge of the Amazon Basin, most notably in the state of Mato Grosso, Brazil, where 87 per cent of Amazonian cropland expansion took place between 2001 and 2004 [21]. These new input-intensive cropping systems have different constraints from their temperate equivalents: notably, many are situated on highly weathered, acid, P-poor soils the likes of which are absent from temperate agricultural regions in the Midwestern USA and Europe. While not all tropical soils are constrained by high P sorption [22,23], the capacity to bind P in the least-plant-available soil pools is often a constraint of Oxisols, the most highly weathered soil order [24–26]. Oxisols are found almost exclusively in the tropics, covering approximately 20 per cent of tropical land area, with the largest distribution in South America and Africa [22,27]. In Mato Grosso, approximately 45 per cent of terrestrial area overlays Oxisols [27,28], and approximately 30 per cent of the state's current cropland is on high P-binding soil [28,29].
To quantify the fate of fertilizer P in Amazonian soya bean agriculture, we examined the forms and availability of soil P across a chronosequence of soya bean fields (converted to soya bean between 2003 and 2008) and adjacent tropical forests on an 800 km2 soya bean farm in Mato Grosso, Brazil. We asked: (i) What is the P balance for an intensively managed soya bean farm? (ii) If P is accumulating in soils, in which soil pools is it accumulating? (iii) What is the P-sorption capacity of these soils, and does this reveal a critical point of P levels beyond which additional P surpluses are no longer required?
We hypothesized that P inputs in excess of removal in crops would lead to the accumulation of P in soil. Given the inputs of P fertilizers to soya bean fields, we anticipated that P sorption capacity would be lower in soya bean fields than in forest soils [30–33] because some of that capacity would have been saturated by previous fertilizer inputs. As a result of this P accumulation, we expected soya bean fields to have higher concentrations of P [3]. We additionally hypothesized that the high P-binding capacity of soils would keep P surpluses in the upper soil, and that P transport deeper in the soil column would be relatively small [34]. Based on our previous measurement of low dissolved P losses from soya bean streams [35] and minimal occurrence of overland flow [36,37], we hypothesized that losses to streams would be low.
2. Methods
(a). Site description
Tanguro Ranch is an 800 km2 farm in Mato Grosso, Brazil, of which 300 km2 were in active soya bean cultivation during the growing season from December 2008 to April 2009 (figure 1). Mean annual temperature is 27°C, and mean annual precipitation between 1987 and 2010 was 1800 mm yr−1 (see the electronic supplementary material, table S1 for details). There is a pronounced dry season between May and September during which less than 2 per cent of annual precipitation falls.
Figure 1.

A map of soil cores in forest and in a chronosequence of soya bean fields on Tanguro Ranch in Mato Grosso, Brazil. The location of Tanguro Ranch within the Legal Amazon (the nine Brazilian states that contribute land area to the Amazon Basin) is also shown.
The farm is located on the Brazilian Shield, with Tertiary and Quaternary fluvial deposits over Precambrian gneisses of the Xingu Complex [38]. There is little topographic variation. The landscape consists of plateaus 360–390 m above sea level grading to streams 320–350 m above sea level [36]. The soils along geographical plateaus are medium-textured, well-drained ustic Oxisols (Latossolo vermelho-amarelo distrófico). Resistivity data and elevation differences suggest the depth of the water table is between 20 and 40 m [36].
The farm fields were originally cleared for pasture in 1982 and 1983 and were converted to soya bean cultivation between 2003 and 2008. Conversion followed the same sequence in all fields: burning of the pasture, tilling to 30–40 cm to incorporate ash and fertilizer for the first 2–3 years of cultivation, followed by no till (see the electronic supplementary material for details). We used this conversion chronosequence as a space-for-time substitution to look at P transformations over time in soils under cultivation. All soil was similarly classified, and there were no significant differences in soil texture among the differently aged fields (table 1). However, soils in the field converted in 2007 had the highest sand content of all sampled soils. We collected seven soil cores from forest and each of four differently aged fields: soya bean planted in 2003, 2004, 2007, 2008 (figure 1). We separated each core into five depths: 0–10, 10–20, 40–50, 90–100 and 190–200 cm. We divided each land use into numbered parcels, and took cores from a randomly generated list of parcels in each treatment. At each core location, we dug a 0.5 m pit and sampled for soil bulk density with a ring of measured volume hammered into the pit wall at three depths: 0–10, 10–20 and 40–50 cm. For every conversion year except 2004, all cores for each differently aged soil in the chronosequence came from a single field (figure 1). However, these fields are very large, and cores from a single field were as much as 10 km apart, so we feel it is appropriate to treat these cores as true replicates for a given year of conversion.
Table 1.
Physical and chemical attributes of soils (0–20 cm depth-weighted average with 1 s.e. in parentheses) at Tanguro Ranch in Mato Grosso, Brazil. Samples are from forest and fields converted to soya bean in 2003, 2004, 2007 and 2008. Significant differences among land uses are represented by letters: columns with no letters have no significant differences; in columns with letters, land uses that have letters in common are not significantly different (p < 0.05). Bulk density in g cm−3, sand, silt and clay in per cent, Mehlich P in mg P kg−1, K+, Ca2+, Mg2+, Al3+ in mmolc kg−1, Al and base saturation (sat) in per cent, and ECEC in cmolc kg−1.
| land use | bulk density | sand | clay | pH (KCl) | pH (H2O) | Mehlich P | K+ | Ca2+ | Mg2+ | Al3+ | Al sat | base sat | ECEC |
|---|---|---|---|---|---|---|---|---|---|---|---|---|---|
| forest (n = 7) | 1.09 (0.04) A | 59.3 (3.9) | 38.2 (3.9) | 3.9 (0.15) A | 4.54 (0.20) A | 5.86 (1.0) | 0.540 (0.06) | 6.86 (5.5) A | 2.93 (1.9) A | 14.1 (2.4) A | 72.7 (12) A | 11.1 (6.9) A | 2.44 (0.54) |
| soya bean 2008 (n = 7) | 1.43 (0.02) B | 55.9 (3.4) | 42.4 (3.3) | 4.53 (0.14) B | 5.43 (0.15) B | 54.1 (23) | 1.17 (0.36) | 16.1 (4.3) AB | 5.86 (1.4) AB | 3.21 (0.76) B | 20.1 (6.5) B | 35.4 (6.6) AB | 2.64 (0.50) |
| soya bean 2007 (n = 7) | 1.47 (0.05) B | 67.9 (5.5) | 30.1 (5.5) | 5.27 (0.17) C | 6.03 (0.20) B | 10.1 (3.9) | 1.14 (0.21) | 14.4 (2.5) AB | 11.1 (2.3) B | 1.07 (0.71) B | 9.00 (5.9) B | 55.2 (7.4) B | 2.78 (0.43) |
| soya bean 2004 (n = 7) | 1.34 (0.03) B | 55.9 (4.5) | 42.4 (4.5) | 5.02 (0.09) BC | 6.02 (0.11) B | 22.6 (11) | 1.43 (0.36) | 18.6 (2.0) AB | 11.9 (1.6) B | 0.640 (0.36) B | 3.79 (1.6) B | 49.5 (3.4) B | 3.25 (0.34) |
| soya bean 2003 (n = 7) | 1.36 (0.03) B | 54.1 (4.5) | 43.6 (4.3) | 5.14 (0.11) C | 5.94 (0.13) B | 17.6 (5.5) | 0.860 (0.12) | 23.5 (2.9) B | 12.9 (1.5) B | 0.790 (0.51) B | 4.86 (3.6) B | 59.2 (4.5) B | 3.81 (0.40) |
We additionally sampled six 5 m pits, three in areas under soya bean cultivation (converted to soya bean in 2004) and three in forest. The pits were originally opened in August 2007, and we sampled them in January and February 2009. The surface of the soil was removed before taking either samples or bulk density measurements. However, because these pits had been open for sometime, we did not include soils from these pits in our analysis of surface soil P dynamics. The P sorption and P fraction analyses were limited to the data from the soil cores. Rather, we took advantage of these deep cores to look at general soil properties, particularly bulk density, at depths that we were unable to reach with our coring and shallow pit methods. We collected soil from eight depths in the pits: the five depths listed above as well as 290–300, 390–400 cm, and the deepest available sample (between 400 and 500 cm). Bulk density samples were also collected at each pit at each depth using the same method as described earlier. The mean bulk density below 50 cm from the 5 m pits in soya bean or forest was used to extrapolate bulk density to the other sampled cores below 50 cm in the respective land use (soya bean or forest). Samples were air-dried and stored prior to analysis.
(b). Laboratory analysis
A subsample of each soil sample was analysed for soil texture, pH (H2O and KCl), extractable phosphorus and potassium (Mehlich I), calcium, magnesium and aluminium (1 M KCl), and aluminium and hydrogen (1 M calcium acetate) at the University of São Paulo. Another subsample of soil was sent to ALS Chemex (Reno Minerals Laboratory, Reno, NV, USA) for total phosphorus major element analysis by lithium borate flux fusion digestion and X-ray fluorescence.
We used modified Hedley fractionation to characterize different operationally defined pools of P within these soils [39]. This method extracts P from soils using progressively stronger reagents to look at the distribution of P among variably labile pools of P. We measured bicarbonate (0.5 M NaHCO3) extractable inorganic (Pi) and organic (Po) P, sodium hydroxide (0.1 M NaOH) extractable Pi and Po, and hydrochloric acid (1 M HCl) extractable Pi. For each sample and fraction, we added 30 ml extractant to 0.5 g air-dried soil. We shook the samples for 16 h, centrifuged samples for 20 min at 3500 r.p.m., and left the samples for 24 h. After 24 h, we centrifuged the samples again. Following the second centrifugation, we analysed a subsample of the extractant for Pi by measuring PO43− concentrations colorimetrically with a Westco (Brookfield, CT, USA) automatic analyzer. For Po determination, we digested a second subsample of the extractant (5 ml) with potassium persulfate (0.5 g for NaHCO3 fraction, 0.6 g for NaOH fraction) and 0.9 M H2SO4 in an autoclave for 45 min at 120°C. Following this digestion, we measured total P (Pt) in the extractant colorimetrically. We determined Po by difference (Pt – Pi = Po). We calculated residual P as the difference between total P (as determined by lithium borate flux fusion) and the sum of the aforementioned P fractions.
We used P sorption isotherms, in which soils are shaken with solutions of varying P concentrations to measure the soil's capacity to adsorb added P [40,41]. We added 12.5 ml of 0.01 M CaCl2 with varying concentrations of P (0.5, 1, 3, 5 or 7 ppm P as KH2PO4) to 0.5 g of each of our soil samples. Samples were shaken for 24 h in cold storage (less than or equal to 4°C) to reduce microbial activity [42]. We centrifuged samples for 20 min at 3500 r.p.m. and measured the concentration of PO4 in solution colorimetrically with a Westco automatic analyzer the same day.
(c). Phosphorus budget estimate
We measured the P budget in two ways. First, we used input and output data from a variety of sources to estimate annual P accumulation (figure 2). Second, we used differences in total P in surface samples along the chronosequence to estimate P accumulation. Tanguro Ranch management provided data on P fertilizer inputs and crop yields for three years of production (2006–2007, 2008–2009 and 2010–2011 growing seasons (Tanguro Ranch 2012, unpublished data); for fertilizer application rates, see electronic supplementary material). These data included inputs and yields by parcel (between 6 and 256 ha parcel−1) for the soya bean fields in production. We assumed 0.55 per cent P content in harvested soya bean (assumes approx. 14% moisture) in combination with yield data to calculate P exported in soya bean [43].
Figure 2.

Schematic of the phosphorus (P) budget for soya bean fields on Tanguro Ranch in Mato Grosso, Brazil.
Watershed P losses included estimates of dissolved and particulate P export from streams. We used stream export data from a year of stream sampling for dissolved P flux [35] and particulate P flux (see the electronic supplementary material). Atmospheric inputs were estimated from a regional analysis of P deposition rates [44]. To calculate atmospheric losses, we used a dust model based on evidence of dust flux elsewhere in Mato Grosso [44] as well as on local conditions (see the electronic supplementary material for methods detail). Not surprisingly, inputs in fertilizer and outputs in harvest dwarfed all other fluxes (figure 2).
We compared this input–output-based budget with measured differences in total P in surface soils as an independent check of accumulating soil P surpluses. We did not include the youngest soya bean fields (S08) because of the increase in total P following biomass burning and ash incorporation along with fertilization and tilling in this field. To look at annual P accumulation using these data we used least-squares linear regression regressing years in cultivation on soil P stocks in the top 10 cm of soil. While the conversion of soya probably incorporates the first pulse of P to a greater depth with tilling, subsequent P additions are broadcast only on the surface. In this way, annual accumulation may be underestimated for the first years following conversion (S08 and S07), but will probably overall be a more accurate estimate of annual P surpluses.
(d). Data analysis
(i). Soil characteristics and phosphorous fraction data
We analysed comparisons between soya bean and forest soil characteristics and P fractions using ANOVA and Tukey's honestly significant difference (JMP v. 9.0.2). For P fractions, we compared P concentration in each fraction (mg P kg soil−1) among fields of different ages as well as by the percentage of total P represented by each fraction among fields of different ages. We compared all field ages against each other (forest, S03, S04, S07 and S08) as well as among age classes (forest, old soya bean (S03, S04) and new soya bean (S07, S08)). We compared fractions by depth for all sample depths as well as for the depth-weighted average of surface soils (0–10 and 10–20 cm samples combined for each core).
(ii). Phosphorous sorption isotherms
For the seven cores from each land use, we fit the P sorption data to the Langmuir equation with the form:
| 2.1 |
where S is the amount of P sorbed by soil (mg P kg soil−1), Smax is the maximum sorption capacity of soil (mg P kg soil−1), C is the concentration of P added to solution (mg l−1) and kL is a constant associated with bonding energy [45]. We fit the equation to the data from all cores for each land use but separated by depth in order to compare among land uses and among depths within each land use. The r2 of the fit of the Langmuir equation to the data for each land use was greater than or equal to 0.94 (table 2). We used linear regression to compare clay content and kL (JMP v. 9.0.2). We used kL rather than Smax as kL values are better predicted by our data than Smax.
Table 2.
Phosphorus (P) sorption isotherm variables (Smax, KL and r2) based on the Langmuir equation calculated for each land use (forest and soya bean fields converted to soya bean in 2003, 2004, 2007 and 2008). Soil samples were taken in January and February 2009 at Tanguro Ranch in Mato Grosso, Brazil. Langmuir equations for each land use were based on the data from seven soil cores.
| land use | depth | KL | Smax | r2 |
|---|---|---|---|---|
| forest | 10 | 0.0281 | 834 | 0.9422 |
| 20 | 0.0198 | 1270 | 0.9995 | |
| 50 | 0.0107 | 2320 | 0.9997 | |
| soya bean 2003 | 10 | 0.0347 | 728 | 0.9964 |
| 20 | 0.0186 | 1340 | 1.0000 | |
| 50 | 0.00485 | 5120 | 0.9997 | |
| soya bean 2004 | 10 | 0.0272 | 901 | 0.9988 |
| 20 | 0.0277 | 904 | 0.9983 | |
| 50 | 0.00784 | 3190 | 0.9995 | |
| soya bean 2007 | 10 | 0.106 | 239 | 0.9971 |
| 20 | 0.0975 | 262 | 0.9989 | |
| 50 | 0.0345 | 737 | 0.9998 | |
| soya bean 2008 | 10 | 0.0342 | 709 | 0.9861 |
| 20 | 0.00866 | 2870 | 0.9893 | |
| 50 | 0.00114 | 21 800 | 0.9991 | |
| mean | 0.026 | 2640 |
3. Results
(a). Soil characteristics by land use and depth
Forest soils had 59 per cent (s.e. = 3.9) sand, 39 per cent (s.e. = 3.9) clay and 2.1 per cent (s.e. = 0.15) silt (table 1). Forest soils exhibited several of the constraints that can make agriculture on tropical soils difficult: low pH, more than 60 per cent Al saturation and less than 4 cmolc kg−1 effective cation exchange capacity (ECEC) (table 1 and [22]).
The pH, Ca2+, Mg2+, Al3+, Al3+ saturation and base saturation all varied significantly with land use in the top 20 cm (table 1, p < 0.05). Calcium, Mg2+, base saturation and pH all increased following conversion to soya bean (and treatment with lime), whereas Al3+ and Al3+ saturation decreased (table 1). The difference between pH in KCl and pH in H2O was negative across land uses and across depths (tables 1 and 3), suggesting the soil in all land uses had a net negative charge [46].
Table 3.
Physical and chemical attributes of soils by depth between 10 and 200 cm at Tanguro Ranch in Mato Grosso, Brazil. Samples are from forest and fields converted to soya bean in 2003, 2004 (old soya bean), 2007 and 2008 (new soya bean). Data are means with 1 s.e. in parentheses. Soil samples were collected in January and February 2009. Mehlich P in mg P kg soil−1, K+, Ca2+, Mg2+, and Al3+ in mmolc kg soil−1, Al and base saturation (sat) in per cent.
| depth | land use | n | pH (KCl) | pH (H2O) | Mehlich P | K+ | Ca2+ | Mg2+ | Al3+ | Al sat | base sat |
|---|---|---|---|---|---|---|---|---|---|---|---|
| 10 | forest | 7 | 3.84 (0.21) | 4.53 (0.22) | 8.43 (1.7) | 0.76 (.11) | 9.71 (8.4) | 3.86 (2.9) | 16.9 (3.0) | 74.0 (12) | 12.6 (8.9) |
| new soya bean | 13 | 5.13 (0.19) | 5.98 (0.16) | 60.4 (28) | 1.77 (0.32) | 22.1 (4.0) | 10.9 (1.7) | 1.23 (0.51) | 6.31 (3.1) | 59.3 (6.6) | |
| old soya bean | 14 | 5.31 (0.07) | 6.15 (0.07) | 27 (11) | 1.29 (0.32) | 26.7 (2.3) | 16.2 (1.5) | 0.07 (0.07) | 0.21 (0.21) | 63.5 (2.8) | |
| 20 | forest | 7 | 3.96 (0.09) | 4.54 (0.20) | 3.29 (0.68) | 0.31 (0.04) | 4.00 (2.7) | 2.00 (1.0) | 11.3 (1.9) | 71.4 (11) | 9.57 (4.8) |
| new soya bean | 14 | 4.73 (0.16) | 5.54 (0.18) | 7.36 (1.8) | 0.65 (0.13) | 9.36 (1.8) | 6.57 (1.6) | 2.86 (0.84) | 21.7 (7.5) | 33.9 (5.6) | |
| old soya bean | 14 | 4.86 (0.13) | 5.81 (0.11) | 13.1 (4.8) | 0.99 (0.14) | 15.4 (2.0) | 8.57 (1.1) | 1.36 (0.48) | 8.43 (3.6) | 45.2 (4.3) | |
| 50 | forest | 8 | 4.10 (0.10) | 4.78 (0.17) | 2.12 (0.35) | 0.11 (0.01) | 3.00 (1.5) | 1.38 (0.37) | 7.38 (1.0) | 66.8 (9.3) | 13.8 (5.8) |
| new soya bean | 13 | 4.22 (0.05) | 4.72 (0.09) | 2.15 (0.37) | 0.20 (0.04) | 1.31 (0.17) | 1.15 (0.10) | 4.85 (0.90) | 59.8 (4.5) | 9.69 (0.89) | |
| old soya bean | 14 | 4.39 (0.10) | 5.24 (0.13) | 1.86 (0.31) | 0.29 (0.03) | 3.71 (0.95) | 2.00 (0.36) | 3.57 (0.57) | 39.1 (6.6) | 17.9 (3.4) | |
| 100 | forest | 2 | 4.20 (0.0) | 4.80 (0.10) | 1.00 (0.0) | 0.10 (0.0) | 3.00 (1.0) | 1.00 (0.0) | 4.00 (0.0) | 50.0 (6.0) | 17.5 (5.5) |
| new soya bean | 3 | 4.87 (0.27) | 4.43 (0.03) | 1.67 (0.33) | 0.100 (0.0) | 1.67 (0.67) | 1.00 (0.0) | 4.00 (2.0) | 53.7 (13.5) | 16.0 (3.8) | |
| old soya bean | 6 | 5.03 (0.09) | 5.42 (0.13) | 1.50 (0.22) | 0.13 (0.02) | 3.50 (1.6) | 1.33 (0.21) | 0.17 (0.17) | 1.67 (1.67) | 20.7 (5.8) | |
| 200 | forest | 2 | 4.50 (0.10) | 4.80 (0.20) | 1.50 (0.50) | 0.10 (0.0) | 3.50 (1.5) | 1.00 (0.0) | 1.50 (0.50) | 26.5 (12.5) | 16.5 (9.5) |
| new soya bean | 4 | 4.58 (0.14) | 4.90 (0.18) | 1.75 (0.25) | 0.12 (0.02) | 1.50 (0.50) | 1.00 (0.0) | 1.50 (0.87) | 29.3 (14) | 15.5 (4.1) | |
| old soya bean | 6 | 5.33 (0.13) | 5.57 (0.15) | 1.33 (0.21) | 0.10 (0.0) | 3.67 (1.5) | 1.17 (0.17) | 0.17 (0.17) | 1.67 (1.67) | 25.2 (5.0) |
Below 20 cm, farming practices appeared to affect some soil characteristics with time in cultivation, though owing to small and variable sample sizes these data were not analysed statistically. Calcium, Mg2+ and base saturation did not vary among land uses (table 3). However, up to 200 cm depth pH was elevated and Al3+ content and saturation were lower in old soya bean fields (S03 and S04) compared with forest or young soya bean fields (S07 and S08) (table 3).
(b). Annual phosphorus balances
Based on input and output data, we estimated that approximately 50 kg P ha−1 yr−1 were added to farm fields, whereas between 18 and 20 kg P ha−1 yr−1 were removed, leaving an annual soil surplus of between 28 and 30 kg P ha−1 yr−1 (figure 2). Almost all of the inputs and outputs were derived from fertilizer inputs and harvest losses. Based on the linear regression looking at total P stocks in the top 10 cm over time, total P accumulation, as estimated by the slope of the line of best fit, was 28.2 (±7.7, 1 s.e.) kg P ha−1 yr−1 (r2 = 0.34, p = 0.001). This range is larger than that estimated using P flux measurements, but encompasses the previous estimate.
(c). Phosphorous fractions
The almost 30 kg P ha−1 yr−1 surplus did little to change P fractions from year to year. After 6 years in soya bean production, however, total P in the top 10 cm of soil was higher in comparison with forest as were concentrations of NaHCO3 Po (0–10 cm), NaOH Pi (0–10 and 10–20 cm) and residual P (10–20 cm) (figure 3). No significant differences between forest and soya bean existed below 20 cm with one exception (NaHCO3 Pt in the youngest soya bean field, S08 > forest at 190–200 cm, p < 0.05).
Figure 3.

Phosphorus (P) fraction data as (a) a percent of total P and (b) the concentration of P in each fraction. Land uses from which soils were sampled are forest, new soya bean fields (converted to soya bean in 2007 and 2008), and old soya bean fields (converted in 2003 and 2004). Data are depth-weighted averages of samples from 0 to 20 cm. Soil samples were taken in January and February 2009 at Tanguro Ranch in Mato Grosso, Brazil. Where significant differences exist within fractions among land uses they are represented by letters: where land uses share a letter there is no significant difference (p < 0.05). HCl Pi fractions are difficult to see because there is so little across all land uses.
Comparing P fraction data across age classes (forest, old soya bean [S03, S04], and new soya bean [S07, S08]) rather than treating each field of different age individually showed a higher contribution of organic P in forest soils and increases in the NaOH Pi fraction in soya bean fields (figure 3). Differences in other fractions among age classes were not significant but the concentrations of P in all fractions were highest in the old soya bean fields compared with young soya bean fields or forest (figure 3). Differences among all land uses in the top 20 cm of soil were significant only between the youngest, and most recently burned, soya bean field (S08) and forest. S08 soils had higher concentrations of NaOH Pi (89.6 mg P kg soil−1) compared with forest soils (16.9 mg P kg soil−1; p = 0.03), NaOH Pi was a larger percentage of total P in S08 (47%) than forest (11%, p = 0.01) and NaOH Po was a larger percentage of total P in forest (27%) than S08 (9.0%; p = 0.005).
(d). Phosphorus sorption isotherms
Neither kL, a measure of the speed of sorption, or Smax, the maximum sorption capacity of soils, showed a trend with time since conversion or varied significantly with depth (table 2), suggesting farming practices did not affect phosphorus sorption capacity according to this metric. Soils in S07, however, had significantly higher kL values than any other land use (p < 0.04; table 2). While not a significant trend, Smax increased and kL decreased with depth for every land use (table 2). There was a strong relationship between soil clay content and kL (r2 = 0.76, p < 0.0001), which may explain the difference between soil in the soya bean field converted in 2007 and all other land uses. Soils from S07 had the lowest clay content (table 1) and the lowest Smax values (table 2) among the land uses.
4. Discussion
According to both estimated P fluxes and observed increases in total P, soya bean fields are accumulating P (figures 2 and 3b). Estimated annual P accumulation based on input and output fluxes suggests this accumulation to be approximately 30 kg P ha−1 yr−1. A recent analysis of global agricultural P budgets shows the top quartile of P surpluses to be those more than 13 kg P ha−1 yr−1 [45], suggesting that both the flux estimates and input–output-based rates of accumulation for Tanguro Ranch rank among the highest annual P accumulations for world croplands. Fertilizer inputs and harvested P outputs were at least two, and in most cases three, orders of magnitude higher than any other estimated P flux (figure 2). There was no evidence that soil P is accumulating below 20 cm, or in other words, below the plough layer (figure 3). This suggests that surface soils were not saturated with P, making P leaching unlikely.
Conversion to soya bean (and the associated intensive management) changed many of the chemical properties of soils in the top 50 cm, in most cases with direct benefit to crops and potentially indirect effects on P dynamics (tables 1 and 3). At the surface, increases in pH, extractable base cation concentrations (Ca2+ and Mg2+), and base saturation can decrease aluminium toxicity challenges for crops and may also decrease P sorption capacity [3,22]. Increased pH and decreased extractable Al3+ concentrations and Al3+ saturation at depth (table 3) suggest that P sorption capacity may decrease throughout the soil column as cultivation continues, which might facilitate crop roots accessing even more stores of soil P. However, we did not see a decrease in P sorption capacity with time in cultivation or with depth (table 2 and figure 5).
Figure 5.
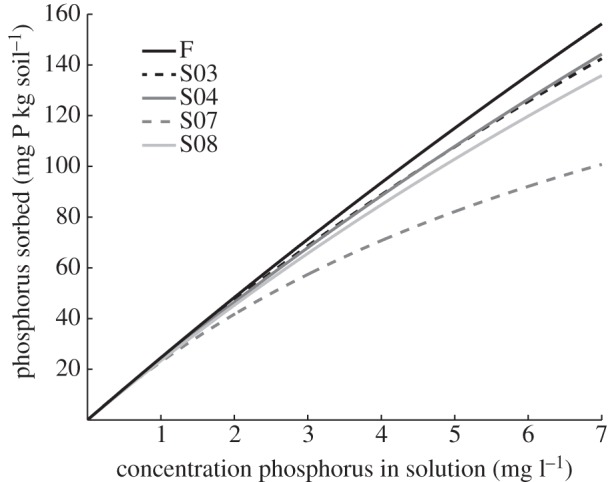
Phosphorus (P) sorption isotherms for each land use at 10 cm depth. Land uses are forest and soya bean fields converted to soya bean in 2003 (S03), 2004 (S04), 2007 (S07) and 2008 (S08). Lines represent the Langmuir equation fit to seven samples from each land use. Soil samples taken at Tanguro Ranch in Mato Grosso, Brazil in January and February 2009.
Phosphorus fractions across land uses were similar to those observed elsewhere for cultivated and uncultivated Oxisols. Across all land uses the most-plant-available P (NaHCO3 Pt) accounted for less than 10 per cent of total P and the majority of P was in the NaOH (relatively plant-available) and residual fractions [39,47–51]. The general increase in P concentrations in all fractions with increasing time in cultivation supports the concept of reversible exchange among soil P pools [1,3]. The NaOH Pi pool, which is thought of as relatively available especially in highly weathered soils, was shown here as elsewhere as a sink for fertilizer P, whereas organic P pools were larger in the forest than in cropped fields as in other unfertilized systems [49,51,52].
The P sorption capacity of soils was high and did not change with time under cultivation (table 2). Collected literature data by Riskin et al. [28] found a global mean Smax of 1020 mg P kg soil−1 (±240, 1 s.e.) among Oxisols. The Oxisols of Tanguro fall on the high end of observed sorption capacity (2600 mg P kg soil−1; table 2). The Smax values reported here are extrapolated past the measured data range, suggesting that a more accurate assessment of sorption capacity would be possible with increased concentrations of added P. However, the consistently high sorption capacities observed suggest that it may be difficult to saturate the P-sorption capacity of these soils and bring soil P to the ‘critical point’ where only replacement fertilizer inputs are necessary.
P sorption values as measured by standard methods address only one type of P sorption: the fast reactions between P and surficial binding sites in soil—in other words, the most easily reversible sorption and the more labile and plant-available P [53,54]. The slower reactions of P into more recalcitrant forms are not captured by this metric [53,54]. As evidenced by the P fraction data, annual soil P surpluses did not remain exclusively in the fast P-binding pools captured by the sorption isotherms. Using the mean rate of P fertilizer inputs from the farm, mean bulk density of soya bean fields, and assuming distribution of all fertilizer within only the top 10 cm of soil, P sorption isotherms indicate that fertilizer inputs saturate between 35 and 87 per cent of the maximum sorption capacity of soils each year. However, pools of the most-plant-available P did not increase with increasing years of fertilizer inputs. Following six years of cultivation, all significant differences in P fractions among land uses were found in the first 20 cm of soil (within the plough layer), and total P only varied at 10 cm depth (figure 4), further suggesting that fertilizer P is not saturating surface soil sorption capacity or reaching deeper soils (figures 4 and 5). Changes in the 10–20 cm depth are likely a consequence of disking during the first several years of cultivation (see supplementary material) rather than movement of fertilizer applied to the soil surface reaching 20 cm depth.
Figure 4.

Phosphorus (P) fraction data from (a) forest and (b) the oldest sampled soya bean field, converted to soya bean cultivation in 2003. Soil samples taken at Tanguro Ranch in Mato Grosso, Brazil in January and February 2009. Significant differences between land uses represented by an asterisk (p < 0.05).
While we did not measure increases in soil solution P directly, low P losses to streams as well as the consistently low concentrations of labile P suggest that fertilizer P is not facilitating P leaching. In fact, with no movement of P below 20 cm and with more than 20 m of soil and almost exclusively vertical flow paths [36,37], it does not appear that soya bean cultivation is increasing the risk of P losses to surface waters.
While the ranges of annual P accumulation based on flux estimates and total P in soil data overlap, both methods have considerable uncertainty. Even our calculation using measured increases in soil P with time in cultivation required a number of assumptions. At Tanguro Ranch, forest was originally burned and converted to pasture, which was subsequently burned and converted to soya beans. Following the conversion to soya bean fields, soils were tilled for three years. While large debris, such as stumps or unburned branches, were removed by hand, any additional residual P in burned biomass was incorporated into approximately the top 30 cm of soil (the plough layer). It is likely that some of the increase in total P in the top 20 cm of soil is attributable not to P fertilizer inputs alone, but also to P in burned biomass. Back of the envelope calculations suggest this could have been an input as high as tens of kilograms P upon forest burning, and probably an order of magnitude lower upon pasture burning. Without better constraints on ash inputs, it is difficult to construct a tight budget for P based on a soil chronosequence approach.
We have more confidence in the P surpluses we calculated from farm records, because they rely almost exclusively on two measurements that have direct economic impact on the ranch and are thus tracked carefully—P fertilizer inputs and harvested soya beans. Here too, however, there is uncertainty. P exported in soya bean is estimated on soya bean P and water content, which we did not directly measure. Fertilizer inputs are based on concentrations that can vary among suppliers. Despite these uncertainties, our two independent methods of determining P surpluses coarsely agree that P accumulation rates are substantial enough to roughly double the total P in the top 10 cm in a decade.
As suggested earlier, the limited timescale of the chronosequence, and indeed, the short history of intensively managed soya bean in the Amazon probably affect the patterns in soil P dynamics. For example, the anomalous changes in total P and P fraction distribution in the youngest soya bean field (S08) may be a nutrient pulse associated with burning and ash incorporation into soils, which has been well documented in other tropical systems [52,55,56]. While ash fertilization has been observed to increase the most-plant-available P pools, here the less-plant-available inorganic P pool (NaOH Pi) increased [52,55]. Additionally, this ash fertilization effect can last beyond a single year, so there may be other sampled fields affected [52,55,56]. We do not think that the P dynamics measured here are an artefact of burning alone, but continuous monitoring of soil P will be useful to assess the consistency of the results obtained here.
As agriculture continues to expand and intensify in the coming decades, high inputs of P fertilizer will probably continue to be used to maintain high yields. While intensive soya bean agriculture at Tanguro Ranch and elsewhere in the Amazon is accumulating soil P more rapidly than many other agricultural systems [45], the consequences of these surpluses both on and off the farm will probably be different in other world regions. There may not be the same risks for leaching losses from highly weathered soils, and long periods of cultivation may be required to bring soil P levels up to reach critical thresholds for reducing fertilizer inputs. In a global analysis of P management, Steen [10] estimated that in P poor soils 30–50 per cent more P fertilizer than required by crops must be applied for 30–50 years to reach this point. While P sorption isotherms do not allow us to calculate such a timescale for the fields of Tanguro Ranch, our data showing no change in P sorption capacity following 6 years of cultivation suggest it will probably also be decades. A better understanding of the rate of exchange among soil P pools will also facilitate an understanding of how P-fertilizer efficiency in these high P-sorbing soils will change with time. The observed increase in all soil pools with increasing soil P, however, suggests that as elsewhere, soil P pools are interactive and reactions among them are reversible. The ability of residual soil P to subsidize future crop yields is a reason for optimism in our ever-expanding attempt to feed the planet [11,57]. Tightening the global P cycle will reduce costs to farmers, reduce the risk to aquatic ecosystems and reduce the demands on the finite global P supply.
This study represents a first look at the fate of P fertilizer in an intensifying agricultural system on a unique soil type. While these results are probably representative of one endpoint of soils with high P-sorption capacity, they are not unimportant. We currently farm almost 40 per cent of the terrestrial Earth surface and are running out of room to expand; what remains is mainly tundra, desert and tropical forest [20]. As we continue to expand and intensify agricultural extent in places such as the Amazon, the world's largest remaining tropical forest, understanding the nutrient requirements and the risk and consequences of nutrient losses will be important if we hope to optimize production and minimize environmental costs.
Acknowledgements
We gratefully acknowledge Cheryl Palm, Pedro Sanchez and Laura Schreeg for comments on this manuscript as well as Frank Bäse and the staff of IPAM for their help in the field, Grupo A. Maggi for providing access to field sites and farming data, and Barbara Hayhoe for logistical support. This project was supported by grants from NSF (DEB-0640661) and the Fundação de Amparo á Pesquisa do Estado de São Paulo (FAPESP 03/13172-2), the Watson Graduate Student Fellowship from MBL and the Craig M. Cogut Dissertation Fellowship from Center for Latin American and Caribbean Studies at Brown University.
References
- 1.Blake L, Johnston AE, Poulton PR, Goulding KWT. 2003. Changes in soil phosphorus fractions following positive and negative phosphorus balances for long periods. Plant Soil 254, 245–261 10.1023/A:1025544817872 (doi:10.1023/A:1025544817872) [DOI] [Google Scholar]
- 2.Smil V. 2000. Phosphorus in the environment: natural flows and human interferences. Annu. Rev. Energy Environ. 25, 53–88 10.1146/annurev.energy.25.1.53 (doi:10.1146/annurev.energy.25.1.53) [DOI] [Google Scholar]
- 3.Syers JK, Johnston AE, Curtin D. 2008. Efficiency of soil and fertilizer phosphorus use: reconciling changing concepts of soil phosphorus behaviour with agronomic information. Rome, Italy: Food and Agriculture Organization of the United Nations [Google Scholar]
- 4.Tilman D, Cassman KG, Matson PA, Naylor R, Polasky S. 2002. Agricultural sustainability and intensive production practices. Nature 418, 671–677 10.1038/nature01014 (doi:10.1038/nature01014) [DOI] [PubMed] [Google Scholar]
- 5.Carpenter SR, Bennett EM. 2011. Reconsideration of the planetary boundary for phosphorus. Environ. Res. Lett. 6, 014009. 10.1088/1748-9326/6/1/014009 (doi:10.1088/1748-9326/6/1/014009) [DOI] [Google Scholar]
- 6.Schindler DW. 2006. Recent advances in the understanding and management of eutrophication. Limnol. Oceanogr. 51, 356–363 10.4319/lo.2006.51.1_part_2.0356 (doi:10.4319/lo.2006.51.1_part_2.0356) [DOI] [Google Scholar]
- 7.Childers DL, Corman J, Edwards M, Elser JJ. 2011. Sustainability challenges of phosphorus and food: solutions from closing the human phosphorus cycle. Bioscience 61, 117–124 10.1525/bio.2011.61.2.6 (doi:10.1525/bio.2011.61.2.6) [DOI] [Google Scholar]
- 8.Cordell D, Drangert J-O, White S. 2009. The story of phosphorus: global food security and food for thought. Glob. Environ. Change 19, 292–305 10.1016/j.gloenvcha.2008.10.009 (doi:10.1016/j.gloenvcha.2008.10.009) [DOI] [Google Scholar]
- 9.van Kauwenbergh SJ. 2010. World phosphate rock reserves and resources. Muscle Shoals, AL: International Fertilizer Development Center [Google Scholar]
- 10.Steen I. 1998. Phosphorus availability in the 21st century: management of a non-renewable resource. Phosphorus Potassium 217, 25–31 [Google Scholar]
- 11.Sattari SZ, Bouwman AF, Giller KE, van Ittersum MK. 2012. Residual soil phosphorus as the missing piece in the global phosphorus crisis puzzle. Proc. Natl Acad. Sci. USA 109, 6348–6353 10.1073/pnas.1113675109 (doi:10.1073/pnas.1113675109) [DOI] [PMC free article] [PubMed] [Google Scholar]
- 12.Sanchez PA, Uehara G. 1980. Management consideration for acid soils with high phosphorus fixation capacity. The role of phosphorus in agriculture, pp. 471–514 Madison, WI: American Society of Agronomy [Google Scholar]
- 13.Fox RL, Nishimoto RK, Thompson JR, Pena RSDL. 1974. Comparative external phosphorus requirements of plants growing in tropical soils. Honolulu, HI: University of Hawaii, Department of Agronomy and Soil Science, College of Tropical Agriculture [Google Scholar]
- 14.Jacobson LM, David MB, Drinkwater LE. 2011. A spatial analysis of phosphorus in the Mississippi River basin. J. Environ. Q. 40, 931–941 10.2134/jeq2010.0386 (doi:10.2134/jeq2010.0386) [DOI] [PubMed] [Google Scholar]
- 15.Billen G, Garnier J, Nemery J, Sebilo M, Sferratore A, Barles S, Benoit P, Benoît M. 2007. A long-term view of nutrient transfers through the Seine river continuum. Sci. Total Environ. 375, 80–97 10.1016/j.scitotenv.2006.12.005 (doi:10.1016/j.scitotenv.2006.12.005) [DOI] [PubMed] [Google Scholar]
- 16.Heckrath G, Brookes PC, Poulton PR, Goulding KWT. 1995. Phosphorus leaching from soils containing different phosphorus concentrations in the Broadbalk experiment. J. Environ. Qual. 24, 904–910 10.2134/jeq1995.00472425002400050018x (doi:10.2134/jeq1995.00472425002400050018x) [DOI] [Google Scholar]
- 17.Jordan TE, Correll DL, Weller DE. 1997. Relating nutrient discharges from watersheds to land use and streamflow variability. Water Resour. Res. 33, 2579–2590 10.1029/97WR02005 (doi:10.1029/97WR02005) [DOI] [Google Scholar]
- 18.Turner RE, Rabalais NN. 2003. Linking landscape and water quality in the Mississippi river basin for 200 years. Bioscience 53, 563–572 10.1641/0006-3568(2003)053[0563:LLAWQI]2.0.CO;2 (doi:10.1641/0006-3568(2003)053[0563:LLAWQI]2.0.CO;2) [DOI] [Google Scholar]
- 19.FAO 2009. How to feed the world in 2050. Rome, Italy: Food and Agriculture Organization of the United Nations (FAO). [Google Scholar]
- 20.Foley JA, et al. 2011. Solutions for a cultivated planet. Nature 478, 337–342 10.1038/nature10452 (doi:10.1038/nature10452) [DOI] [PubMed] [Google Scholar]
- 21.Morton DC, DeFries R, Shimabukuro YE, Anderson LO, Arai E, Espirito-Santo FD, Freitas R, Morisette J. 2006. Cropland expansion changes deforestation dynamics in the southern Brazilian Amazon. Proc. Natl Acad. Sci. USA 103, 14 637–14 641 10.1073/pnas.0606377103 (doi:10.1073/pnas.0606377103) [DOI] [PMC free article] [PubMed] [Google Scholar]
- 22.Sanchez PA, Logan TJ. 1992. Myths and science about the chemistry and fertility of soils in the tropics. In Myths and science of soils of the tropics (eds Lal RA, Sanchez PA.), pp. 35–46 Madison, WI: Soil Science Society of America, Inc [Google Scholar]
- 23.Burnham CP, Lopez-Hernandez D. 1982. Phosphate retention in different soil taxonomic classes. Soil Sci. 134, 376–380 10.1097/00010694-198212000-00006 (doi:10.1097/00010694-198212000-00006) [DOI] [Google Scholar]
- 24.Börling K, Otabbong E, Barberis E. 2001. Phosphorus sorption in relation to soil properties in some cultivated Swedish soils. Nutrient Cycling Agroecosyst. 59, 39–46 10.1023/A:1009888707349 (doi:10.1023/A:1009888707349) [DOI] [Google Scholar]
- 25.Brennan RF, Bolland MDA, Jeffery RC, Allen DG. 1994. Phosphorus adsorption by a range of Western-Australian soils related to soil properties. Commun. Soil Sci. Plant Anal. 25, 2785–2795 10.1080/00103629409369225 (doi:10.1080/00103629409369225) [DOI] [Google Scholar]
- 26.Zhang H, Schroder JL, Fuhrman JK, Basta NT, Storm DE, Payton ME. 2005. Path and multiple regression analyses of phosphorus sorption capacity. Soil Sci. Soc. Am. J. 69, 96–106 10.2136/sssaj2005.0096 (doi:10.2136/sssaj2005.0096) [DOI] [Google Scholar]
- 27.FAO. Soil Suborders (database on the Internet) 2011. Rome, Italy: Food and Agriculture Organization of the United Nations (FAO). Food and Agriculture Organization of the United Nations (FAO). (Accessed 2011) [Google Scholar]
- 28.Riskin SH, Porder S, Schipanski ME, Bennett EM, Neill C. 2013. Regional differences in the environmental costs of high phosphorus-input soybean agriculture. BioSci. 63, 49–54 [Google Scholar]
- 29.Soil Functional Capacity Classification System Maps (database on the Internet) 2003. HarvestChoice Labs. (Accessed 2011) See http://labs.harvestchoice.org/2010/12/updating-soil-functional-capacity-classification-system/
- 30.Le Mare PH, Leon LA. 1989. The effects of lime on adsorption and desorption of phosphate in five Colombian soils. J. Soil Sci. 40, 59–69 10.1111/j.1365-2389.1989.tb01254.x (doi:10.1111/j.1365-2389.1989.tb01254.x) [DOI] [Google Scholar]
- 31.Naidu R, Syersy JK, Tillman RW, Kirkman JH. 1990. Effect of liming on phosphate sorption by acid soils. J. Soil Sci. 41, 165–175 10.1111/j.1365-2389.1990.tb00054.x (doi:10.1111/j.1365-2389.1990.tb00054.x) [DOI] [Google Scholar]
- 32.Sato S, Comerford NB. 2005. Influence of soil pH on inorganic phosphorus sorption and desorption in a humid brazilian Ultisol. Revista Brasileira de Ciéncia do Solo 29, 685–694 10.1590/S0100-06832005000500004 (doi:10.1590/S0100-06832005000500004) [DOI] [Google Scholar]
- 33.Smyth TJ, Sanchez PA. 1980. Effects of lime, silicate, and phosphorus applications to an Oxisol on phosphorus sorption and ion retention. Soil Sci. Soc. Am. J. 44, 500–505 10.2136/sssaj1980.03615995004400030012x (doi:10.2136/sssaj1980.03615995004400030012x) [DOI] [Google Scholar]
- 34.Hansen NC, Daniel TC, Sharpley AN, Lemunyon JL. 2002. The fate and transport of phosphorus in agricultural systems. J. Soil Water Conserv. 57, 408–417 [Google Scholar]
- 35.Riskin SH. 2012. The hydrological and biogeochemical consequences of conversion to soybean cultivation on the Amazonian agricultural frontier. PhD dissertation Deptartment of Ecology and Evolutionary Biology, Brown University, Providence, RI, USA [Google Scholar]
- 36.Hayhoe SJ, Neill C, Porder S, McHorney R, Lefebvre P, Coe MT, Elsenbeer H, Krusche AV. 2011. Conversion to soy on the Amazonian agricultural frontier increases streamflow without affecting stormflow dynamics. Glob. Change Biol. 17, 1821–1833 10.1111/j.1365-2486.2011.02392.x (doi:10.1111/j.1365-2486.2011.02392.x) [DOI] [Google Scholar]
- 37.Scheffler R, Neill C, Krusche AV, Elsenbeer H. 2011. Soil hydraulic response to land-use change associated with the recent soybean expansion at the Amazon agricultural frontier. Agriculture Ecosyst. Environ. 144, 281–289 10.1016/j.agee.2011.08.016 (doi:10.1016/j.agee.2011.08.016) [DOI] [Google Scholar]
- 38.Projeto Radambrasil 1981. Folha SD.22 Goiàs. Geologia, geomorphologia, pedologia, vegetacao, uso potencial da terra. Rio de Janeiro: Ministério das Minas e Energia, Departamento Nacional de Fundução Mineral, Rio de Janeiro, Brasil [Google Scholar]
- 39.Tiessen H, Moir JO. 1993. Characterization of available P by sequential extraction. In Soil sampling and methods of analysis (ed. Carter MR.). Boca Raton, FL: Lewis Publishers [Google Scholar]
- 40.Fox RL, Kamprath EJ. 1970. Phosphate sorption isotherms for evaluating the phosphate requiremens of soils. Soil Sci. Soc. Am. Proc. 34, 902–907 10.2136/sssaj1970.03615995003400060025x (doi:10.2136/sssaj1970.03615995003400060025x) [DOI] [Google Scholar]
- 41.Graetz DA, Nair VD. 2000. Phosphorus sorption isotherm determination. In Methods of phosphorus analysis for soils, sediments, residuals, and waters (ed. Pierzynski GM.), pp. 35–38 Manhattan, KS: SERA-IEG 17 [Google Scholar]
- 42.Olander LP, Vitousek PM. 2004. Biological and geochemical sinks for phosphorus in soil from a wet tropical forest. Ecosystems 7, 404–419 10.1007/s10021-004-0264-y (doi:10.1007/s10021-004-0264-y) [DOI] [Google Scholar]
- 43.da Cunha JF, Casarin V, Prochnow LI. 2010. Balanço de nutrientes na agricultura Brasileira. Piracicaba, São Paulo, Brazil: International Plant Nutrition Institute – Brazil [Google Scholar]
- 44.Mahowald NM, Artaxo P, Baker AR, Jickells TD, Okin GS, Randerson JT, Townsend AR. 2005. Impacts of biomass burning emissions and land use change on Amazonian atmospheric phosphorus cycling and deposition. Glob. Biogeochem. Cycle 19, 15. 10.1029/2005GB002541 (doi:10.1029/2005GB002541) [DOI] [Google Scholar]
- 45.MacDonald GK, Bennett EM, Potter PA, Ramankutty N. 2011. Agronomic phosphorus imbalances across the world's croplands. Proc. Natl Acad. Sci. USA 108, 3086–3091 10.1073/pnas.1010808108 (doi:10.1073/pnas.1010808108) [DOI] [PMC free article] [PubMed] [Google Scholar]
- 46.Sanchez PA. 1976. Properties and management of tropical soils. New York, NY: John Wiley [Google Scholar]
- 47.Araujo MSB, Schaefer CER, Sampaio EVSB. 2004. Soil phosphorus fractions from toposequences of semi-arid Latosols and Luvisols in northeastern Brazil. Geoderma 119, 309–321 10.1016/j.geoderma.2003.07.002 (doi:10.1016/j.geoderma.2003.07.002) [DOI] [Google Scholar]
- 48.Cross AF, Schlesinger WH. 1995. A literature review and evaluation of the Hedley fractionation: applications to the biogeochemical cycle of soil phosphorus in natural ecosystems. Geoderma 64, 197–214 10.1016/0016-7061(94)00023-4 (doi:10.1016/0016-7061(94)00023-4) [DOI] [Google Scholar]
- 49.Friesen DK, Rao IM, Thomas RJ, Oberson A, Sanz JI. 1997. Phosphorus acquisition and cycling in crop and pasture systems in low fertility tropical soils. Plant Soil 196, 289–294 10.1023/A:1004226708485 (doi:10.1023/A:1004226708485) [DOI] [Google Scholar]
- 50.Lilienfein J, Wilcke W, Ayarza MA, Vilela L, Lima SD, Zech W. 2000. Chemical fractionation of phosphorus, sulphur, and molybdenum in Brazilian savannah Oxisols under different land use. Geoderma 96, 31–46 10.1016/S0016-7061(00)00002-1 (doi:10.1016/S0016-7061(00)00002-1) [DOI] [Google Scholar]
- 51.Oberson A, Friesen DK, Rao IM, Buhler S, Frossard E. 2001. Phosphorus transformations in an Oxisol under contrasting land-use systems: the role of the soil microbial biomass. Plant Soil 237, 197–210 10.1023/A:1013301716913 (doi:10.1023/A:1013301716913) [DOI] [Google Scholar]
- 52.Beck MA, Sanchez PA. 1994. Soil-phosphorus fraction dynamics during 18 years of cultivation on a typic paleudult. Soil Sci. Soc. Am. J. 58, 1424–1431 10.2136/sssaj1994.03615995005800050021x (doi:10.2136/sssaj1994.03615995005800050021x) [DOI] [Google Scholar]
- 53.McGechan MB, Lewis DR. 2002. Soil and water: sorption of phosphorus by soil. I. Principles, equations and models. Biosyst. Eng. 82, 1–24 10.1006/bioe.2002.0054 (doi:10.1006/bioe.2002.0054) [DOI] [Google Scholar]
- 54.McGechan MB. 2002. Soil and water: sorption of phosphorus by soil. II. Measurement methods, results and model parameter values. Biosyst. Eng. 82, 115–130 10.1006/bioe.2002.0068 (doi:10.1006/bioe.2002.0068) [DOI] [Google Scholar]
- 55.Garcia-Montiel DC, Neill C, Melillo J, Thomas S, Steudler PA, Cerri CC. 2000. Soil phosphorus transformations following forest clearing for pasture in the Brazilian Amazon. Soil Sci. Soc. Am. J. 64, 1792–1804 10.2136/sssaj2000.6451792x (doi:10.2136/sssaj2000.6451792x) [DOI] [Google Scholar]
- 56.Uhl C. 1987. Factors controlling succession following slash-and-burn agriculture in Amazonia. J. Ecol. 75, 377–407 10.2307/2260425 (doi:10.2307/2260425) [DOI] [Google Scholar]
- 57.Townsend AR, Porder S. 2012. Agricultural legacies, food production and its environmental consequences. Proc. Natl Acad. Sci. USA 109, 5917–5918 10.1073/pnas.1203766109 (doi:10.1073/pnas.1203766109) [DOI] [PMC free article] [PubMed] [Google Scholar]