Abstract
In many biomechanical problems, the availability of a suitable model for the wrapping of muscles when undergoing movement is essential for the estimation of forces produced on and by the body during motion. This is an important factor in the Osteoporotic Virtual Physiological Human project which is investigating the likelihood of fracture for osteoporotic patients undertaking a variety of movements. The weakening of their skeletons makes them particularly vulnerable to bone fracture caused by excessive loading being placed on the bones, even in simple everyday tasks. This paper provides an overview of a novel volumetric model that describes muscle wrapping around bones and other muscles during movement, and which includes a consideration of how the orientations of the muscle fibres change during the motion. The method can calculate the form of wrapping of a muscle of medium size and visualize the outcome within tenths of seconds on commodity hardware, while conserving muscle volume. This makes the method suitable not only for educational biomedical software, but also for clinical applications used to identify weak muscles that should be strengthened during rehabilitation or to identify bone stresses in order to estimate the risk of fractures.
Keywords: musculoskeletal modelling, patient-specific model, motion fusion, muscle wrapping, Visualization Toolkit
1. Introduction
Musculoskeletal diseases (such as osteoporosis and neuromuscular disorders) affect hundreds of millions of people around the world. In most cases, these disorders are incurable and their treatment is generally ameliorative, involving changes in lifestyle supported by rehabilitation to improve the quality of patient life. To maximize the effectiveness of the treatment, a full understanding of the physiology of muscles is required—for example, one needs to understand the role played by different motion activities (e.g. walking, climbing stairs or falling) in the overall risk of bone fracture in order to be able to propose suitable changes in lifestyle. To be useful, this assessment has to be specific to the individual patient. This is one of the challenges currently being addressed by the EC-funded project VPHOP: the Osteoporotic Virtual Physiological Human [1], 2008–2012, which is an integrated project involving 21 partners.
Skeletal loading is significant for patients with osteoporosis, as even small local peaks in the loading can cause fractures in bones made brittle by the disease; skeletal loading can be estimated only by using a suitable modelling technique [2]. Although medical imaging, e.g. magnetic resonance imaging (MRI) and computed tomography, can potentially provide all the data from which a complete anatomical model of a patient can be constructed, it is currently impractical (and unethical, considering the amount of imaging that would have to be performed on the patient) to create such a customized model from scratch [3]. One solution lies in constructing a generic musculoskeletal model (using data from cadaver studies) that can be scaled and morphed to fit a patient-specific model, using limited imaging and morphometric data from the patient [4,5].
Musculoskeletal models [6–11] in common clinical use assume that the mechanical action of the muscle occurs along a polyline, named the line of action, joining the origin and insertion points of the muscle, i.e. the sites at which the muscle is attached to the bone by a tendon. In essence, a line of action is a representation of the muscle fibres and tendons. An advantage of action-line models, besides their rapid processing speed, is that the model created for one particular patient can be easily adjusted, usually by uniform scaling [5], to fit another patient, though, of course, if the anatomies of the patients differ greatly, this may no longer be true. However, these models tend to overestimate the predicted joint loads because their assumption of muscle fibre length being uniform over the entire muscle bundle is often not fulfilled in practice [2]. Another drawback is that representing a muscle by a set of ad hoc lines of action provides only a limited physical representation of the changes induced in the human anatomy by movement and may lead to inaccurate estimation of many features important in the functioning of muscles, such as cross-sectional area [12].
A more accurate approach represents a muscle by a B-spline solid [13] in which the iso-lines correspond to muscle fibres, data for which are extracted from a cadaver. Deformation is controlled by manipulation of the control points of the spline. An alternative uses a three-dimensional finite element mesh (FEM) whose elements contain information about the direction of the muscle fibres present in its volume [14–16], and the vertices move in reaction to the external force induced by the movement of the bones. Although these models produce results that show good agreement when compared with static MRI images taken in different postures [14,15], their use in the clinical context is highly impractical because generating the meshes is a complex process that may require several days’ work even for a highly skilled operator, and computing the solution requires several hours on a supercomputer [14].
A different approach is used in character animation. Muscles are represented variously as implicit blobs, ellipsoids [17,18] or Bézier patches [19], which deform in reaction to bone movement. Aubel & Thalmann [11] proposed a physiologically based technique by representing a muscle by a line of action and a triangular surface mesh bound to nodes of that line of action so that a change in the path of the line of action triggers a deformation of the muscle surface. Although they typically run in real time, these models emphasize visual appeal rather than anatomical accuracy, e.g. the issue of impenetrability between muscles and bones is not addressed [15], and muscle fibres are not produced, so they are not suited to biomechanical calculations.
Our model starts from an atlas and deforms this generic model according to data captured from the individual patient to form a personalized model. Motion is captured of a subject performing activities suitable to the investigation taking place. If the individual is the actual patient, these data can be used immediately; if not, motion retargeting has to take place to match the motion to the skeleton of the patient. After this, the motion is fused with the anatomical data and this provides the environment for the muscle deformation calculations to take place. In this, the positions and shapes of the muscles during motion are calculated, with interpenetration being avoided so that muscles wrap properly around the bones and other muscles. A muscle fibre model is accommodated within the deformed muscle.
The paper provides an overview of the method; other papers [20,21] provide greater detail about specific novel aspects. The remainder of this paper is structured as follows. In §2, we present the generic musculoskeletal model, and §3 describes the adjustments necessary to create a patient-specific model from it. Motion fusion is discussed in §4, while §5 gives an overview of the proposed muscle fibre wrapping technique. A summary of the experiments performed and their results can be found in §6 and §7 concludes this paper.
2. Our generic musculoskeletal model
Our model of the lower limbs extends the action-line model, with bones and muscles being represented by triangulated surface meshes in the rest-pose position as captured from MRI images of a female cadaver [22]. Subsequently, these were improved using various operations such as the Poisson surface reconstruction, removal of non-manifold edges, hole filling and smoothing that are available in mesh editing applications, e.g. MeshLab (http://www.meshlab.sourceforge.net/) and Blender (http://www.blender.org/). For each muscle, two sets of landmarks fixed to an underlying bone, for the origin and insertion areas, were specified by an expert, who also defined the arrangement of the muscle fibres in the muscle—parallel, pennate, curved, fanned or something else (figure 1).
Figure 1.
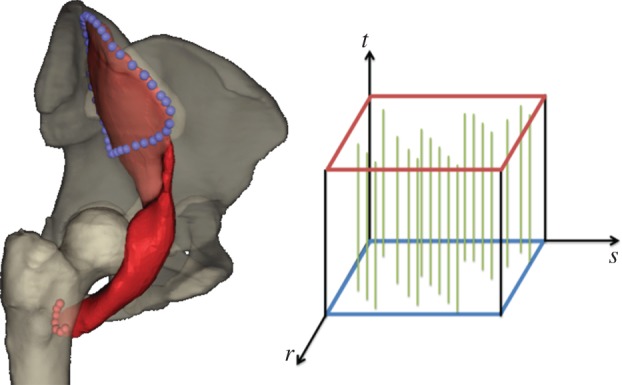
Iliacus, its attachment areas (blue and red spheres) and muscle fibre arrangement (see the muscle fibre template) as defined by an expert. (Online version in colour.)
Each muscle is also associated with one or more lines of action that describe its general path between the origin and insertion attachment areas and are considered as the muscle ‘skeleton’. Muscles that have large (e.g. glutaeal muscles) or multiple (e.g. biceps femoris) attachment areas are associated with two lines of action, all other muscles with just one. In most cases, a line of action is a straight or piecewise straight, line, possibly passing via a single intermediate point. Both endpoints, and the intermediate point if it exists, are given as landmarks specified by an expert; these are fixed to the surface of the relevant bone and move automatically with it. For some muscles, e.g. iliacus, the lines of action wrap around specified wrapping parametric surfaces, such as spheres and cylinders, on paths defined by our wrapping algorithm, which is a slight modification of the global optimization method described by Audenaert & Audenaert [10] for the following obstacle sets: single sphere, single cylinder and sphere-capped cylinder.
For the latter two obstacle sets, the original global algorithm assumes that the endpoint E of the line of action lies on the cylinder surface. However, this assumption is often violated in practice as the endpoint is a landmark placed on the bone surface by an expert. Hence, a new point I (xE, yE, zE) through which the path must pass is introduced on the cylinder surface (figure 2). Essentially, I is the point at which the line of action leaves the cylinder. As line EI is a tangent to the cylinder, provided that the axis of the cylinder is aligned with the z-axis (if this is not the case, a simple coordinate transformation can be applied to make it so), the coordinates xI and yI of the point I can be obtained from the equations  where r is the radius of the cylinder. Following the assumption that the overall length of the line of action path should be a minimum [6], the golden section search [23] is then used to find the optimal zI.
Figure 2.
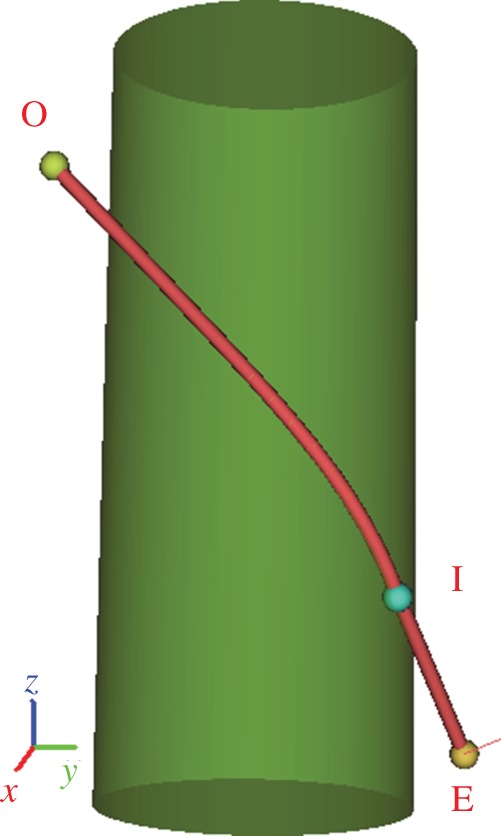
Wrapping of line of action around a single cylinder from the given origin point O to the given endpoint E through one via point (I) whose coordinates were automatically evaluated so that the overall length of the path from O to E would be minimal. (Online version in colour.)
Models of muscles and bones are hierarchically grouped into regions. Each region represents a different part of the body, e.g. right thigh, shank or pelvis, and is geometrically defined as a triangular surface mesh, which should be a model of an external body layer, i.e. skin. However, owing to lack of these data, it is a low-resolution model of the skeletal structure in our case. On the surface mesh of the region, landmarks for motion fusion are specified. Regions are connected by joints with different degrees of freedom, as described in Delp & Loan [7], to assist with motion retargeting. An overview of our musculoskeletal model is given in figure 3.
Figure 3.
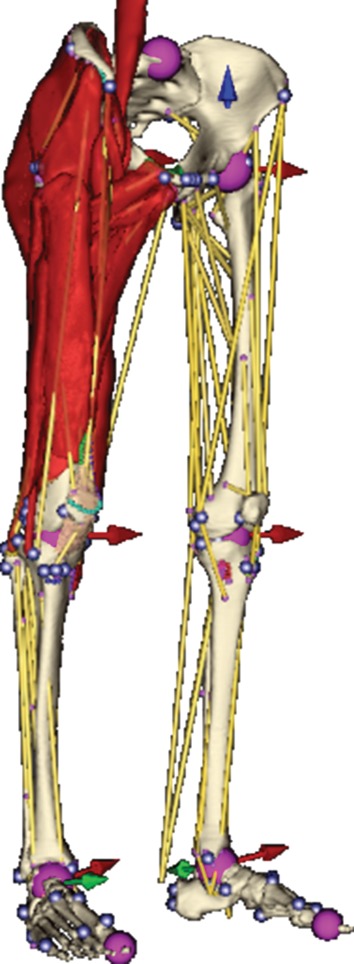
An overview of our musculoskeletal model. Lines of action are depicted as yellow line segments, spheres with arrows show the position and degree of freedom of joints defined. (Online version in colour.)
3. Adjustments to create a patient-specific model
Creating a patient-specific musculoskeletal model directly from medical imaging is impractical as a huge amount of human effort would be involved in performing the necessary segmentation and reconstruction of the three-dimensional surface models. Instead, a common practice is to derive the patient model from a generic model such as that described in §2. This is accomplished by appropriate scaling of the generic model to fit the specific features to be found in the patient's anatomy; to achieve the required level of fit, this scaling would be non-uniform, which means that generic linear scaling would not work. The inputs to the scaling process are the generic surface musculoskeletal model, with muscle attachment landmarks, and patient-specific landmarks.
In our method, the patient-specific landmarks are extracted from EOS images. An EOS image is a pair of orthogonal X-ray images acquired by low-dose EOS imaging devices. One advantage of EOS imaging over normal X-rays is that the image is created by orthogonal projection, which makes it possible to acquire accurate positional information. Salient landmarks of patients are manually positioned on and extracted from the digital EOS images by experienced operators, as shown in figure 4. As bones are more distinguishable than muscles in EOS images, it is preferred to use landmarks on bones. Our method uses three pairs of patient landmarks which can be easily located—the centroid of the femur head, the centroid of the patella and the lower end of the tibia, as shown in figure 4. However, other landmarks can also be defined and used.
Figure 4.
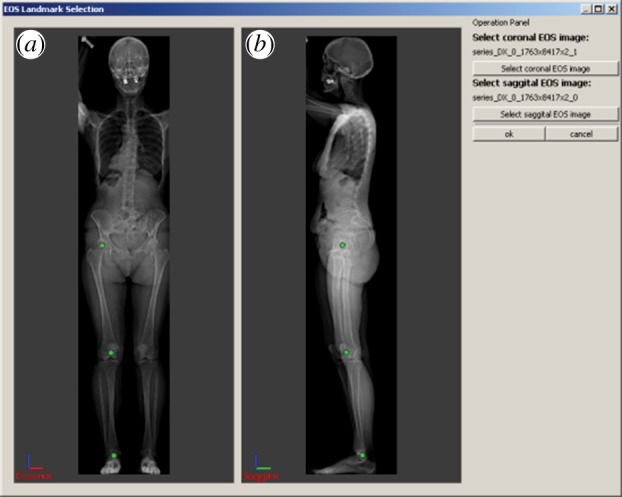
Patient landmark (green dots) positioning in EOS images: (a) coronal view, (b) sagittal view; landmarks used in this paper are the centroid of the femur head, the centroid of the patella, and the lower end of the tibia. (Online version in colour.)
Laplacian mesh deformation is used to achieve patient-specific scaling that captures the anatomical characteristics of the patient's anatomy while preserving the overall structure of the generic model. The input generic model is a surface model composed of a set of closed surfaces of bones, muscles and tendons. The surfaces are triangular meshes defined by vertices and triangles. In Laplacian deformation [24], the generic mesh model is re-expressed by a discrete form of the differential Laplacian shape descriptor as the discrete differential coordinates of vertices on the surface, i.e. the distance of a vertex to the average of all of its weighted neighbouring vertices (δ coordinates).
These coordinates are then represented in the form of a Laplacian matrix equation [24] in which the matrix on the left side of the equation represents the connectivity and weights of vertices while the right side represents δ coordinates. The correspondence between certain surface points and patient-specific landmarks is established and represented in the Laplacian equation. For example, for the centroid of the femur head, three points are used: the uppermost, hindmost and outermost points in the femur head. The distances between the patient-specific landmarks and the corresponding points in the generic model are inserted into the matrix, and the aim is to conserve them. The user-specified positions of the patient-specific landmarks are used as target positions on the right side of the Laplacian equation.
The generic model is composed of multiple closed mesh surfaces representing bones, muscles and tendons; the muscles and bones are very closely positioned and the gaps between neighbouring surfaces are very small. Without special constraints, floating of the surfaces and penetration between them may occur after scaling. Careful consideration is needed to retain the integrity of the musculoskeletal structures, to preserve the muscle–bone attachments and to prevent inter-surface penetration. This is achieved by adding extra constraints to the Laplacian matrix equation—muscle-attachment constraints and inter-surface constraints are used to preserve the muscle–bone attachment, and to prevent muscle–muscle and muscle–bone penetration. Muscle attachment landmarks used as muscle–bone constraints are available in the generic model, whereas inter-muscle constraint points are obtained by finding the closest points among neighbouring surfaces. With these additional constraints, the generic musculoskeletal model can be scaled properly to a patient-specific model. The output of the scaling is a patient-fitted musculoskeletal model, as shown in figure 5.
Figure 5.
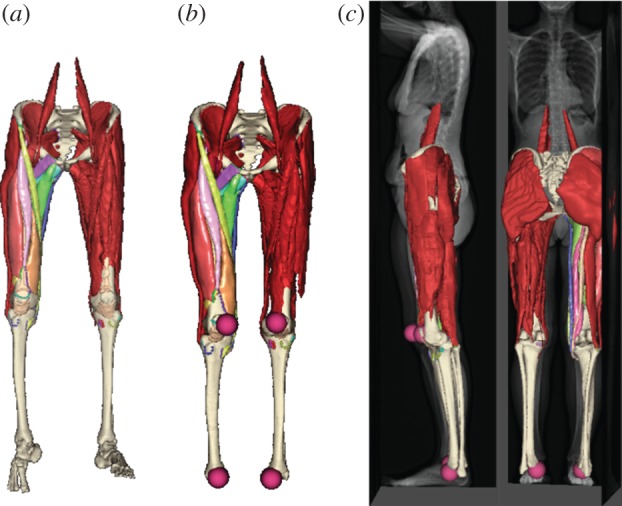
Bones and muscles of generic atlas model: (a) before and (b) after Laplacian scaling; (c) fitting of the scaled model to patient EOS images. (Online version in colour.)
The generic model also includes motion landmarks, which are used for motion retargeting; these also need to be scaled. The landmark is usually very close to the surface of a bone, so the closest point on a bone surface is chosen as its anchor point and the distance between the landmark points and their anchor points is used as the Laplacian δ coordinate in the equation.
Total energy minimization is applied to solve the Laplacian matrix equation to calculate the scaled model. This is achieved by optimizers which minimize the weighted sum of the δ coordinates and the distance between landmarks and their targets; in our implementation, the least-squares optimizer is used. Global non-uniform scaling is achieved. Local surface details are preserved by the differential Laplacian shape descriptor, while the patient-specific landmark points are moved close to their target locations.
One challenge in scaling the full set of generic musculoskeletal models is that the least-squares optimizer may produce an out-of-memory error as the memory demands of the matrix decomposition can regularly exceed what is available on a typical PC platform. In such circumstances, a low-resolution generic model is created with the quadric mesh decimator available in the Visualization Toolkit (VTK) [25] in a pre-processing step. Scaling is then applied using this low-resolution model, for which the Laplacian matrix equation solving fits within the available memory, to create a patient-specific low-resolution model. As a high-resolution model is very close to its low-resolution counterpart, correspondence between points in the high-resolution and low-resolution models can be established allowing the patient-specific high-resolution model to be formed.
4. Motion fusion
Once the model is adapted, it can be fused with motion data defining the kinematics of the skeleton during various physical activities, e.g. walking, stair climbing or falling to one side. Our motion data contain time-variant landmarks acquired from tracking markers placed on the subject. The iterative closest point (ICP) algorithm by Horn [26], which is implemented in the VTK [25], is used for the registration of these time-variant landmarks and the corresponding landmarks that are specified in our model. For each time frame, the ICP algorithm translates and rotates the regions according to the input motion data, which results in translation and rotation of the bone surface meshes because the vertex coordinates of a bone mesh are relative to the position of the region to which this bone belongs. Consequently, the positional parameters of the parametric wrapping surfaces, the coordinates of the landmarks for the attachment areas and the coordinates of the endpoints of the lines of action change, because they are all relative to the position of the corresponding bone. As a result, the wrapping algorithm (see §2) must be run to update the paths of the lines of action, after which the muscle surface meshes are wrapped as will be described in §5.
If the motion was captured from the same subject as that represented in the patient-specific model, the motion can be used directly. However, if the anatomy of the moving subject is dissimilar from that of the static patient-specific model, the input motion data must be converted into a physically plausible motion that preserves the desirable properties of the original motion data, such as kinematics, balance, torque limit and momentum [27], in the moving object but which relates to an anatomy consistent with the static patient-specific model. This is known as motion retargeting.
For this purpose, we use a Kàlmàn filter [27], originally used in cinematic computer animation, with a slight modification: only kinematic constraints (position and orientation) are considered because the original captured data will have correct physical data and the retargeted motion should not diverge greatly from the original—the other constraints, which were included to support the possibility of computer graphics characters having extreme physical characteristics, are not required in our context. Furthermore, unlike the other constraints, kinematic constraints can be specified interactively, and the filter can perform motion retargeting based on these constraints, with interactive performance.
One difficulty with the Kàlmàn filter is that it works with motion data in which the kinematics is represented by time-varying positions of joints that are interconnected by line segments and for which information about their degrees of freedom is known. Our motion data, however, contain time-varying external body landmarks, so it is necessary to estimate the joint positions from these landmarks. We use the algorithm described by Kirk et al. [28] that works as follows. First, the landmarks are subdivided into groups so that all landmarks of one group are in proximity to the same physical joint. Kirk et al. [28] suggest using a clustering technique, but we opted for a predefined subdivision scheme because landmarks in our motion data are named so it is known to which joint each of them contributes. For each group, the algorithm specifies the joint position to be at the point that minimizes the average variance in distance between itself and the landmarks of this group through all time frames. This is a nonlinear optimization problem, which is solved using an iterative nonlinear conjugate gradient method [23]. We note that relations between joints and their degrees of freedom are adopted from those predefined in the static musculoskeletal model.
5. Muscle fibre wrapping
For each time frame (current-pose position), the difference between the new and previous paths of the line of action determines how the muscle surface should change to fit the anatomy at the current time frame. We have developed a gradient-domain deformation technique to deform the muscle accordingly, based on the iterative solution of a system of linear equations with a nonlinear constraint. It preserves the volume of the muscle being deformed [29] and can process a muscle of medium size in less than 400 ms on commodity hardware, while keeping the volume error below 1 per cent.
The method also has the option of enforcing impenetrability of muscles and bones, though this has some computational cost. To process a single muscle of medium size, avoiding penetration only with bones, i.e. muscles are allowed to intersect each other, the method takes, on average, 23 s on commodity hardware. Increasing the number of meshes involved, as needed if muscle–muscle penetration is considered, increases the overall time substantially and the method may take up to 5 min for several meshes, but this is still far below that needed by previous methods [14]. Further details are provided in Kohout et al. [20].
Once the muscle is deformed, we can decompose its volume into an arbitrarily large number of muscle fibres, with each muscle fibre being represented by a polyline of user-specified resolution, i.e. the number of linear segments from which the polyline is formed. Our decomposition technique [21] is based on slice-by-slice mapping on to the surface of the muscle, a cubical template that contains, in its interior, fibres represented by Bézier curves as defined by Blemker & Delp [14]; it uses the technique described by Ju et al. [30] to map the fibre vertices into the interior of the muscle. A muscle of medium size (10 K triangles) can be decomposed by our technique in less than 1 s, even for a large number of fibres (256) and a high resolution (50 segments). Further details are provided in Kohout et al. [21].
6. Experiments and results
Our approach was implemented in C++ (MS Visual Studio 2010) under the Multimod Application Framework [31], which is a visualization system based mainly on VTK [25], and integrated into the LHPBuilder software developed within the VPHOP project [1].
The user interface for placing landmarks on an EOS image pair is shown in figure 4. Predefined landmarks—the centroids of the femur ball and patella and the lower end of the tibia—can be viewed and moved by the operator. Figure 4a displays the frontal image and is used to locate the landmarks in the coronal (xz) plane, whereas figure 4b is from the side and is used to locate landmarks in the sagittal (yz) plane. The images can be flipped horizontally or vertically as the coordinate system of the EOS images may differ from that of the generic model.
Figure 5a shows the generic musculoskeletal model before and after scaling. It can be seen that the non-uniform scaling does preserve the overall shape and structures of the bones and muscles, and the muscle–bone attachment relationships correctly. There is no separation between neighbouring muscles and there is no visible penetration between muscles and bones. Figure 5b,c shows the scaled model together with patient-specific EOS images and landmarks. The scaled patient musculoskeletal model fits the patient images well, and the user-specified landmarks are at their desired positions in the scaled model. All of this demonstrates that the non-uniform scaling is successful.
The limitations of the EOS images mean that we can use landmarks only from bones, not from muscles or the skin, though the framework itself could support such landmarks. The more landmarks that are used, the better the scaling of the outer shapes of the muscles is likely to be, though there will be an associated cost in computation, particularly in terms of demands on the available memory.
Figure 6 shows the musculoskeletal model fused with walking motion data without motion retargeting. It can be seen that if the anatomy of the moving subject is similar to that represented in the static model, the results are realistic, though small imperfections may be observed: the head of the femur does not fit perfectly into the socket of the pelvis (for the right leg, the error was measured to be about 9.5 mm); similarly, the tibias are slightly dislocated (for the right leg, the error was about 14.9 mm).
Figure 6.
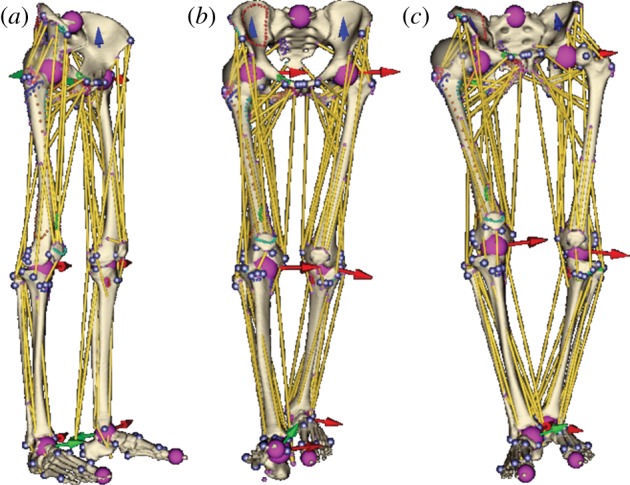
Musculoskeletal model: (a) before and (b) after being fused with anatomically compatible and (c) incompatible motion data when motion retargeting is not applied. (Online version in colour.)
It is important to point out that the position of a marker placed on the moving subject is subject to local skin deformations induced by muscle wrapping, so a single marker can determine the position of its underlying bone with only limited accuracy. Consequently, the error depends greatly on the number of time-variant landmarks specified for a part of the body in the motion data—the more landmarks that are used, the better the method can cope with these deformations. In our case, only three markers were used for the thigh, all with the same reliability. Introducing different weights for landmarks so that an unreliable landmark, e.g. left and right posterior superior iliac spines, has a lower weight than a more reliable one, e.g. left and right anterior superior iliac spines, can also decrease the error, but this increases the user intervention required, while the original motion fusion method is fully automatic.
If the anatomy of the moving subject is completely different from that represented in the static model, the results of motion fusion are totally unacceptable as the regions become unrealistically disjoint—see figure 6c, where the right femur ball centre is about 71.3 mm distant from its anatomical position and the right tibia is displaced about 33 mm from the femur. Motion retargeting is needed to produce acceptable results in such cases.
As motion retargeting requires the estimation of joint positions, we considered motion data for a subject anatomically compatible with the static model and compared the positions of the joints estimated from time-varying landmarks in the original motion data with the positions of those in the model fused with that motion data. From figure 7, it is apparent that the method is less accurate in estimating the lumbosacral and coxofemoral joints (error 44.23 mm±9.51) than in estimating the femorotibial (error 16.64 mm±4.49) and subtalar joints (error 7.81 mm±2.71). This is understandable because the former joints are more distant from their corresponding landmarks (acquired from tracking markers placed on the subject).
Figure 7.
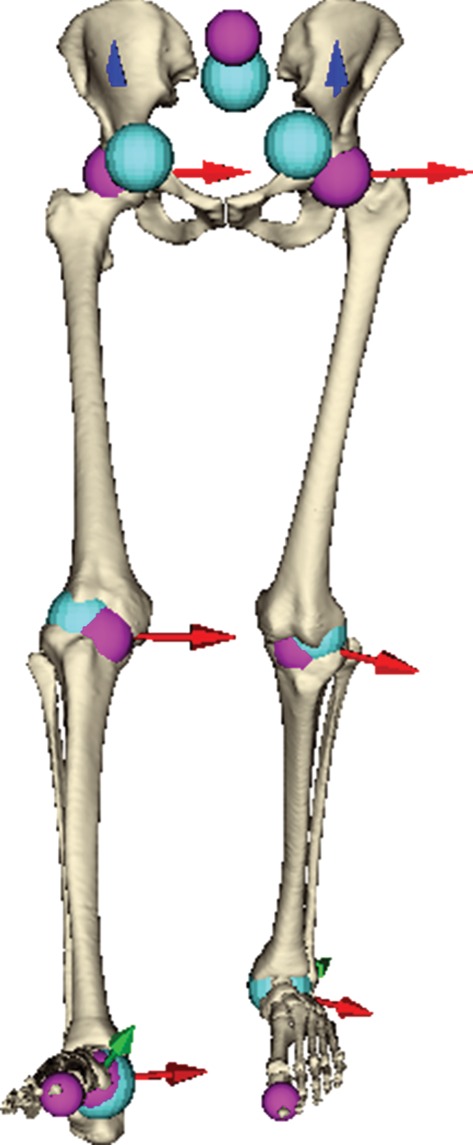
Estimated joints (cyan spheres) in comparison with their counterparts (pink spheres) present in our model. (Online version in colour.)
An example of motion retargeting is given in figure 8. The skeleton is constructed from the joints, as shown in figure 7, and is organized in a hierarchy from the leg to the foot. The tall skeleton has the original motion data, and this is retargeted to the short one with the same hierarchy but different bone lengths. The kinematic constraint in this case is that the steps of both skeletons are the same, i.e. the feet touch the same position on the ground, but the user can also interactively adjust this kinematic constraint by, for example, changing the step length. In figure 8, the short skeleton is also translated sideways to allow its walking motion to be displayed clearly. It can be seen that the short skeleton shares the pattern of movement with the tall one, which confirms that our Kàlmàn-like filter can provide us with a physically plausible motion that preserves the kinematic properties of the motion data in the moving object.
Figure 8.

Example of the result of motion retargeting. The skeleton is constructed from the joints, as shown in figure 6. The tall skeleton has the original motion data (walking from (a) to (b)), and this is retargeted to the short one with the same hierarchy but different bone lengths. The kinematic constraint in this case is that the feet touch the same position on the ground. The short skeleton is translated sideways to allow its walking motion to be displayed clearly. It can be seen that the short skeleton shares the pattern of movement with the tall one.
Figure 9 shows results of wrapping the muscle surface meshes for a walking human; overall, the shapes and mutual positions of the muscles are realistic—comparing the results against dynamic MRI, however, has yet to be done. In our experience, if the lines of action of a muscle do not accurately describe its general path (e.g. for iliacus, sartorius and gracilis), the accuracy of the muscle wrapping is affected. A comparison of the fibres produced by our method for muscle decomposition with those illustrated in a traditional anatomical atlas is given in figure 10. The fibre pattern is a good representation of reality, as confirmed by orthopaedists with whom we cooperate. More results regarding muscle fibre wrapping and verification can be found in Kohout et al. [21].
Figure 9.
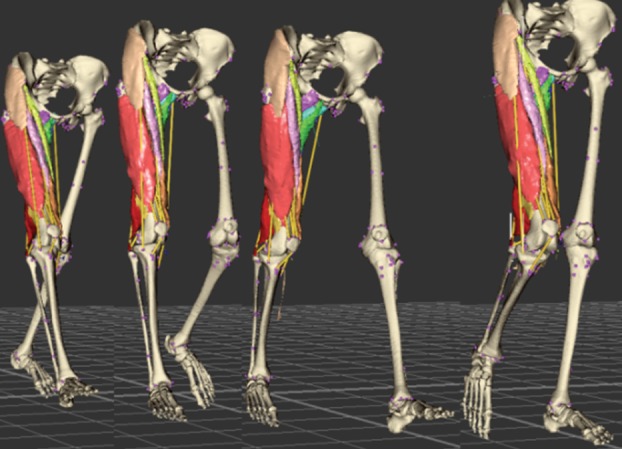
Wrapping of the muscles during movement. A supplementary movie is available from http://graphics.zcu.cz/Projects/Muskuloskeletal-Modeling. (Online version in colour.)
Figure 10.
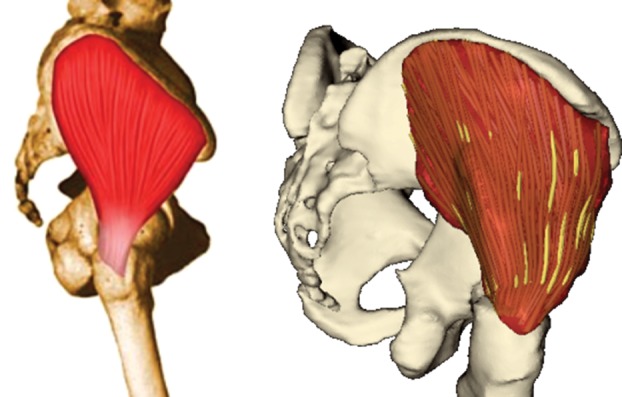
Glutaeus medius decomposed into fibres, compared with the illustration in Richardson [32]. (Online version in colour.)
7. Conclusion
This paper has presented a novel approach to the muscle wrapping of a patient-specific model in which the muscles are presented not as lines of action, as in most conventional bioengineering problems, but by volumetric models in which the fibre pattern of the muscle is embedded and moves with the muscle. The work is still at an early stage, but the results are encouraging. While slower than methods using only lines of action, its computational performance (seconds up to a couple of minutes) is satisfactory and work continues to optimize various aspects of the algorithm; increased use of the graphics processing unit may well bring rapid improvements. The availability of information concerning changes in muscle fibre direction during motion is likely to provide improved accuracy in force estimation, which is particularly important in the context of osteoporosis. Compared with alternative volumetric approaches such as FEM, the computational times are orders of magnitude faster.
Acknowledgements
This work was partially supported by the Information Society Technologies Programme of the European Commission within the project VPHOP (FP7-ICT-223865). The authors thank the numerous people who provided help and support for this work.
References
- 1.VPHOP: the osteoporotic virtual physiological human. See: http://www.vphop.eu. [Google Scholar]
- 2.Erdemir A, McLean S, Herzog W, van den Bogert AJ. 2007. Model-based estimation of muscle forces exerted during movements. Clin. Biomech. 22, 131–154 10.1016/j.clinbiomech.2006.09.005 (doi:10.1016/j.clinbiomech.2006.09.005) [DOI] [PubMed] [Google Scholar]
- 3.Audenaert EA, Mahieu P, van Hoof T, Pattyn C. 2010. Soft tissue structure modelling for use in orthopaedic applications and musculoskeletal biomechanics. Eurasip J. Adv. Signal Process. 2010, 389356. 10.1155/2010/389356 (doi:10.1155/2010/389356) [DOI] [Google Scholar]
- 4.Kaptein BL, van der Helm FCT. 2004. Estimating muscle attachment contours by transforming geometrical bone models. J. Biomech. 37, 263–273 10.1016/j.jbiomech.2003.08.005 (doi:10.1016/j.jbiomech.2003.08.005) [DOI] [PubMed] [Google Scholar]
- 5.Matias R, Andrade C, Veloso AP. 2009. A transformation method to estimate muscle attachments based on three bony landmarks. J. Biomech. 42, 331–335 10.1016/j.jbiomech.2008.11.027 (doi:10.1016/j.jbiomech.2008.11.027) [DOI] [PubMed] [Google Scholar]
- 6.Garner BA, Pandy MG. 2000. The obstacle-set method for representing muscle paths in musculoskeletal models. Comput. Methods Biomech. Biomed. Eng. 3, 1–30 10.1080/10255840008915251 (doi:10.1080/10255840008915251) [DOI] [PubMed] [Google Scholar]
- 7.Delp SL, Loan JP. 2000. A computational framework for simulating and analyzing human and animal movement. Comput. Sci. Eng. 2, 46–55 10.1109/5992.877394 (doi:10.1109/5992.877394) [DOI] [Google Scholar]
- 8.Arnold AS, Salinas S, Asakawa DJ, Delp SL. 2000. Accuracy of muscle moment arms estimated from MRI-based musculoskeletal models of the lower extremity. Comput. Aided Surg. 5, 108–119 10.3109/10929080009148877 (doi:10.3109/10929080009148877) [DOI] [PubMed] [Google Scholar]
- 9.Arnold EM, Ward SR, Lieber RL, Delp SL. 2010. A model of the lower limb for analysis of human movement. Ann. Biomed. Eng. 38, 269–279 10.1007/s10439-009-9852-5 (doi:10.1007/s10439-009-9852-5) [DOI] [PMC free article] [PubMed] [Google Scholar]
- 10.Audenaert A, Audenaert E. 2008. Global optimization method for combined spherical-cylindrical wrapping in musculoskeletal upper limb modelling. Comput. Methods Programs Biomed. 92, 8–19 10.1016/j.cmpb.2008.05.005 (doi:10.1016/j.cmpb.2008.05.005) [DOI] [PubMed] [Google Scholar]
- 11.Aubel A, Thalmann D. 2001. Efficient muscle shape deformation. In Deformable avatars (eds Magnenat-Thalmann N, Thalmann D.). IFIP Advances in Information and Communication Technology, no. 68, pp. 132–142 Dordrecht, The Netherland: Kluwer Academic Publishing [Google Scholar]
- 12.Lieber RL, Fridén J. 2000. Functional and clinical significance of skeletal muscle architecture. Muscle Nerve 23, 1647–1666 (doi:10.1002/1097-4598(200011)23:11<1647::AID-MUS1>3.0.CO;2-M) [DOI] [PubMed] [Google Scholar]
- 13.Ng-Thow-Hing V. 2001. Anatomically based models for physical and geometric reconstruction of animals. Toronto, Canada: University of Toronto [Google Scholar]
- 14.Blemker SS, Delp SL. 2005. Three-dimensional representation of complex muscle architectures and geometries. Ann. Biomed. Eng. 33, 661–673 10.1007/s10439-005-1433-7 (doi:10.1007/s10439-005-1433-7) [DOI] [PubMed] [Google Scholar]
- 15.Oberhofer K, Mithraratne K, Stott NS, Anderson IA. 2009. Anatomically-based musculoskeletal modeling: prediction and validation of muscle deformation during walking. Vis. Comput. 25, 843–851 10.1007/s00371-009-0314-8 (doi:10.1007/s00371-009-0314-8) [DOI] [Google Scholar]
- 16.Lu YT, Zhu HX, Richmond S, Middleton J. 2011. Modelling skeletal muscle fibre orientation arrangement. Comput. Methods Biomech. Biomed. Eng. 14, 1079–1088 10.1080/10255842.2010.509100 (doi:10.1080/10255842.2010.509100) [DOI] [PubMed] [Google Scholar]
- 17.Yang X, Zhang JJ. 2006. Automatic muscle generation for character skin deformation. Comput. Anim. Virtual Worlds 17, 293–303 10.1002/cav.133 (doi:10.1002/cav.133) [DOI] [Google Scholar]
- 18.Schneider P, Wilhelms J. 1998. Hybrid anatomically based modeling of animals. In Proc. Computer Animation 98, Philadelphia, PA, USA, 8–10 June 1998, pp. 161–169 10.1109/CA.1998.681921 (doi:10.1109/CA.1998.681921) [DOI] [Google Scholar]
- 19.Lee KS, Ashraf G. 2007. Simplified muscle dynamics for appealing real-time skin deformation. In Computer graphics and virtual reality (CGVR) (ed. Arabnia HR.), pp. 160–167 Las Vegas, Nevada: CSREA Press [Google Scholar]
- 20.Kohout J, Kellnhofer P, Martelli S. 2012. Fast deformation for modelling of musculoskeletal system. In GRAPP/IVAPP (eds Richards P, Kraus M, Laramee RS, Braz J.), pp. 16–25. Rome, Italy: SciTePress [Google Scholar]
- 21.Kohout J, Clapworthy GJ, Martelli S, Viceconti M. 2012. Muscle fibres modelling. In GRAPP/IVAPP (eds Richards P, Kraus M, Laramee RS, Braz J.), pp. 58–66. Rome, Italy: SciTePress [Google Scholar]
- 22.Testi D, Quadrani P, Viceconti M. 2010. PhysiomeSpace: digital library service for biomedical data. Phil. Trans. R. Soc. A 368, 2853–2861 10.1098/rsta.2010.0023 (doi:10.1098/rsta.2010.0023) [DOI] [PMC free article] [PubMed] [Google Scholar]
- 23.Press WH, Teukolsky SA, Vetterling WT, Flannery BP. 2007. Numerical recipes: the art of scientific computing, p. 1256, 3rd edn Cambridge, UK: Cambridge University Press [Google Scholar]
- 24.Sorkine O. 2006. Differential representations for mesh processing. Comput. Graph. Forum 25, 789–807 10.1111/j.1467-8659.2006.00999.x (doi:10.1111/j.1467-8659.2006.00999.x) [DOI] [Google Scholar]
- 25.Schroeder W, Martin K, Lorensen B. 2006. Visualization toolkit: an object-oriented approach to 3D graphics, p. 528, 4th edn New York, NY: Kitware [Google Scholar]
- 26.Horn BKP. 1987. Closed-form solution of absolute orientation using unit quaternions. J. Opt. Soc. Am. A 4, 629–642 10.1364/JOSAA.4.000629 (doi:10.1364/JOSAA.4.000629) [DOI] [Google Scholar]
- 27.Tak S, Ko HS. 2005. A physically-based motion retargeting filter. ACM Trans. Graph. 24, 98–117 10.1145/1037957.1037963 (doi:10.1145/1037957.1037963) [DOI] [Google Scholar]
- 28.Kirk AG, O'Brien JF, Forsyth DA. 2005. Skeletal parameter estimation from optical motion capture data. In Proc. IEEE Computer Society Conf. on Computer Vision and Pattern Recognition, San Diego, CA, 20–25 June 2005, vol. 2, pp. 782–788 10.1109/CVPR.2005.326 (doi:10.1109/CVPR.2005.326) [DOI] [Google Scholar]
- 29.Kellnhofer P, Kohout J. 2012. Time-convenient deformation of musculoskeletal system. In Proc. Algoritmy 2012, 19th Conf. on Scientific Computing, Vysoké Tatry–Podbanské, Slovakia, 9–14 September 2012, pp. 239–249 [Google Scholar]
- 30.Ju T, Schaefer S, Warren J. 2005. Mean value coordinates for closed triangular meshes. ACM Trans. Graph. 24, 561–566 10.1145/1073204.1073229 (doi:10.1145/1073204.1073229) [DOI] [Google Scholar]
- 31.Viceconti M, Zannoni C, Testi D, Petrone M, Perticoni S, Quadrani P, Taddei F, Imboden S, Clapworthy G. 2007. The multimod application framework: a rapid application development tool for computer aided medicine. Comput. Methods Programs Biomed. 85, 138–151 10.1016/j.cmpb.2006.09.010 (doi:10.1016/j.cmpb.2006.09.010) [DOI] [PubMed] [Google Scholar]
- 32.Richardson M. 2011. Muscle atlas of the extremities. Seattle, WA: Bare Bones Books [Google Scholar]


