Abstract
Over the years, agent-based models have been developed that combine cell division and reinforced random walks of cells on a regular lattice, reaction–diffusion equations for nutrients and growth factors; and ordinary differential equations for the subcellular networks regulating the cell cycle. When linked to a vascular layer, this multiple scale model framework has been applied to tumour growth and therapy. Here, we report on the creation of an agent-based multi-scale environment amalgamating the characteristics of these models within a Virtual Physiological Human (VPH) Exemplar Project. This project enables reuse, integration, expansion and sharing of the model and relevant data. The agent-based and reaction–diffusion parts of the multi-scale model have been implemented and are available for download as part of the latest public release of Chaste (Cancer, Heart and Soft Tissue Environment; http://www.cs.ox.ac.uk/chaste/), part of the VPH Toolkit (http://toolkit.vph-noe.eu/). The environment functionalities are verified against the original models, in addition to extra validation of all aspects of the code. In this work, we present the details of the implementation of the agent-based environment, including the system description, the conceptual model, the development of the simulation model and the processes of verification and validation of the simulation results. We explore the potential use of the environment by presenting exemplar applications of the ‘what if’ scenarios that can easily be studied in the environment. These examples relate to tumour growth, cellular competition for resources and tumour responses to hypoxia (low oxygen levels). We conclude our work by summarizing the future steps for the expansion of the current system.
Keywords: agent-based simulation, multi-scale model, cancer, lattice models, cell cycle, tumour hypoxia
1. Introduction
In this work, we introduce a virtual research environment for two-dimensional and three-dimensional in silico simulation of the dynamics of lattice-based cell populations coupled to diffusible fields such as nutrients and growth factors. Our focus is to explain in detail the steps of the simulation model development, regarding aspects such as the system description, the conceptual model, the simulation model development in Chaste [1] as well as the system verification and validation.
The main purpose of this simulation system is to facilitate biological research in testing mechanisms such as interactions between different cell types (such as proliferating normal cells and cancer cells and non-proliferative macrophages) in a nutrient and growth-factor-dependent environment. Furthermore, this simulation tool can be used to test potential new treatments for various pathologies, such as early-stage cancer.
The idea of incorporating this environment into the VPH Toolkit came from the successful development of models for cell division, birth, death and movement within a lattice in two dimensions [2] and three dimensions [3]; regulation of cell cycle and factors, such as oxygen and other nutrients [4]; tumour hypoxia and effects of hypoxia in cell cycles of tumour and normal cells [5]. These models represent the state of the art in multi-scale modelling for tumour growth and cellular hypoxia, but their original implementation does not yet meet the standards of reproducibility, reusability and interoperability that are required to enable a public release. Their implementation for the VPH Toolkit within Chaste therefore allows for the release of a reliable, reusable and expandable code.
As part of the Chaste test-driven approach to software development [1], extensive nightly and weekly tests are performed on all parts of our code, which means that functionalities are constantly being verified and should be preserved over time, allowing the generation of reproducible simulation results. Furthermore, the functionalities that we have added to Chaste are verified against the original model implementation.
The object-oriented approach adopted by Chaste facilitates the expansion of the model to include different cell populations and diffusible substances. In the future, we aim to extend this environment to a vascular tissue modelling environment (VTME), encompassing models for fluid flow in a vessel network; transport, release and uptake of diffusible substances such as oxygen; and integration of angiogenic and vasculogenic endothelial cells into the vascular network [6,7]. The work presented here, therefore, represents the first step towards a VTME.
The remainder of this paper is organized as follows. First, we introduce the cellular, subcellular and diffusible components of the multi-scale agent-based model (§2); subsequently, we introduce the conceptual model of the simulation, which defines the model scope and simplifications from the real-world biological system. In §3, we introduce the details of the model implementation as well as the verification and validation of each of the modules. Section 4 presents some applications that can be developed in the environment. Finally, in §5 we draw conclusions and present the future steps to expand our environment.
2. The multi-scale agent-based system
The system implemented comprises different elements from distinct time and length scales coupled together. The multi-scale model features include competition between cell-cycle-based cells (for example, cancer and normal cells, which can divide) and lifespan-based cells (e.g. macrophages, which can only die after a certain lifespan), cellular random walks and coupling to diffusible substances such as nutrients (e.g. via consumption and/or production by cells). Cell-cycle models and cell death (apoptosis) can be dependent on the diffusible substances (e.g. nutrients such as oxygen). The general structure of the model was therefore divided into three layers, corresponding to the diffusible nutrients, the cellular and the intracellular phenomena, as shown in the conceptual model of figure 1.
Figure 1.

The conceptual model of the multi-scale environment. There are three layers in the model: the diffusibles, the cells and the intracellular phenomena (such as the cell cycles and apoptosis).
The first layer contains the diffusible species existing within the environment. These species are the molecules that interact with cells, providing nutrition or stimulating cellular activity. One example of a diffusible, shown in figure 1, is oxygen, which directly regulates some types of cellular proliferation and death. It is well known that cells are regulated by and produce various other substances such as growth factors, cytokines and other signalling molecules. While we focus here on oxygen in the diffusible layer, the framework we describe is easily extended to include multiple diffusible species.
The cellular layer focuses on the cellular interactions and their spatial locations. For our model, three types of cells are initially considered: normal and cancer cells, which have distinct nutrient-dependent cell cycles, and macrophages, which are immunocompetent cells responsible for mounting immune responses and aiding different types of immunotherapies [8]. Normal and cancer cells compete for space and nutrients, such as oxygen. Cancer cells, however, tend to be better competitors and take over the space of normal cells with time [9]. This is explained by the fact that cancer cells are more resistant to low levels of oxygen—they enter a quiescent state and survive longer than normal cells under such an unfavourable environment. The competition between these two types of cells is determined by rules that couple the cellular and the subcellular layers of the model. Likewise, the apoptosis (programmed cellular death) of normal and cancer cells is controlled by the level of oxygen (or any other type of nutrient) inside the cell. Macrophages, on the other hand, are marked for apoptosis with age. Finally, these cells are capable of moving randomly between neighbouring lattice sites.
The intracellular layer comprises the processes that control cell division and apoptosis. For those cells that reproduce, cell division is regulated by the cell cycle, which is the set of events whereby a cell duplicates most of its components in order to replicate [2]. In this layer, the rules that determine how the cell cycle and cellular apoptosis should respond to the levels of nutrient are implemented. The details of the implementation of these layers will be further discussed in §3.
3. Development of the simulation environment
The simulation environment was implemented using a multi-method approach comprising (i) two-dimensional and three-dimensional lattices containing the objects from the system; (ii) agents, representing the cells that lie in the lattice; (iii) random-walk rules for the agents' movement; (iv) ordinary differential equations (ODEs) for subcellular networks that regulate the cell cycle; and (v) partial differential equations (PDEs) for the transport, release and uptake of diffusible species such as oxygen. Each of these elements and their integration will be described in greater detail below.
3.1. On-lattice simulations
Our on-lattice model can accommodate empty lattice sites with no cells associated. Additionally, multiple cells can be placed in each lattice site, according to a pre-defined carrying capacity. This implementation allows the simulation models to overcome some of the limitations of existing traditional cellular automaton models. First, the maximum population size is not constrained to the size of the lattice. Rather, the number of biological cells in the simulation model is controlled by the carrying capacity of each lattice site. This characteristic allows for lattice sites to correspond to a user-defined tissue volume whose natural carrying capacity will depend on that volume and on the properties of the cells under consideration (e.g. the cell volume and degree of contact inhibition). Furthermore, different carrying capacities can be defined for each lattice site, allowing, for example, for the simulation of areas in a tissue with different microenvironmental conditions (e.g. extracellular matrix density). The lattice sites do not have rules associated with them. Instead, they are just possible locations where the biological cells may lie, with the advantage that this type of lattice is capable of containing simultaneously heterogeneous populations with distinct rules associated to each type of biological cell. The concept of lattice neighbourhood is also used, in order to allow cell movement in space. Following some concepts of the traditional approach of cellular automata models, two types of neighbourhoods are considered, the von Neumann and Moore neighbourhoods [10]. These neighbourhoods are also implemented in three dimensions.
3.2. The cell population
A cell population is a computational representation of a collection of cells, for example a tissue. The cell population exhibits the following features:
— Cells are associated with only one lattice site. The implementation considers only on-lattice simulations.
— Each lattice site (and cell) has a neighbourhood associated with it.
— Lattice sites may have no cell associated with them.
— Cells are added (cellular birth) and removed (cellular death) from the lattice during the course of a simulation.
— Cells move randomly in the lattice and the probabilities of movements can be specified to include certain cell behaviours, such as chemotaxis.
— Different cell types (e.g. normal cells, tumour cells, macrophages) can occupy the same lattice site simultaneously.
— There can be more than one cell per lattice site. Each lattice site has a carrying capacity that determines the maximum number of cells which can be located at that site.
These features will be described in more detail in the sections below.
3.2.1. The cell agents
There are two main types of agents in the system: those that have a cell cycle (figure 2a) and those that die with age (figure 2b). Here, we illustrate these concepts using state charts from the unified modelling language (UML), where it is possible to define and visualize the agents' states (round squares), transitions between the states (arrows), events that trigger transitions, timing and agent actions.
Figure 2.
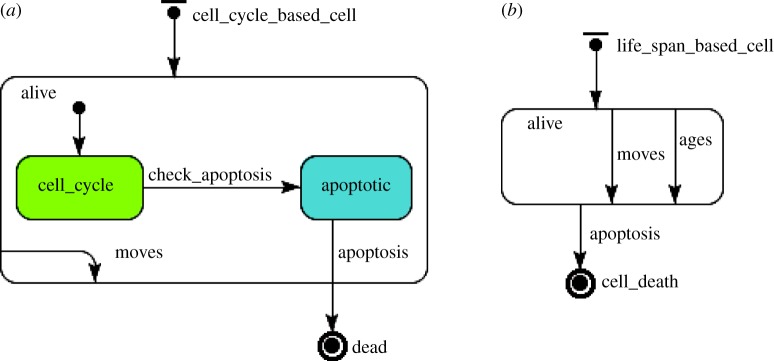
(a) Cycle-based and (b) lifespan-based cells state charts.
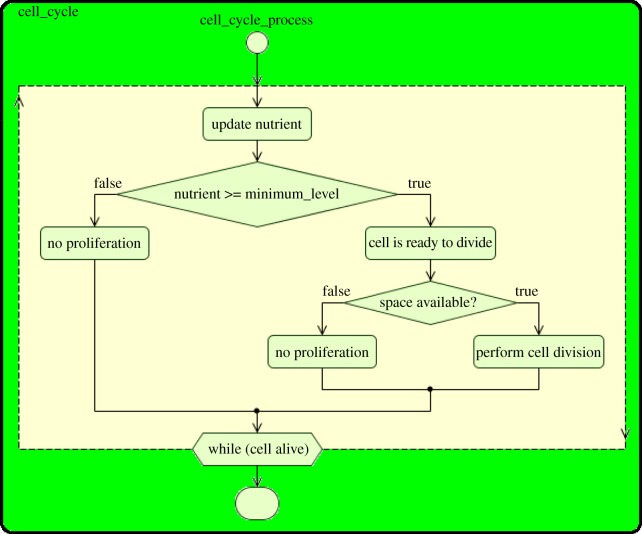
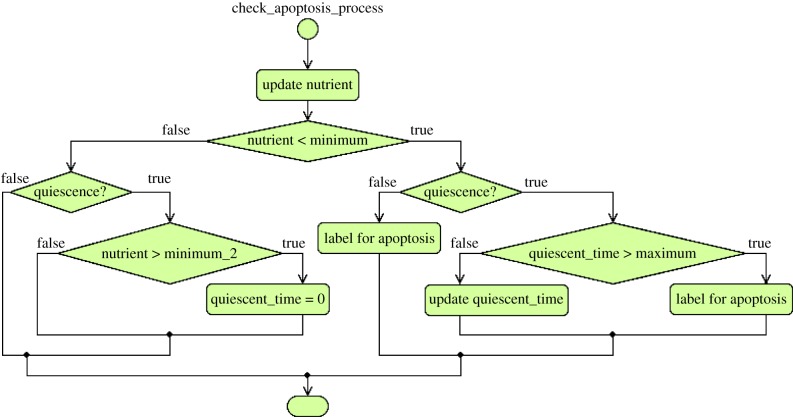
Figure 2a introduces the state chart for cell-cycle-based agents. Normal and cancer cells belong to this class of agents. In the figure, the cycle-based cell assumes two main states: alive or dead, which is the final state where the cell is removed from the system. When the cell is alive, it moves randomly in the lattice. This cell movement is dictated by the transition move, which occurs probabilistically. In addition, when the cell is alive, it enters its nutrient-dependent cell-cycle state for division and, if it runs low of nutrients, it is considered to enter an apoptotic state that precedes its death. The general action chart for the cell cycle is illustrated in figure 3. As shown in the state chart of figure 2a, the cell cycle is a cyclic procedure that occurs until the cell is labelled for apoptosis. Once the cell is marked for apoptosis, the conditional transition check_apoptosis is triggered and the cell assumes the apoptotic state. The general apoptosis action chart, which determines when low nutrient causes a cell to be labelled for apoptosis, is presented in figure 4. Specific processes of cellular death for normal, cancer cells and macrophages are explained in §3.6.
Figure 3.
Cell-cycle action chart. (Online version in colour.)
Figure 4.
Cell apoptosis action chart. In the figure, the variable quiescent_time stores the amount of time a cancer cell is quiescent. For our experiments, the critical value of quiescent time for a cancer cell to die is 4000 h. The actions in this chart are taken when the transition check_apoptosis (figure 2a) is triggered. (Online version in colour.)
As described in §2, some types of cells, such as cancer cells, can enter a quiescent state, which means that they are more resistant to the lack of nutrients (e.g. oxygen) [9]. This cell quiescence is established when the conditional transition check_apoptosis is updated. Further details on the cell cycle for cancer and normal cells are given in §3.4.
Figure 2b presents the state chart for cells that die after a certain lifespan, such as macrophages. Similarly to the other cell types, these cells are either dead or alive. While they are alive, they move and age. They die after age reaches a certain threshold.
Although for our in silico experiments, we considered only three types of cell with the main nutrient being oxygen, our environment within Chaste is easily extensible to consider other types of cells, diffusion rules and cell-cycle models.
3.2.2. Adding daughter cells to the population
When the subcellular (cell cycle) model indicates that a cell is ready to divide, a check is made whether there is space available to place a daughter cell in a neighbouring lattice site. If space is available, a new cell (the daughter cell, which inherits its properties from the parent cell) is added to a randomly selected available site in the parent cell's neighbourhood. If there is no space available, the daughter cell is not created and the parent cell cycle is reset.
The pseudo-code for adding new cells to the population is shown in algorithm 1.
Algorithm 1. Adding cells to the population pseudo-code.
input : The cell to divide (parent cell)
output: The new cell created
Get location of the lattice site corresponding to the parent cell;
Get neighbouring locations of the parent cell;
found_available_neighbour ← false;
foreach n in the neighbourhood do
// n is selected randomly from the set of neighbours
if n is available then
found_available_neighbour ← true;
// Stop searching
break for;
end
end
if found_available_neighbour then
create a new cell;
place the new cell in n location;
else
reset parent cell cycle;
end
The verification and validation of this module will be discussed in §3.5, where we introduce the methods used for cellular proliferation.
3.3. Cellular motility
Cells migrate along the lattice randomly to available sites belonging to their neighbourhood. The probability of a cell at site x moving to site y in its neighbourhood in a simulation time step Δt is given by
 |
3.1 |
where N(x,t) is the number of cells at site x, D is the random cell motility coefficient, Nm is the carrying capacity for movement of the cell type attempting to move and dx,y is the distance between sites x and y. Thus, if the site y is occupied by a number of cells equal to its carrying capacity, then the probability to move to this site is set to zero. We remark that equation (3.1) is equivalent to the form used in Owen et al. [8], but without chemotaxis. Future extensions to the Chaste implementation will include chemotaxis.
3.3.1. Random movement verification
The verification of the random movement implementation asserts whether diffusive movement is accurately implemented. Two tests were defined using the Moore neighbourhood to determine the cells' moving directions. The first test checks that the probability calculation is returning the correct value. In the second test, we checked that movement, in the eight directions corresponding to the Moore neighbourhood, occurs with the frequency expected (results not shown).
3.3.2. Random movement validation
Results for the movement of a single cell are validated against those from the original implementation established in Owen et al. [8]. In order to validate the results, 100 realizations of both implementations were run and the results were collected. The parameters used for the simulations are presented in table 1 and the results are shown in figure 5.
Table 1.
Parameters for the first experiment: single cell random movement.
| parameter | value |
|---|---|
| simulation end time | 480 h |
| time step length Δt | 0.25 min |
| cell random motility coefficient D | 0.3 × 10⁻⁹ cm2 min−1 |
| lattice size Δx | 5×10⁻⁴ cm |
Figure 5.
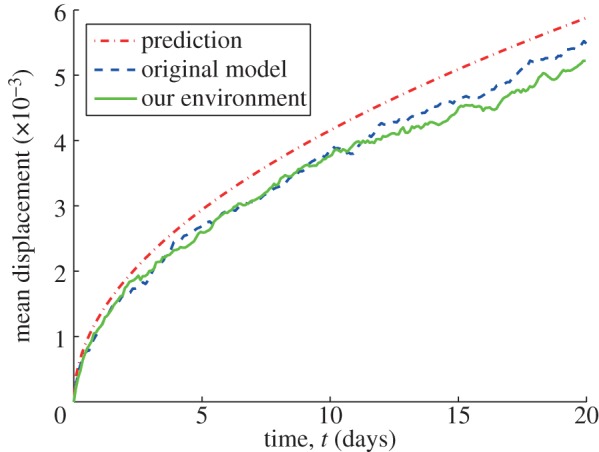
Comparison of results for single normal cell random movement (Moore neighbourhood).
Figure 5 shows the mean cell displacement against time for the original model implementation (blue line) and our implementation in Chaste (green line). Furthermore, the red line shows the mathematical prediction of the mean displacement, calculated as
The outcomes are very close and follow the same pattern, which suggests that both implementations have equivalent outputs. The differences observed in the graphs are because of the different random numbers used for each implementation.
3.4. Cell-cycle model
In this section, we expand the cell_cycle_process action chart from figure 3 to the specific types of cells implemented (normal and cancer cells) and the diffusible substance considered (oxygen). Although our implementation in Chaste permits the expansion of the system to incorporate different types of cell cycles, currently we adopt an oxygen-dependent ODE-based cell-cycle model, proposed by Owen et al. [8] as a simplification of the model of Alarcón et al. [5]. This cell cycle is a simple phase model given by
| 3.2 |
where  represents the phase of the cell cycle. The oxygen concentration at the cell's current location is given by C(x,t). Tmin is the minimum period of the cell cycle and Cϕ is the oxygen concentration at which the speed is half maximal.
Since ϕ = 0 represents the start of the cycle, and ϕ = 1 is the completion of one cycle, when ϕ reaches 1, it is then reset back to zero. As shown in equation (3.2), the speed of progress through the cell cycle depends on the oxygen concentration. Table 2 shows the default parameter values used for normal cells and cancer cells in our simulations.
Table 2.
Parameters used for the cell-cycle model, equation (3.2). These parameters were obtained from Owen et al. [8]. Under these parameter values, a typical cell-cycle time would be approximately 1 day for cancer cells and 2 days for normal cells.
| parameter | normal cell | cancer cell |
|---|---|---|
| Tmin | 3000 min | 1600 min |
| Cϕ | 3 mm Hg | 1.4 mm Hg |
Over the course of the simulation, the above ODE is solved over each time step. If ϕ = 1 at any stage, the cell is assumed to be ready to divide. In this case, the parent cell divides forming daughter cells, only if there is sufficient room to place the newly formed daughter cells. ϕ is then reset to zero and the cycle is repeated. ϕ is also reset when there is no space to divide.
In the case of cancer cells, if the oxygen concentration at the cell's current location drops below a certain threshold, the cell is labelled to be quiescent. When in quiescent state, cancer cells do not progress through the cell cycle (i.e. the ODEs are not solved). When the oxygen concentration rises above another minimum threshold value, the cells stop being quiescent and the cell cycle progresses again.
An equivalent cell-cycle model has also been implemented and tested, which exploits the fact that an explicit solution to equation (3.2) is available under the assumption (used throughout) that the diffusible variables are constant over each simulation time step Δt. In this model, the phase of the cell cycle is updated according to
| 3.3 |
where t is the current time.
As in the ODE model, ϕ = 1 marks the completion of one cycle. The cell is ready to divide into daughter cells provided that there is sufficient room for the newly formed daughter cells. The value of ϕ is then reset back to zero and the cycle repeats. For quiescent cancer cells, the value of ϕ remains constant throughout the quiescent phase.
Macrophages do not have a cell cycle. Instead, they have a fixed lifespan, after which they die (§3.6.3). Biologically, macrophages typically do not proliferate and they enter tissues in vivo from the vasculature and/or would be introduced in an in vitro situation. Therefore, there is no need for this cell type to divide. As the vascular parts are still to be added to our environment, for now the macrophages, as well as the other cells, are created and placed in the lattice in the start of the simulation.
3.5. Cellular proliferation
As mentioned in the previous section, the proliferation of normal cells and cancer cells is controlled by a cell-cycle model. Our cell cycle demands a minimum level of oxygen, and proliferation occurs if there is available space within a certain region. Results for cellular proliferation are validated against those from the original implementation [8]. The growth curves for both implementations are similar (see figure 6).
Figure 6.
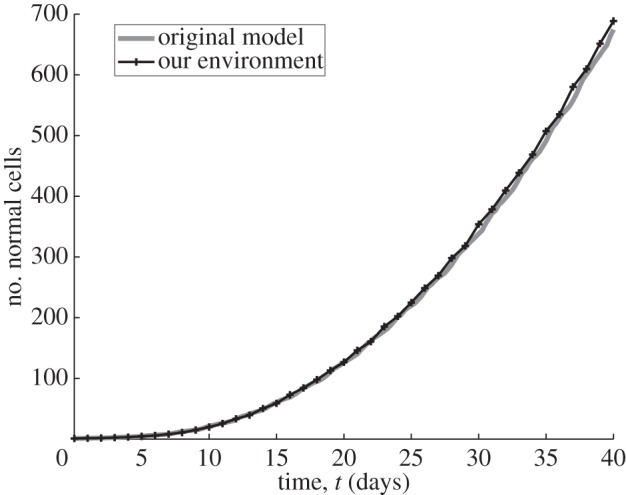
Normal cell proliferation for 100 realizations, in a two-dimensional lattice of size [100 × 100], with carrying capacity per lattice site equal to 1. The simulation was run for a period equivalent to 960 h and the cells' random motility coefficient D was set to zero and dt= 0.5 h. The simulation starts with a single cell placed in the middle of the lattice. The graphs show the mean value of 100 realizations. The parameters for the cell cycle are those defined in table 1 for normal cells. The oxygen concentration is fixed at 30 mm Hg.
3.6. Cell death
In this section, we explain how the action chart for cell apoptosis (figure 4) was implemented in our agent-based environment. The death of normal and cancer cells depends on how they respond to hypoxia. The cell cycles of normal and cancer cells exhibit remarkable differences [4]: normal cells undergo apoptosis in response to persistent periods of hypoxia, whereas cancer cells appear to be more resistant to the lack of oxygen. This resistance is partially owing to their ability to enter a quiescent state in response to severe hypoxic stress [11]. In cases where the oxygen levels remain low, the cancer cells will also eventually die. The rules associated with the death of normal and cancer cells are based on characteristics of cellular responses to hypoxia, as outlined in the sections below.
3.6.1. Normal cell death
In the current implementation, following Owen et al. [7], a normal cell is marked for apoptosis if the oxygen concentration within its neighbourhood falls below a prescribed threshold. This threshold increases when a normal cell is surrounded predominantly by cancer cells, reflecting differences in the microenvironment of normal tissue and tumours. The threshold for apoptosis is defined in algorithm 2, where the ratio of normal cells to total cells is calculated via the pseudo-code outlined in algorithm 3.
Algorithm 2. Normal cell threshold calculation, where ρ is a parameter that characterizes the cell ratio at which a tumour microenvironment becomes hostile to normal cells. In our examples, we set ρ =0.75, the lower value was set to 1.5 mm Hg and the higher value was set to the maximum integer value defined in Chaste.
input: Cell ratio
if ratio > ρ then
threshold ← lower value;
end
else
threshold ← higher value;
end
Algorithm 3. Calculation of the ratio of normal cells to total cells, following Owen et al. [7].
input : Current cell
output: ratio
Get location of the cell;
if Location (lattice site) has more than one cell then
normal_count ← number of normal cells; cancer_count ← number of cancer cells;
end
else
Get the set of the cell's neighbours;
Iterate over the set of neighbouring sites to count the total number of normal cells and cancer cells surrounding the target cell;
end
ratio ← normal_count/(normal_count + cancer_count)
3.6.2. Cancer cell death
Cancer cells die if they remain quiescent for a time that exceeds a predefined critical value. As mentioned previously, this time is determined in the cell-cycle model. At each time step, the interval of quiescence is updated or reset, depending on the local oxygen concentration. If the time exceeds the critical value, the cell is labelled for apoptosis.
3.6.3. Macrophage death
Macrophages are assumed to die after a certain period of time and to have a mean lifetime of 90 days. When these cells are created, they are assigned a birth time equal to the simulation time. The age of the macrophage, therefore, is determined by the current simulation time minus the birth time. If a macrophage has an age greater than the mean macrophage life span, then it is labelled as apoptotic. In our environment, macrophages are created at the beginning of the simulation and do not reproduce.
3.6.4. Cell killer
The elimination of cells is performed by a cell killer method, which identifies those cells from the population that should be labelled for death, following the rules (introduced above) for each cell type. The pseudo-code for this method is shown in algorithm 4.
Algorithm 4. Pseudo-code for the cell killer.
input : The cell population
foreach cell c in the population do
if c is cell cycle based then
Determine the current nutrient (oxygen) level;
if c is a normal cell then
ratio ← RatioCalculation(c);
threshold_oxygen←NormalCellThresholdCalculation (ratio);
if oxygen level of cell c < threshold_oxygen then
Kill c;
end
end
else
if c is a cancer cell then
if oxygen level of cell c < threshold_quiescence then
Update quiescent_time;
if c is quiescent for a long time then
Kill c;
end
end
else
if oxygen level of cell c > threshold_leave_quiescence
then
Leave quiescence;
Reset quiescent_time;
end
end
end
end
end
else
if c is lifespan based (macrophage) then
if defined life span is over then
Kill c;
end
end
end
end
3.6.5. Cell killer verification
We verify that the cell killer method has been implemented correctly by considering the following scenarios:
- Normal cell death verification:
- No cancer cells in the cell's neighbourhood. This scenario describes a normal cell with no cancer cells in its neighbourhood, so that the cell ratio is equal to 1 and the threshold oxygen concentration for apoptosis will be set to the lower value.
- No death, oxygen concentration above the lower threshold. We set the oxygen concentration at the cell's location to a value higher than the lower hypoxic threshold and hence the cell should not die.
- Death, oxygen concentration below the lower threshold. In this case, the rules dictate that the cell should die.
- Death with cancer cells in the neighbourhood: A normal cell is placed on the lattice and surrounded by cancer cells in such a way that the cell ratio, as calculated in algorithm 3, falls below the parameter ρ. The threshold oxygen concentration for apoptosis is therefore set to the higher value.
- No death, oxygen concentration above the upper threshold. The oxygen concentration at the cell's location is set to exceed the upper threshold and hence the cell will not die.
- Death—oxygen concentration below the upper threshold. The verification process asserts that the cell dies in this case.
Cancer cell death: Verification for cancer cells asserts that they die if they have been in a quiescent state for a prolonged period of time. For this purpose, we set the oxygen concentration, at the cell's location, such that the cell is labelled to be in the quiescent state. The amount of time that the cell has been quiescent is updated at each time step, as mentioned in §3.6.2. We continue to increment the time step in the simulation until the amount of time the cell has been quiescent exceeds the critical value. Also, at every time step we assert that the cell does not progress through the cell cycle, that it continues to remain quiescent and that it is not labelled apoptotic. Once the cell has been quiescent for longer than the critical value, the cell should be labelled for apoptosis and thus be killed.
3.7. Diffusibles
The distribution of diffusibles such as oxygen is modelled using reaction–diffusion equations, which are assumed to be in quasi-steady state. Hence, the governing PDEs are of the form
| 3.4 |
where Du is the diffusion coefficient of diffusible U,  is the cell-dependent production/removal rate and δu is the U decay rate. For all diffusible species, we impose zero flux boundary conditions.
The PDE for each diffusible is updated at each time step. The solution at each site is then used to update the cell-cycle phase, and/or to determine whether a cell should undergo apoptosis.
3.8. Oxygen, C(x,t)
The environment acts as a source of oxygen and cells act as the spatially distributed sinks, as they consume oxygen. If the rate of oxygen consumption by a cell at site x is given by  , then we get
| 3.5 |
and δc = 0.
4. Examples
In this section, we present examples of in silico experiments relating to cellular proliferation and nutrient consumption that can be performed in our environment.
4.1. Oxygen-dependent cell proliferation
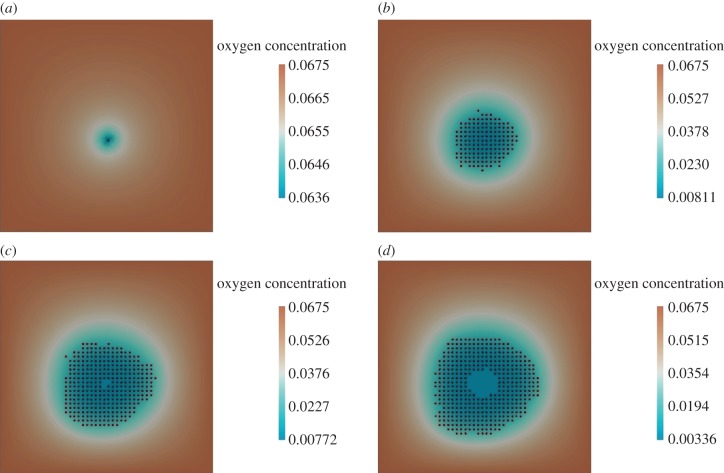
We illustrate cellular proliferation by inserting a single tumour cell in an environment with a square grid of size [50 × 50] (see figure 7a). The cells are set to consume oxygen at the rate k = 0.1 h−1. The oxygen diffusion coefficient was set to Dc = 1 (Δx)2 h−1. In our examples, (Δx)2 was set to 1. The PDE used to determine the oxygen distribution is given by equation (4.1) and Dirichlet boundary conditions (C = 30 mm Hg) were imposed on all the boundaries. In more detail, we have
| 4.1 |
where
| 4.2 |
Figure 7.
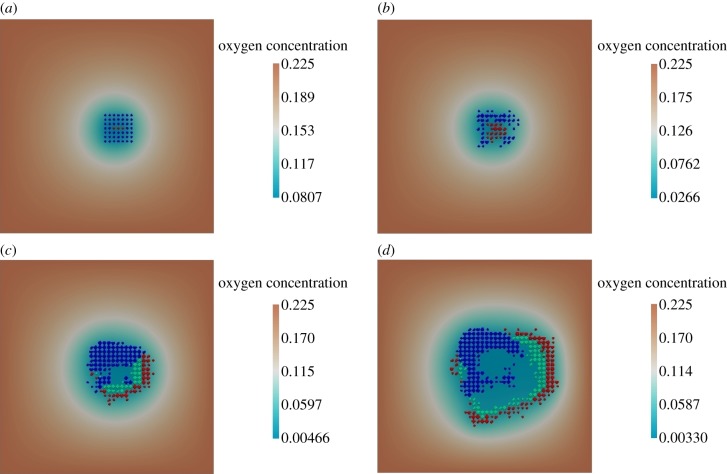
Oxygen-based cell proliferation. (a) Initial stage: time = 0 h, (b) cells begin proliferation: time = 600 h, (c) death of cells in the hypoxic region: time = 870 h and (d) further cell proliferation and growing hypoxic region: time = 1000 h. In figures 7–10, the oxygen concentration is given by its dimensionless values, where C (dimensionless) = C (in mm Hg) multiplied by 0.00225.
Simulation results showing the evolution of the system over 1000 h are presented in figure 7. We observe the initial proliferation of the cells (figure 7b), which consume the oxygen available at the centre of the tumour. This consumption generates hypoxic areas and consequent cellular death owing to lack of oxygen (figure 7c). As there is still space and oxygen towards the edges of the lattice, cells there continue to proliferate and the tumour increases in size (figure 7d). With the increase of the number of cells and oxygen consumption rate, the number of cells towards the centre of the tumour undergoing cell death because of hypoxia also increases (see figure 7d).
4.2. Oxygen-dependent cell proliferation with alternative boundary conditions
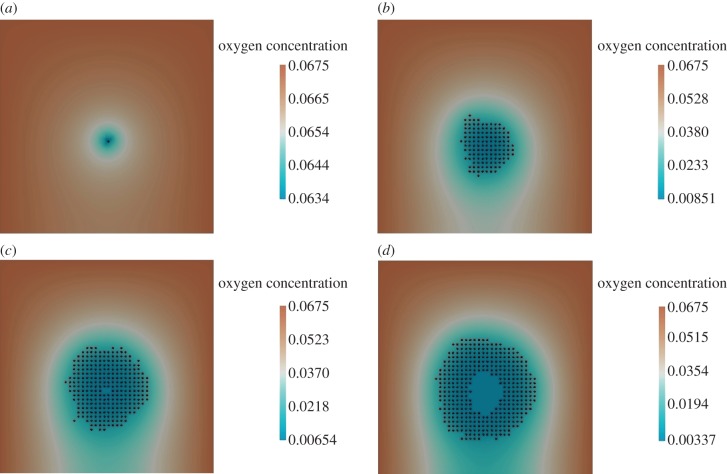
We now consider the case identical to that in the previous section, except that we impose a zero flux boundary condition on the bottom boundary.
The simulation was run for a period equivalent to 1000 h. The results for this simulation are presented in figure 8. We observe that the hypoxia region forms in the centre as cells consume oxygen (figure 8d). The oxygen concentration is also low near the bottom boundary, because of the absence of any source of oxygen there (figure 8c). The cells continue to proliferate near the top, left and the right boundaries, where C = 30 mm Hg (see figure 8a–d).
Figure 8.
Oxygen-dependent normal cell proliferation with alternative boundary conditions. (a) Initial stage: time = 0 h, (b) cells begin proliferation: time = 600 h, (c) death of cells in the hypoxic region: time = 820 h and (d) further cell proliferation and growing hypoxic region: time = 1000 h.
4.3. Multiple cell types
We now consider, different types of cells, i.e. normal cells and cancer cells. In this example, the oxygen diffusion coefficient was set to 1 (Δx)2 h−1 and each lattice site carrying capacity was set to 4. The lattice dimensions were set to [50 × 50]. The Dirichlet boundary condition (C = 100 mm Hg) was imposed on all boundaries. The oxygen uptake rate for both types of cells was set to k = 0.1 h−1. The simulation was run for a period equivalent to 500 h. Results are shown in figure 9a–d. Figure 9a shows the initial disposition of the cells in the system—there is a cluster of normal cells with two cancer cells inside it. As simulation progresses, normal cells start replicating and moving along the lattice (figure 9b). Tumour cells also start replicating and take over the space originally occupied by normal cells (figure 9c). There is also an increase in the hypoxic areas, owing to higher rates of oxygen consumption (figure 9d).
Figure 9.
Evolution of a cluster containing multiple cell types. In the figure, the blue cells are normal cells, red cells are tumour while the remaining ones (light green) are the quiescent tumour cells. (a) Initial stage: time = 0 h, (b) cells begin proliferation: time = 100 h, (c) death of cells in the hypoxic region: time = 300 h and (d) further cell proliferation and growing hypoxic region: time = 500 h.
4.4. Cell proliferation in three dimensions
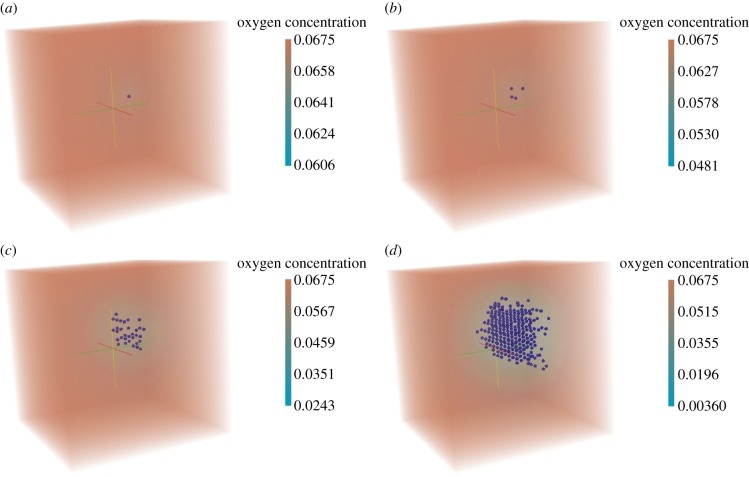
In this section, we illustrate cell proliferation in three dimensions. For this purpose, we consider an initial configuration with one tumour cell in a cube of size [20 × 20 × 20] (figure 10a). A cell consumes oxygen at the rate k = 1.0 h−1. The oxygen diffusion coefficient Dc = 1 (Δx)2 h−1. The Dirichlet boundary condition (C = 30 mm Hg) is imposed on all boundaries. The simulation was run for a period equivalent to 500 h. The results for this simulation are presented in figure 10. Similar to the two-dimensional example described in §4.1, we observe the initial cell proliferation (figure 10b), which consumes the oxygen at the centre of the tumour. This consumption generates hypoxic areas and consequent cellular death owing to lack of oxygen (figure 10d).
Figure 10.
Cell proliferation in three dimensions. (a) Initial stage: time = 0 h, (b) cells begin proliferation: time = 100 h, (c) further cell proliferation: time = 300 h and (d) further cell proliferation and growing hypoxic region: time = 500 h.
5. Conclusions
We have introduced an open-source, extensible, agent-based virtual research environment for two- and three-dimensional in silico simulation of the dynamics of cell populations and their responses to nutrient shortage. Our environment was developed within Chaste [1], as part of the VPH Toolkit. The system development was based on models representing the state-of-the-art multi-scale models of cellular proliferation and its response to nutrient shortage. The simulation environment was implemented using a multi-method approach comprising (i) two- and three-dimensional lattices containing the cells and molecules from the system; (ii) agents, representing the biological cells that lie in the lattice; (iii) diffusion rules for the agents' motility; (iv) ODEs for subcellular networks that regulate the cell cycle; and (v) PDEs for the transport, release and uptake of nutrients. Following Chaste philosophy, nightly and weekly testing have extensively been performed on our code in order to verify and preserve the functionalities implemented. Further verification and validation were performed against the original multi-scale models in which our environment is based, ensuring the reproducibility of the simulation results.
In the released implementation, the examples regarding cellular phenotypic changes (including proliferation, migration and death) depend solely on oxygen. In our platform, however, it is easy to extend this implementation to other factors. In the next release, we intend to add dependence on other factors such as vascular endothelial growth factor. Furthermore, all parameters set for the experiments, such as the diffusion coefficient, oxygen uptake rate, numbers of cells in the population, lattice size, etc., can be easily modified in the environment to suit other simulation scenarios.
Our environment also presents other limitations. For example, one could argue that the choice of a cell neighbourhood could be implemented differently to better suit cases where there are multiple cells per lattice site. Further, the calculation of a dynamic threshold for determining cell death could be replaced by a static threshold. These limitations, however, were inherited from the previously published models that the environment was based on.
In the future, we will extend our environment to include a vascular layer. We aim to develop a VTME for curated and sustainable multi-scale models to investigate the complex interplay between subcellular signalling (e.g. the cell cycle, responses to hypoxia), growth factor and nutrient distributions and vascular dynamics at the network level.
Acknowledgements
The research leading to these results has received funding from the European Community's Seventh Framework Programme (FP7/2007-2013) under the project ‘Virtual Physiological Human Network of Excellence’, grant agreement no. 223920. This work was also supported in part by award no. KUK-013-04, made by the King Abdullah University of Science and Technology (KAUST).
References
- 1.Pitt-Francis J, et al. 2009. Chaste: A test-driven approach to software development for biological modelling. Comput. Phys. Commun. 180, 2452–2471 10.1016/j.CPC.2009.07.019 (doi:10.1016/j.CPC.2009.07.019) [DOI] [Google Scholar]
- 2.Alarcón T, Byrne HM, Maini PK. 2005. A multiple scale model for tumor growth. Multiscale Model. Simul. 3, 440–475 10.1137/040603760 (doi:10.1137/040603760) [DOI] [Google Scholar]
- 3.Perfahl H, et al. 2011. Multiscale modelling of vascular tumour growth in 3d: the roles of domain size and boundary conditions. PLoS ONE 6, e14790. 10.1371/journal.pone.0014790 (doi:10.1371/journal.pone.0014790) [DOI] [PMC free article] [PubMed] [Google Scholar]
- 4.Alarcón T, Byrne HM, Maini PK. 2004. Towards whole-organ modelling of tumour growth. Progr. Biophys. Mol. Biol. 85, 451–472 10.1016/j.pbiomolbio.2004.02.004 (doi:10.1016/j.pbiomolbio.2004.02.004) [DOI] [PubMed] [Google Scholar]
- 5.Alarćon T, Byrne HM, Maini PK. 2004. A mathematical model of the effects of hypoxia on the cell-cycle of normal and cancer cells. J. Theor. Biol. 229, 395–411 10.1016/j.jtbi.2004.04.016 (doi:10.1016/j.jtbi.2004.04.016) [DOI] [PubMed] [Google Scholar]
- 6.Alarcón T, Byrne HM, Maini PK. 2003. A cellular automaton model for tumour growth in inhomogeneous environment. J. Theor. Biol. 225, 257–274 10.1016/S0022-5193(03)00244-3 (doi:10.1016/S0022-5193(03)00244-3) [DOI] [PubMed] [Google Scholar]
- 7.Owen MR, Alarcón T, Maini PK, Byrne HM. 2009. Angiogenesis and vascular remodelling in normal and cancerous tissues. J. Math. Biol. 58, 689–721 10.1007/s00285-008-0213-z (doi:10.1007/s00285-008-0213-z) [DOI] [PubMed] [Google Scholar]
- 8.Owen MR, Stamper IJ, Muthana M, Richardson GW, Dobson J, Lewis CE, Byrne HM. 2011. Mathematical modeling predicts synergistic antitumor effects of combining a macrophage-based, hypoxia-targeted gene therapy with chemotherapy. Cancer Res. 71, 2826–2837 10.1158/0008-5472.CAN-10-2834 (doi:10.1158/0008-5472.CAN-10-2834) [DOI] [PMC free article] [PubMed] [Google Scholar]
- 9.Alarcón T, Owen MR, Byrne HM, Maini PK. 2006. Multiscale modelling of tumour growth and therapy: the influence of vessel normalisation on chemotherapy. Comp. Math. Meth. Med. 7, 85–119 10.1080/10273660600968994 (doi:10.1080/10273660600968994) [DOI] [Google Scholar]
- 10.Wolfram S. 1983. Statistical mechanics of cellular automata. Rev. Mod. Phys. 5, 601–644 10.1103/RevModPhys.55.601 (doi:10.1103/RevModPhys.55.601) [DOI] [Google Scholar]
- 11.Royds JA, Dower SK, Qwarnstrom EE, Lewis CE. 1998. Response of tumour cells to hypoxia: role of p53 and nfkb. Br. Med. J. 51, 55. [DOI] [PMC free article] [PubMed] [Google Scholar]


