

Abstract
Dysfunctional insulin secretion from pancreatic β-cells plays a major role in the development of diabetes. The intravenous glucose tolerance test (IVGTT) is a widely used clinical test to assess β-cell function. The analysis of IVGTT data is conveniently performed using mathematical models, which need to be fairly simple to enable parameter identifiability (minimal models), but should at the same time have sound biological foundation at the cellular level. Using mathematical analysis and model reduction, we show here that our recent mathematical model of insulin secretory granule dynamics in β-cells provides mechanistic underpinning for our minimal model of pancreatic insulin secretion during an IVGTT.
Keywords: β-cell function, C-peptide secretion, mathematical models, secretory granules
1. Introduction
The glucose-lowering hormone insulin is secreted from pancreatic β-cells in response to elevated glucose levels. It is now widely accepted that insufficient insulin secretion plays a major role in the pathogenesis of the metabolic disease diabetes [1], characterized by elevated plasma glucose levels, which lead to severe complications.
The intravenous glucose tolerance test (IVGTT) is a commonly used clinical approach to study β-cell function. The technique consists of the injection of a glucose bolus and frequent sampling of plasma glucose and insulin or C-peptide concentrations. Often, the acute insulin response (AIR) calculated as the area under the insulin curve during the first 10 min after the glucose bolus is taken as a measure of β-cell function [2], but the AIR does also reflect hepatic extraction of insulin. C-peptide is secreted equimolarly with insulin, and has the benefit that in contrast to insulin it is not cleared in the liver, and thus C-peptide data directly reflect secretion from β-cells, whereas insulin samples only carry information of the combination of secretion and hepatic extraction.
Minimal models are useful tools for the study of IVGTT data by estimating parameters from model fitting to the observed data [3–5], and can provide a fuller picture of β-cell function than the AIR index, in particular when based on C-peptide measurements [5,6]. These models must be fairly simple to allow parameter identification, but should at the same time reflect truthfully the underlying biology down to the cellular events underlying insulin secretion. That is, the models should be minimal in the sense that further reduction would make the model non-physiological and/or prevent an accurate description of the data.
One way to make the coupling between events at different physiological levels consists of the use of multiscale modelling. We have previously used [7] such an approach to get insight into the mechanistic interpretation of parameters in models of insulin secretion during the oral glucose tolerance test (OGTT) [8–11] and in a minimal oral model [12] of glucagon-like peptide 1 action on secretion [13].
For this purpose, appropriate cellular models built from a mechanistic description of well-defined subcellular events must be analysed and simplified. Inspired by the earlier phenomenological model by Grodsky [14], we developed a mathematical model of insulin granule dynamics that incorporated cell-to-cell heterogeneity in the glucose threshold for cell activation and secretion [15]. By analysing this model with a multiscale approach, we showed that the cell-activation threshold distribution underlies the fact that the pancreas senses not only the glucose concentration but also its rate of change, so-called derivative control in OGTT secretion models [7]. In addition, our mechanistic model was recently suggested as the core of a bio-inspired artificial pancreas [16], further underlining the need for a thorough multiscale understanding of the cellular model.
Here, we follow the multiscale strategy to investigate how the various dynamical steps of our mechanistic model [15] relate to the minimal model description of IVGTT insulin secretion [5]. We find that the IVGTT model can be derived from the cellular model, and in particular that derivative control is negligible during an IVGTT. Our work has some similarities to previous studies [3,17] that used the early phenomenological model by Grodsky [14] to investigate IVGTT secretion models, but with the advantage that our mechanistic model [15] is based on experimental data establishing the activation threshold distribution at the cellular level [18].
2. Minimal modelling
The minimal model of insulin secretion during an IVGTT proposed by Toffolo et al. [5] describes the dynamics of a pool of releasable insulin (X) refilled by a delayed process (Y) in response to a given glucose profile (G) as follows:
| 2.1a |
| 2.1b |
where secretion occurs with rate
| 2.2 |
Here, m is the rate constant of secretion, α determines the delay in Y, β sets the slope of the glucose-dependence of Y, h is the corresponding off-set below which only basal secretion is active, and SRb is the basal rate of secretion, assumed to be glucose-independent.
3. Cellular modelling
The mechanistic model [15] describes the dynamics of granule pools in a heterogeneous β-cell population as outlined in figure 1. Granules are assumed to be mobilized to a pool of granules docked to the plasma membrane (D) from which they become primed and enter a readily releasable pool (RRP). (Note that the pool D corresponds to the pool denoted ‘intermediate pool’ in the original publication [15].) In response to calcium influx the RRP granules undergo exocytosis, i.e. the granule and cell membrane fuse, and subsequently release insulin. Based on Ca2+ imaging results [18], we assumed that cells activate at different glucose concentrations. Above their respective thresholds the Ca2+ concentration [19], and therefore also the rate of granule exocytosis and insulin release, is assumed not to depend on the glucose concentration. Hence, the total pancreatic RRP is heterogeneous in the sense that only the granules residing in active cells will fuse and release insulin (filled circles in figure 1). We denote this fraction of the total RRP by H.
Figure 1.
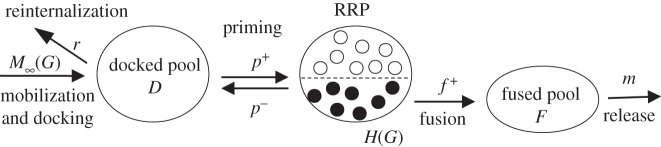
Overview of the mechanistic model. See main text for details.
In contrast to the original model formulation [15], we assume that mobilization occurs with no delay with rate
| 3.1 |
The delay in mobilization is not needed to reproduce the characteristic biphasic profile in response to a step in glucose concentration. Indeed, in Pedersen et al. [15], we had to use a very short delay in M in order to reproduce the data from O'Connor et al. [20], further justifying the assumption of removing the delay in M.
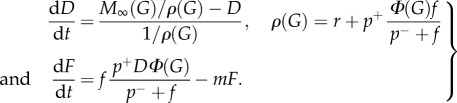
The docked pool develops according to
| 3.2 |
where r is the rate constant for reinternalization, p+ the rate constant for priming and p− the corresponding constant describing ‘unpriming’, i.e. a process where granules lose that release capacity.
The granules in the entire RRP and in the part of RRP in active cells (H) follow [7]
| 3.3 |
and
| 3.4 |
where f is the fusion rate, h = ∂H/∂G and Φ(G) describes the fraction of cells with activity threshold below G. This fraction is given by Φ(G) = 0 for G below the basal glucose concentration Gb, and [7]
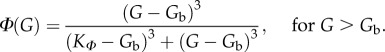 |
3.5 |
The pool of fused granules F follows
| 3.6 |
where m is the rate constant of insulin release. Finally, the secretion rate is given by
| 3.7 |
4. Reconciling models on different scales
We are interested in comparing the two expressions for the secretion rate, equation (2.2) for the minimal model and equation (3.7) for the mechanistic model during an IVGTT. Inspection readily reveals that we need to relate F to X. In the following, this coupling is done by approximating F by a variable  with kinetics similar to that of X.
First we note that the last term in equation (3.4) describes derivative control, i.e. secretion does not only depend on the glucose level, but also on its rate of change. This fact is important during oral and meal tolerance tests and included in several oral minimal secretion models [8,10]. However, during an IVGTT the glucose concentration decreases monotonically (figure 2a) in contrast to the rising glucose level during the first phase of an oral test.
Figure 2.
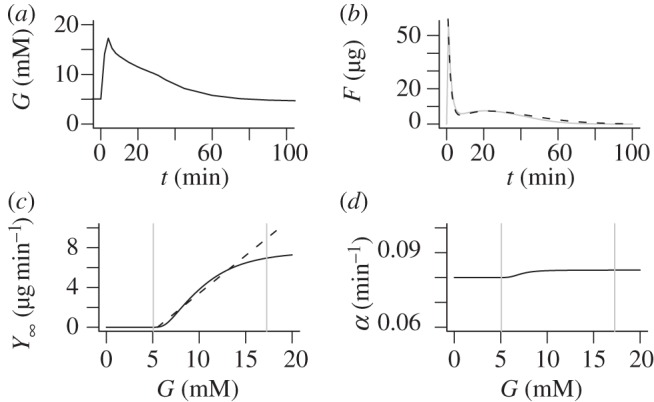
(a) Mean average plasma glucose profile in a cohort of 204 healthy subjects during an IVGTT. (b) The fused pool F as a function of time (full grey curve) and the approximation  (dashed black curve) in response to the glucose profile in (a). Parameters are r = 0.08 min−1, p+ = 0.003 min−1, p− = 0.01 min−1, f = 6.2 min−1, m = 0.62 min−1, KM = 10 mM, n = 4, c = 200 μg min −1, M0 = 14 μg min−1, KΦ = 7.22 mM. (c) The steady-state mobilization rate
  (full curve) is compared with the linear function Yb + β(G − h) with h = Gb = 5 mM. The vertical grey lines indicate the basal and maximal glucose levels from (a). (d) The parameter
  controlling delay in
  as a function of G. The vertical grey lines indicate the basal and maximal glucose levels from (a).
We have previously argued that in our mechanistic model derivative control is negligible when dG/dt is negative [7]. For the IVGTT, this claim is further supported by a more careful analysis as follows.
The glucose concentration during an IVGTT is approximately given as a decreasing exponential (figure 2a)
| 4.1 |
where Gb is the basal glucose concentration, Gmax the maximal glucose concentration reached shortly after the delivery of glucose bolus at time t = 0 and τ ≈ 30 min is a time-constant describing the decay of the glucose concentration. Equivalently, we can describe the glucose profile by
| 4.2 |
The fraction of the RRP with glucose threshold equal to g is h(g) = ∂H/∂G|G = g, and for g < G it is described by [15,17]
| 4.3 |
where ϕ(g) = dΦ/dG|G = g. The time-constant for this equation is 1/(p−+f), which is of the order of seconds because of rapid fusion, much faster than the other kinetic processes in the model as well as the glucose time scale τ. Thus, equation (4.3) is in a quasi-steady-state, which yields
| 4.4 |
By integration, we obtain immediately
| 4.5 |
Thus, the last two terms in equation (3.4) can now be compared, which reveals
 |
4.6 |
Thus, derivative control is negligible in equation (3.4). A quasi-steady-state analysis of equation (3.4) then yields equation (4.5), confirming the consistency of the argumentation. Intuitively, the lack of derivative control is because of the decreasing glucose concentration, which causes h(G) to be near-empty because the cells with threshold G have been active throughout the IVGTT.
If we assume quasi-steady-state also for the RRP in cells with threshold above G, we obtain from equation (3.3) and the approximation for H in equation (4.5)
| 4.7 |
Our model can then be expressed as
 |
4.8 |
Define
| 4.9 |
| 4.10 |
Then,
| 4.11a |
| 4.11b |
| 4.11c |
with  and
and
| 4.12 |
Note the analogy between the models in equations (2.1) and (4.11).
The initial condition for  is
is  because Φ(Gb) = 0. When G rises to Gmax rapidly after the glucose bolus, a part of the RRP equal to H(Gmax) fuses rapidly and enters F within seconds. Thus, the initial condition for
  is
is
| 4.13 |
Figure 2b shows a typical pattern of the pool F and its approximation  , which shows excellent correspondence. The asymptotic function for mobilization
  is plotted in figure 2c together with the corresponding linear function max{0,β(G−h)} from equation (2.1b). Note the good correspondence over most of the glucose range attained during an IVGTT (indicated by vertical grey lines).
The minimal model in equations (2.1) has a constant delay 1/α, whereas the delay  in equations (4.11) depends on G. However,
  is nearly constant (figure 2d) because r is an order of magnitude greater than p+, justifying the minimal model assumption of constant delay. With the parameters used here, we find that the delay
  is of the order of 12 min, in reasonable agreement with Toffolo et al. [5], who found a delay of approximately 15 min.
5. Discussion
The biology underlying insulin secretion during an IVGTT or an OGTT is obviously the same, while the minimal secretion models, although similar, are not identical. We have here shown that our model description of the cellular events underlying glucose-stimulated insulin secretion [15] simplifies to our IVGTT minimal model [5] when the β-cells respond to a IVGTT glucose profile. Similarly, in our previous work [7] we showed that the β-cell model [15] reduces to our OGTT minimal secretion model [8] when subjected to a typical glucose stimulus seen during an OGTT. Thus, depending on the clinical setting, a single mechanistic β-cell model simplifies to either the IVGTT or the OGTT minimal secretion models needed for parameter identifiability in tests of β-cell function. This fact justifies on the one hand the differences between the two minimal models that represent the same underlying biology but under different conditions, and on the other hand highlights why the two minimal models have a structural similarity.
We found that the delay parameter  is nearly constant and, surprisingly, approximately equal to the reinternalization rate r. The parameter α reflects the time needed for the docked pool D to respond to changes in D (equation (4.8)), and when granule movement to and from the membrane is substantial, this time-constant is mainly controlled by the reinternalization rate. A recent study using total internal reflection fluorescence imaging experiments has indeed suggested such frequent movement [21].
The minimal model parameter X0 corresponds to the amount of the RRP that is released when glucose increases to Gmax (equation (4.13)), and the first phase index Φ1 = X0/(Gmax−Gb) is hence related to the function h = ∂H/∂G. For the OGTT minimal model, we found a similar relation between the dynamic index ΦD and the function h, again reflecting that the two minimal models share similarities because they are reflecting the same underlying biology.
Finally, the parameter β in equations (2.1) is approximately equal to  (figure 2c). Using that f ≫ p− and ρ(G) ≈ r, we find that
| 5.1 |
Hence, the second phase index Φ2 = β reflects the combined effect of mobilization, cell recruitment and the strength of priming versus reinternalization, i.e. the net effect of the processes that lead to an increased amount of readily releasable insulin.
Our cellular model describes the dynamics of secretory granule pools, but does not include time-varying signals that might contribute to the secretory profiles [20]. In particular, the model does not consider Ca2+ dynamics, which is known to have complex temporal patterns with a first phase of raised cytosolic Ca2+ concentrations followed by oscillations [22]. It is most likely that both granule pool dynamics and Ca2+ patterns contribute to the typical biphasic secretion patterns seen after a rapid rise in glucose [23], such as following the glucose bolus in the IVGTT, as well as other secretion profiles. It will be interesting to investigate the relative contribution of Ca2+ versus granule pool dynamics to IVGTT and OGTT insulin secretion profiles following the multiscale ideas presented in Pedersen et al. [7] and in the present article. Moreover, to obtain deeper insight in the cellular control of clinically relevant secretion patterns, it might be favourable to add another layer to the multiscale approach by using mathematical models, preferably based on data from human β-cells, of glucose control of electrical activity [24], and of Ca2+ and exocytosis [25].
References
- 1.Kahn SE. 2003. The relative contributions of insulin resistance and β-cell dysfunction to the pathophysiology of Type 2 diabetes. Diabetologia 46, 3–19 10.1007/s00125-002-1009-0 (doi:10.1007/s00125-002-1009-0) [DOI] [PubMed] [Google Scholar]
- 2.Kahn SE, et al. 1993. Quantification of the relationship between insulin sensitivity and β-cell function in human subjects. Evidence for a hyperbolic function. Diabetes 42, 1663–1672 10.2337/diab.42.11.1663 (doi:10.2337/diab.42.11.1663) [DOI] [PubMed] [Google Scholar]
- 3.Ličko V, Silvers A. 1975. Open-loop glucose–insulin control with threshold secretory mechanism: analysis of intravenous glucose tolerance tests in man. Math. Biosci. 27, 319–332 10.1016/0025-5564(75)90110-8 (doi:10.1016/0025-5564(75)90110-8) [DOI] [Google Scholar]
- 4.Toffolo G, Bergman RN, Finegood DT, Bowden CR, Cobelli C. 1980. Quantitative estimation of β cell sensitivity to glucose in the intact organism: a minimal model of insulin kinetics in the dog. Diabetes 29, 979–990 10.2337/diab.29.12.979 (doi:10.2337/diab.29.12.979) [DOI] [PubMed] [Google Scholar]
- 5.Toffolo G, Grandi FD, Cobelli C. 1995. Estimation of β-cell sensitivity from intravenous glucose tolerance test C-peptide data. Knowledge of the kinetics avoids errors in modeling the secretion. Diabetes 44, 845–854 10.2337/diab.44.7.845 (doi:10.2337/diab.44.7.845) [DOI] [PubMed] [Google Scholar]
- 6.Cobelli C, Toffolo GM, Man CD, Campioni M, Denti P, Caumo A, Butler P, Rizza R. 2007. Assessment of β-cell function in humans, simultaneously with insulin sensitivity and hepatic extraction, from intravenous and oral glucose tests. Am. J. Physiol. Endocrinol. Metab. 293, E1–E15 10.1152/ajpendo.00421.2006 (doi:10.1152/ajpendo.00421.2006) [DOI] [PubMed] [Google Scholar]
- 7.Pedersen MG, Toffolo GM, Cobelli C. 2010. Cellular modeling: insight into oral minimal models of insulin secretion. Am. J. Physiol. Endocrinol. Metab. 298, E597–E601 10.1152/ajpendo.00670.2009 (doi:10.1152/ajpendo.00670.2009) [DOI] [PubMed] [Google Scholar]
- 8.Breda E, Cavaghan MK, Toffolo G, Polonsky KS, Cobelli C. 2001. Oral glucose tolerance test minimal model indexes of β-cell function and insulin sensitivity. Diabetes 50, 150–158 10.2337/diabetes.50.1.150 (doi:10.2337/diabetes.50.1.150) [DOI] [PubMed] [Google Scholar]
- 9.Cretti A, et al. 2001. Assessment of β-cell function during the oral glucose tolerance test by a minimal model of insulin secretion. Eur. J. Clin. Invest. 31, 405–416 10.1046/j.1365-2362.2001.00827.x (doi:10.1046/j.1365-2362.2001.00827.x) [DOI] [PubMed] [Google Scholar]
- 10.Mari A, Schmitz O, Gastaldelli A, Oestergaard T, Nyholm B, Ferrannini E. 2002. Meal and oral glucose tests for assessment of β-cell function: modeling analysis in normal subjects. Am. J. Physiol. Endocrinol. Metab. 283, E1159–E1166 10.1152/ajpendo.00093.2002 (doi:10.1152/ajpendo.00093.2002) [DOI] [PubMed] [Google Scholar]
- 11.Hovorka R, Chassin L, Luzio SD, Playle R, Owens DR. 1998. Pancreatic β-cell responsiveness during meal tolerance test: model assessment in normal subjects and subjects with newly diagnosed noninsulin-dependent diabetes mellitus. J. Clin. Endocrinol. Metab. 83, 744–750 10.1210/jc.83.3.744 (doi:10.1210/jc.83.3.744) [DOI] [PubMed] [Google Scholar]
- 12.Dalla Man C, Micheletto F, Sathananthan A, Rizza RA, Vella A, Cobelli C. 2010. A model of GLP-1 action on insulin secretion in nondiabetic subjects. Am. J. Physiol. Endocrinol. Metab. 298, E1115–E1121 10.1152/ajpendo.00705.2009 (doi:10.1152/ajpendo.00705.2009) [DOI] [PMC free article] [PubMed] [Google Scholar]
- 13.Pedersen MG, Dalla Man C, Cobelli C. 2011. Multiscale modeling of insulin secretion. IEEE Trans. Biomed. Eng. 58, 3020–3023 10.1109/TBME.2011.2164918 (doi:10.1109/TBME.2011.2164918) [DOI] [PubMed] [Google Scholar]
- 14.Grodsky GM. 1972. A threshold distribution hypothesis for packet storage of insulin and its mathematical modeling. J. Clin. Invest. 51, 2047–2059 10.1172/JCI107011 (doi:10.1172/JCI107011) [DOI] [PMC free article] [PubMed] [Google Scholar]
- 15.Pedersen MG, Corradin A, Toffolo GM, Cobelli C. 2008. A subcellular model of glucose-stimulated pancreatic insulin secretion. Phil. Trans. R. Soc. A 366, 3525–3543 10.1098/rsta.2008.0120 (doi:10.1098/rsta.2008.0120) [DOI] [PubMed] [Google Scholar]
- 16.Herrero P, Georgiou P, Oliver N, Johnston DG, Toumazou C. 2012. A bio-inspired glucose controller based on pancreatic β-cell physiology. J. Diabetes Sci. Technol. 6, 606–616 [DOI] [PMC free article] [PubMed] [Google Scholar]
- 17.Overgaard RV, Henriksen JE, Madsen H. 2005. Insights to the minimal model of insulin secretion through a mean-field beta cell model. J. Theor. Biol. 237, 382–389 10.1016/j.jtbi.2005.04.023 (doi:10.1016/j.jtbi.2005.04.023) [DOI] [PubMed] [Google Scholar]
- 18.Jonkers FC, Jonas J-C, Gilon P, Henquin J-C. 1999. Influence of cell number on the characteristics and synchrony of Ca2+ oscillations in clusters of mouse pancreatic islet cells. J. Physiol. 520, 839–849 10.1111/j.1469-7793.1999.00839.x (doi:10.1111/j.1469-7793.1999.00839.x) [DOI] [PMC free article] [PubMed] [Google Scholar]
- 19.Heart E, Corkey RF, Wikstrom JD, Shirihai OS, Corkey BE. 2006. Glucose-dependent increase in mitochondrial membrane potential, but not cytoplasmic calcium, correlates with insulin secretion in single islet cells. Am. J. Physiol. Endocrinol. Metab. 290, E143–E148 10.1152/ajpendo.00216.2005 (doi:10.1152/ajpendo.00216.2005) [DOI] [PubMed] [Google Scholar]
- 20.O'Connor M, Landahl H, Grodsky G. 1980. Comparison of storage- and signal-limited models of pancreatic insulin secretion. Am. J. Physiol. 238, R378–R389 [DOI] [PubMed] [Google Scholar]
- 21.Hatlapatka K, Matz M, Schumacher K, Baumann K, Rustenbeck I. 2011. Bidirectional insulin granule turnover in the submembrane space during K+ depolarization-induced secretion. Traffic 12, 1166–1178 10.1111/j.1600-0854.2011.01231.x (doi:10.1111/j.1600-0854.2011.01231.x) [DOI] [PubMed] [Google Scholar]
- 22.Henquin JC. 2009. Regulation of insulin secretion: a matter of phase control and amplitude modulation. Diabetologia 52, 739–751 10.1007/s00125-009-1314-y (doi:10.1007/s00125-009-1314-y) [DOI] [PubMed] [Google Scholar]
- 23.Pedersen MG, Sherman A. 2009. Newcomer insulin secretory granules as a highly calcium-sensitive pool. Proc. Natl Acad. Sci. USA 106, 7432–7436 10.1073/pnas.0901202106 (doi:10.1073/pnas.0901202106) [DOI] [PMC free article] [PubMed] [Google Scholar]
- 24.Pedersen MG. 2010. A biophysical model of electrical activity in human β-cells. Biophys. J. 99, 3200–3207 10.1016/j.bpj.2010.09.004 (doi:10.1016/j.bpj.2010.09.004) [DOI] [PMC free article] [PubMed] [Google Scholar]
- 25.Pedersen MG, Cortese G, Eliasson L. 2011. Mathematical modeling and statistical analysis of calcium-regulated insulin granule exocytosis in β-cells from mice and humans. Prog. Biophys. Mol. Biol. 107, 257–264 10.1016/j.pbiomolbio.2011.07.012 (doi:10.1016/j.pbiomolbio.2011.07.012) [DOI] [PubMed] [Google Scholar]