Abstract
Despite the importance of platelets in the formation of a thrombus, their transport in complex flows has not yet been studied in detail. In this paper we simulated red blood cells and platelets to explore their transport behaviour in aneurysmal geometries. We considered two aneurysms with different aspect ratios (AR = 1.0, 2.0) in the presence of fast and slow blood flows (Re = 10, 100), and examined the distributions of the cells. Low velocities in the parent vessel resulted in a large stagnation zone inside the cavity, leaving the initial distribution almost unchanged. In fast flows, an influx of platelets into the aneurysm was observed, leading to an elevated concentration. The connection of the platelet-rich cell-free layer (CFL) with the outer regions of the recirculation zones leads to their increased platelet concentration. These platelet-enhanced recirculation zones produced a diverse distribution of cells inside the aneurysm, for the different aspect ratios. A thin red blood CFL that was occupied by platelets was observed on the top of the wide-necked aneurysm, whereas a high-haematocrit region very close to the vessel wall was present in the narrow-necked case. The simulations revealed that non-trivial distributions of red blood cells and platelets are possible inside aneurysmal geometries, giving rise to several hypotheses on the formation of a thrombus, as well as to the wall weakening and the possible rupture of an aneurysm.
Keywords: platelet, aneurysm, blood, red blood cells, diffusion, aspect ratio
1. Introduction
Intracranial aneurysms are pathological dilatations of the cerebral blood vessels with high mortality and morbidity rates associated with their possible rupture. One repair mechanism is the formation of a thrombus inside the aneurysm, significantly lowering the risk of rupture [1,2]. This formation can also be induced by positioning a flow-diverting stent in the orifice of the aneurysm. Quantitative models of thrombosis in intracranial aneurysms are now needed, and the European Union-funded project THROMBUS aims to validate such models and translate them into clinical practice [3].
Platelets, or thrombocytes, are the main component of a thrombus. They exhibit excess concentration near the walls of a vessel [4–6], ensuring a more effective response to wounds and tissue damage. This margination is amplified by the shape and dynamics of red blood cells (RBCs) [4–7], and a similar behaviour can be observed for white blood cells [8]. The presence of RBCs is also important in the adhesion and aggregation of platelets, based on computational studies [9,10]. Almost all thrombosis models that have been developed [11–14] and applied to aneurysm geometries [15–18] treat platelets on a mean field level, by modelling them as tracer particles in a homogeneous fluid.
Several methods have been proposed and used to describe the transport of platelets in blood flow. A simple approach for the transport is by using an advection–diffusion model, with a simple scalar diffusion term as used in recent studies [12,16]. Modelling the transport of platelets with scalar diffusion in an incompressible fluid without sources and sinks will eventually lead to a homogeneous distribution [19]. Eckstein & Belgacem [20] proposed an additional drift term to mimic RBC enhanced motion, whereas more sophisticated approaches involving the explicit dependence of the diffusion coefficient on the local haematocrit and shear rate have also been proposed [21,22]. The dependence on these quantities has already been recognized in early experimental work [4,23]. Although such methods may provide adequate results in simple channel flows, little is known about the behaviour of platelets in more complex flow geometries, in which most of these models lack validity [24]. The research on the modelling of thrombosis to date mainly uses advection–diffusion descriptions at the macroscopic scale for the transport of platelets, without taking full account of the non-trivial nature of the presence of RBCs in the transport, especially in more complex geometries.
Simulations with fully resolved RBC and platelet suspensions are challenging, owing to the computational cost of considering thousands or even millions of particles. Smaller scale studies of blood flow are preferred for qualitative studies. For example, Crowl & Fogelson [25,26] simulated the lateral motion of platelets in a two-dimensional channel, whereas three-dimensional studies have focused on varying parameters and examining their effect on the margination [27,28]. At this cellular scale, models have either emphasized flows in straight channels or used a haematocrit significantly lower than the physiological value. In this article, we focus on investigating the transport behaviour and the distribution of platelets in aneurysmal geometries by explicitly simulating platelet-sized and deformable membraneous RBC-shaped particles in suspensions with physiological haematocrit values. The aim is to explore the behaviour of platelets in complex flows, and give insights into the formation of thrombus in aneurysms by understanding where the platelets are located in aneurysmal geometries.
2. Methods and model
Blood is a multi-phase non-Newtonian fluid consisting of RBCs, platelets and white blood cells suspended in plasma, a protein-rich Newtonian fluid. The complex behaviour of blood mainly arises from the high concentration of RBCs, which constitute up to 45 per cent of the total blood volume. Our approach fully resolves deformable RBCs and platelet-shaped particles, suspended in the plasma. A two-dimensional approach has been used, using the lattice Boltzmann method (LBM; [29]) as a fluid solver and coupled to a discrete element representation of the cells using the immersed boundary method (IBM; [30]).
The LBM is a well-established mesoscopic approach, solving the incompressible Navier–Stokes equation, and has demonstrated capabilities in many studies of biomedical interest [12,31–34].
The IBM is a fluid structure interaction method in which a membrane is immersed in the fluid. The idea behind the IBM is to advect the elements of the membrane with the fluid, based on the no-slip condition. The forces between the membrane elements are applied back to the fluid. The IBM is a pure coupling method with a small numerical overhead and is one of the most widely used methods to couple RBC-like structures with fluid flow in two dimensions [26,35–37] and in three dimensions [38,39].
2.1. Blood model
Modelling blood through its constituents allows important rheological and transport properties to be captured, without the simplifications that would be necessary for a macroscopic approximation.
The D2Q9 LBGK scheme is used to simulate the fluid flow [29], whereas the viscosity is chosen to match blood plasma [40]. RBCs are represented as a closed deformable membrane with a biconcave shape and a diameter of 8 µm. Circular-shaped cells with a diameter of 2 µm, slightly deformable, constitute the platelet-sized particles. Our ‘platelets’ are not reactive and do not adhere or aggregate, but correspond to the platelet-sized passive particles found in in vitro studies [4,6,41].
The membrane of the cells is represented with neighbouring surface points connected with Hookean springs and enhanced with bending resistance between the adjacent membrane springs. The viscous properties of the membrane derive from damper elements connecting surface points, while the conservation of volume and surface is ensured by applying forces in an equivalent way to the pressure differences between the inner and surrounding fluid of the membrane. Similar models and implementations can be found in recent studies [26,35,37].
The model is tuned such that the single-cell dynamics are resolved sufficiently in the range of shear rates of interest [42]. A repulsion force is also included to overcome artificial correlation resulting from the IBM interaction and is tuned to the extent that the shear-thinning behaviour is correctly recovered. Shear thinning results naturally from the deformability of the RBC shape and the formation of rouleaux-like structures at lower shear rates [43].
A balance is necessary between resolving important aspects of the flow field around a RBC-shaped particle and avoiding the heavy computations owing to the diffusive scaling of the LBM. Our approach is aiming for the simplest possible model that reproduces important aspects of rheology and single-cell dynamics. It has been validated against various benchmarks, such as tumbling and tank-treading transition of a single RBC in shear flow, the shear-thinning behaviour and the haematocrit dependence of blood viscosity (data not shown; for details see [42]). Figure 1 illustrates a snapshot from a simulation of the flow through an aneurysm geometry, demonstrating the model representation of the cells along with two magnifications.
Figure 1.
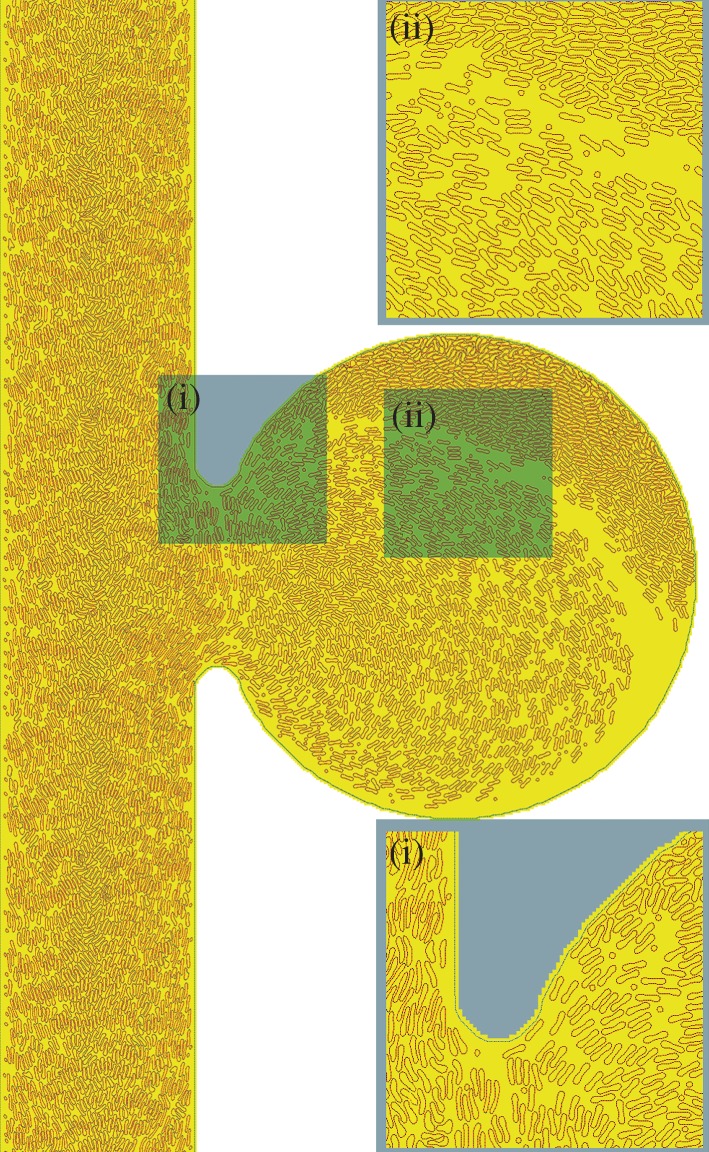
Snapshot of a simulation of blood flow through the simplified aneurysm geometry Sa, explicitly tracking red blood cells (RBCs) and platelets. The small circular particles represent the platelets. Dotted lines denote the boundaries. The simulated case is Sa100 and details can be found in table 1. Inset figure (i) depicts the shape of RBCs when exposed to the high shear rates encountered close to the walls of the main vessel, as well as their proximity to the boundary inside the aneurysm. Inset figure (ii) depicts parts of the recirculation zone, a boundary layer with low haematocrit and elevated platelet concentration, and a region with densely packed RBCs. The time integrated concentration profiles are shown in §3.4.
With the current model, we investigate the three-dimensional process of cell transport in blood flow, limited to two dimensions. The distributions of cells inside two-dimensional aneurysms may differ significantly from three-dimensional idealized cases, because no obvious symmetry exists. In many respects, however, the behaviour of a two-dimensional suspension system is similar to that in a three dimensional system, particularly in terms of the quantities and effects that interest us in this work [26,27]; thus we are able to maintain the main advantage of a two-dimensional simulation, i.e. reduced computational requirements.
2.2. Simulation set-up
The fluid was initially allowed to rest and then it was driven by a constant body force, mimicking a pressure gradient. The pulsatility of the flow was neglected owing to the relatively small Womersley number  , L being the characteristic length scale, ω the angular frequency of the oscillations and ν the kinematic viscosity. For intracranial arteries, typically
  . Instead, two different Reynolds numbers,
  and 100, were considered, in order to approximate two different situations within the cardiac cycle (U is the characteristic velocity). The total simulated time was 0.2 s. Reynolds numbers were calculated based on the size of the parent vessel, the plasma viscosity and the imposed pressure gradient, supposing a Poiseuille profile without RBCs. Owing to the suspension of RBCs and the aneurysm bulge, the final resulting velocity will be slightly different.
First, we consider the case of a straight channel and compare our results with those of in vitro experiments, recovering the transport properties of platelets in a tube in the presence of RBCs. Next we consider two aneurysmal geometries with different aspect ratios in order to study the cell transport in more complex flows, exposing the fluid to two different pressure gradients. The aspect ratio is defined as the ratio of the maximum perpendicular height to the average neck diameter [44] and has been identified as an important parameter for rupture [45] and for the formation of a thrombus in an aneurysm.
We have chosen to use the geometries introduced in recent studies [11,16] in order to compare our fully resolved model with simulations in which blood was modelled as a continuous Newtonian fluid. The four cases are named after the geometry acronym and the Reynolds number: LLa100, LLa010, Sa100 and Sa010, and details of the geometrical parameters can be found in table 1. Similar flow patterns to the studies reported earlier were found by using the same Reynolds number, but the smaller size of the vessel caused higher absolute velocities and shear rates. The diameter of the main vessel is 0.1 mm, close to 10 times smaller than those found in human cerebral arteries [46]. The dimensions of the domain were preferred in order to reduce the computational cost of each simulation, because a factor of 10 in diameter would yield a factor of 100 in the number of lattice nodes and cells.
Table 1.
Geometrical parameters and set-up of the aneurysm cases. NRBC is the number of red blood cells and Nplt the number of platelets.
| case ID | Reynolds number | geometry | aspect ratio | neck size (mm) | NRBC | Nplt |
|---|---|---|---|---|---|---|
| LLa100 LLa010 |


|
 LLa LLa |
1.0 | 0.2 | 4900 | 300 |
| Sa100 Sa010 |


|
 Sa Sa |
2.0 | 0.1 | 4700 | 300 |
The initial positions of RBCs and platelets were chosen at random without any overlaps, providing a homogeneous initial distribution. Both fluid and cells were subjected to periodic boundaries. The number of RBCs corresponds to the haematocrit under physiological conditions (42%). Haematocrit is defined as the volume ratio of RBCs to blood. The number of platelets was selected close to the physiological ratio of RBCs to platelets of  , ranging from
  to
to  , providing a suspension slightly richer in platelets for better statistics.
2.3. Quantities of interest
Besides flow fields, velocity and shear rates, the concentration of RBCs and the local concentration of platelets Cplt are of particular interest in this study. As the ‘normalized platelet concentration’, we define the ratio of the local platelet concentration to the mean platelet concentration
 |
2.1 |
where Cplt is the local concentration of platelets and  is the mean platelet concentration. A normalized platelet concentration equal to 1.0 corresponds to the mean concentration.
The results presented here are the outcome of 15 simulations with different initial conditions. The simulation results are time averaged over the last 0.08 s of the total 0.2 s. The parameters and the settings of the simulations are reported in table 2.
Table 2.
Simulation parameters. See table 1 for corresponding values for the aneurysm geometry.
| parameters | values |
|---|---|
| dynamic viscosity, ν | 1.7 × 10⁻⁶ m2 s−1 |
| haematocrit, H | 42% |
| NRBC | 850a |
| Nplt | 45a |
| diameter, d (main vessel) | 100 µm |
| length, L (main vessel) | 600 µm |
| spatial resolution, dx | 1 µm |
| time step, dt | 9.8 × 10⁻⁸ s |
 plt plt
|
 plt µm−2 plt µm−2
|
aChannel simulations.
3. Results
First, we present the results obtained on a straight channel with a haematocrit equal to 42 per cent and a platelet-only case. This provides a benchmark for the simulated transport. Next, we investigate the transport of platelets and RBCs in two aneurysmal geometries under higher and lower pressure gradients.
3.1. Transport in a straight channel
Results from the straight channel with a haematocrit of 42 per cent are shown in figure 2. The excess of platelets near the walls of the channel is evident, as well as the clearly visible red blood cell free layer (CFL). The formation of a CFL is the microscopic phenomenon behind the Fåhræus–Lindqvist effect, which is characterized by a decrease in the apparent blood viscosity as the vessel diameter decreases below 500 µm [47].
Figure 2.
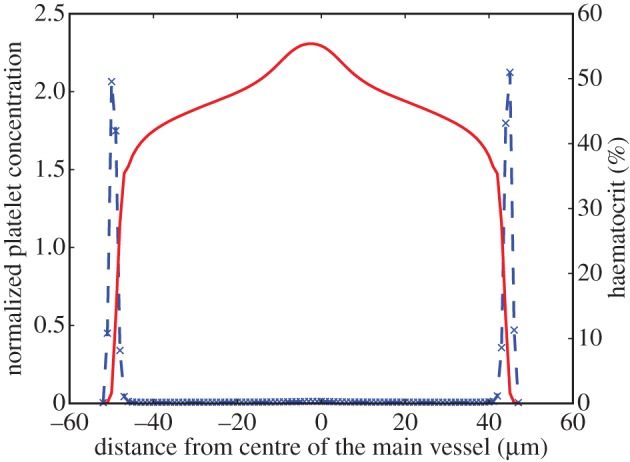
Platelet and haematocrit distributions across a channel of diameter 100 µm with H = 42% and  . The blue dashed line is for platelets and the red solid line for RBCs. RBCs are depleted close to the wall, whereas platelets occupy this RBC-free layer.
The peak of the RBC concentration in the centre of the channel is a result of the symmetry of the simulated channel, also observed by Zhao & Shaqfeh [48]. Such a peak is not observed under experimental conditions, where higher mixing is expected.
In the absence of RBCs, the distribution of platelets is not homogeneous as would have been expected for Brownian point particles. Platelets tend to crowd around approximately 60 per cent of the radius of the channel. This effect is known from dilute rigid sphere suspensions as the Segré–Silberberg [49] or tubular pinch [5] effect and is a balance of viscous drag and inertial lift forces [50]. Our results are similar to the in vitro profiles of Aarts et al. [5], shown in figure 3. The in vitro data reported by Aarts et al. show a dependency on the wall shear rate, probably due to the insufficient equilibration in the low shear rate cases. This is also true for the profiles obtained in our simulations 1.0 s after the initialization with a homogeneous distribution (blue curve in figure 3).
Figure 3.
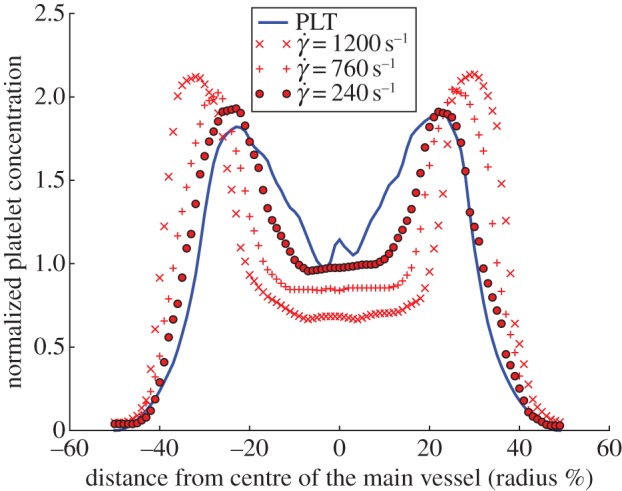
Platelet distributions across a channel of d = 100 µm without RBCs. Platelets crowd around 60% of the radius (0.6 × 50 µm = 30 µm). In vitro data from Aarts et al. [5] shown in red (d = 3 mm); the blue line is the simulation result.
3.2. Transport in aneurysmal geometries
We examined the transport of platelets in aneurysms with different aspect ratios, under high and low pressure gradients.
3.3. Lower velocities
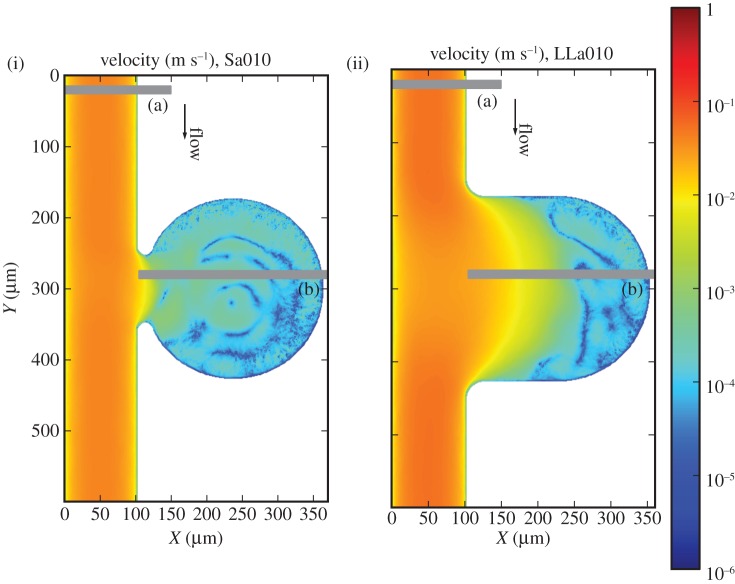
The imposed pressure gradient yields a maximum velocity of  in the parent vessel. Significantly lower velocities are observed inside the aneurysm for both aspect ratios (figure 4). Examining the velocity field and the distribution of haematocrit and platelets, we can distinguish three zones for Sa010: (i) the parent vessel, (ii) a circulation zone close to the entrance of the aneurysm, and (iii) a large stagnation zone where cells move really slow. The stagnation zone occupies most of the aneurysm.
Figure 4.
(i) Velocity profiles for the Sa010 and (ii) LLa010. (a) and (b) refer to the positions of the two chosen cross sections. Note the logarithmic colour scale, reflecting the considerably lower velocities inside the aneurysm.
Two zones are clearly visible in LLa010: (i) the region of the flow entering the aneurysm and (ii) a large stagnation zone. Close to the entrance of the aneurysm, we observe a region with a depletion of RBCs and occupied by platelets. A recirculation zone is absent from this case.
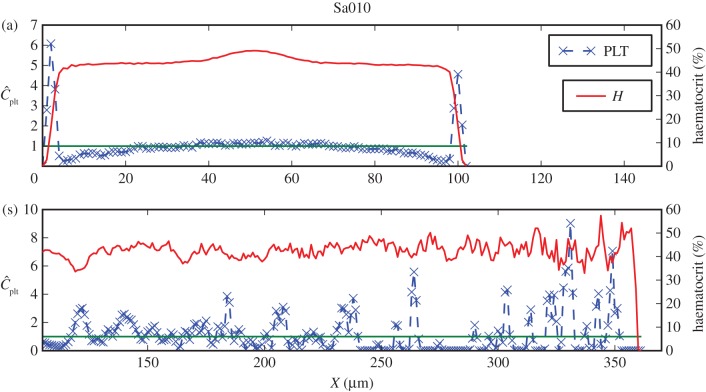
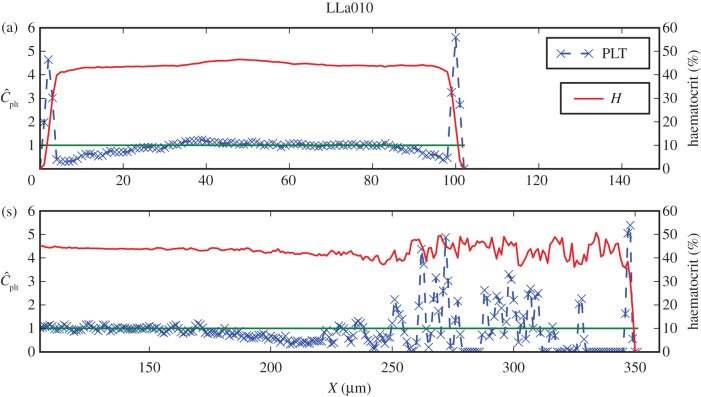
Two cross sections are examined more closely for each of these cases, (a) corresponding to the main vessel flow and (b) for the others, and detailed profiles can be seen in figures 5 and 6.
Figure 5.
Haematocrit and normalized platelet concentration for Sa010 cross sections marked in figure 4(i). Shown are (a) the distributions in the parent vessel with a clearly visible margination of platelets, and (s) the cross section containing parts in the recirculation and the stagnation zones. The green line refers to the mean platelet concentration (  ).
).
Figure 6.
Similar to figure 5, but now for LLa010, shown are (a) the distributions in the parent vessel with a clearly visible margination of platelets, and (b) the cross section containing parts in the flow entering the aneurysm and the stagnation zone.
The lateral position of platelets is visible for LLa010A and Sa010A in figures 6a and 5a, respectively. Both cases have a noticeably lower peak in the platelet concentration, closer to the neck of the aneurysm. This may yield an influx of platelets into the aneurysm, but no significant increase in the aneurysm concentration is evident (figures 7(iii), 6b and 5b), possibly due to the slow transport resulting from low velocities and small shear rates.
Figure 7.
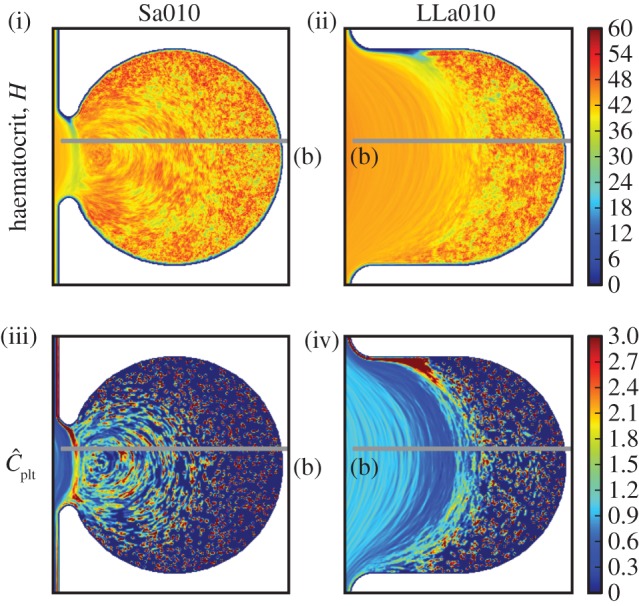
(i) Haematocrit H for Sa010 and (ii) for LLa010, (iii) normalized platelet concentration  for Sa010 and (iv) for LLa010. Sa010 possesses a recirculation zone, along with a large stagnation zone. LLa010 exhibits a large stagnation zone as well, with a platelet-rich area close to the entrance of the fluid. Values larger than 3.0 for
  and 60 for H are coloured dark red.
The initial distribution of platelets can be seen in the stagnation zones of figure 7, as an effect of their slow movement compared with the simulated time (figures 7(iii),(iv) and 6a).
3.4. Higher velocities
The Reynolds number for these two cases is  and corresponds to a parent vessel velocity of
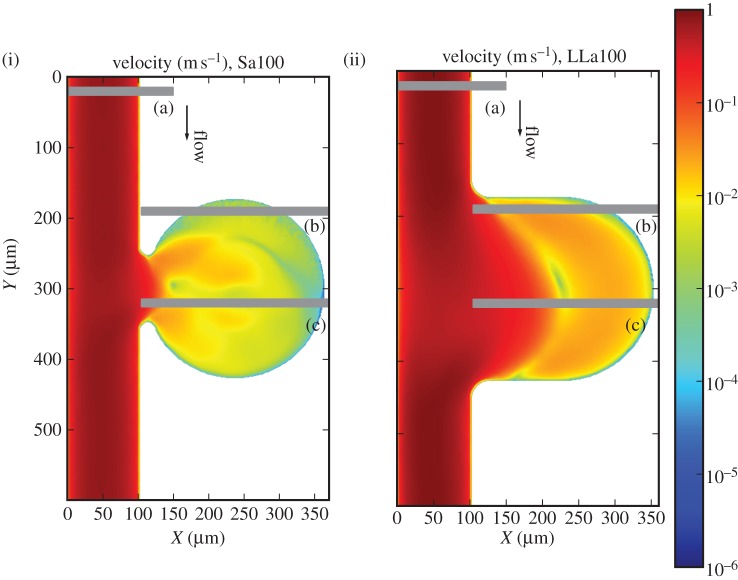
  . Lower velocities are found inside the aneurysm cavity (figure 8).
Figure 8.
(i) Velocity profiles for Sa100 and (ii) LLa100. (a), (b) and (c) refer to the positions of the three chosen cross sections. Note the logarithmic colour scale, reflecting the considerably lower velocities inside the aneurysm.
Three zones can be distinguished in the haematocrit and platelet distributions in the cases Sa100 shown in figure 9(i),(iii): (i) the main vessel flow, (ii) a region with high RBC density, and (iii) a recirculation zone in the centre of the aneurysm. Three zones are noticeable for LLa100 as well: (i) the main vessel flow with a part entering the aneurysm, (ii) a region with slightly higher haematocrit, and (iii) a recirculation zone. For each of the three zones, one cross section is examined more closely, (a), (b) and (c), respectively.
Figure 9.
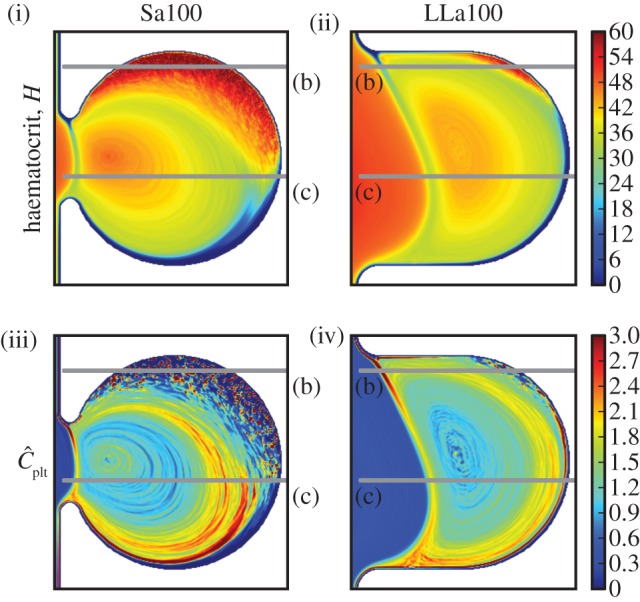
(i) Haematocrit H for Sa100 and (ii) for LLa100, (iii) normalized platelet concentration  for Sa100 and (iv) for LLa100. Note the high H region in Sa100 and the CFL at the top of the aneurysm. Platelets are occupying the outer regions of the recirculation areas. Values larger than 3.0 for
  and 60 for H are coloured dark red.
The lateral motion of platelets is present in the parent vessels of LLa100 and Sa100 as well. The concentrations are similar to those of the straight channel flow (figures 10a and 11a), but a considerably lower concentration of platelets is observed on the right-hand side of the wall, the side of the aneurysm orifice. Platelets flowing close to the wall are transported into the cavity and, owing to the periodic boundaries, the number of platelets is decreased in the channel.
Figure 10.
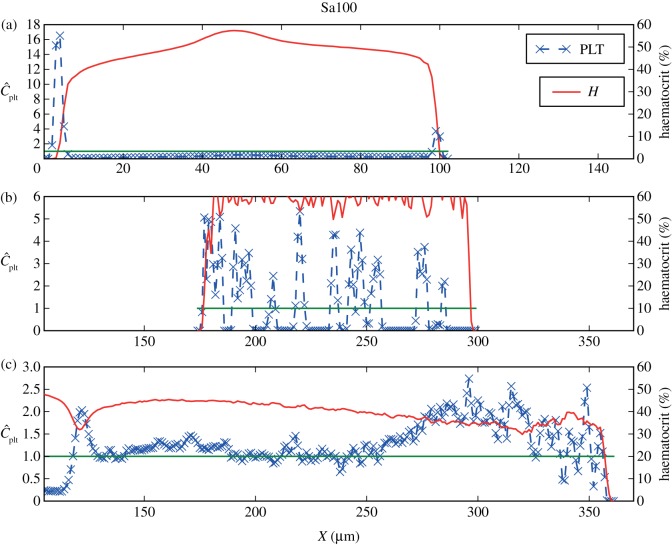
Haematocrit and normalized platelet concentration for the cross sections of Sa100, as marked in figure 8(i). Shown here are cross sections from (a) the parent vessel, with the lateral position of platelets clearly visible. A lower concentration in the left side may be due to an influx into the aneurysm. (b) The increased haematocrit region. (c) The recirculation zone and its increased platelet concentration in the outer regions. The green line refers to the mean platelet concentration.
Figure 11.
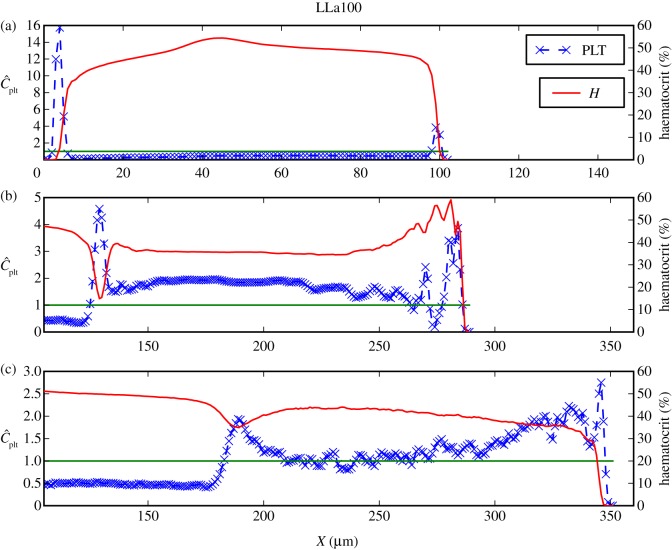
Similar to figure 10 but now for the LLa100 cross sections marked in figure 8(ii). Shown here are (a) margination behaviour of the parent vessel as in figure 10a; (b) and (c) exhibit an increased platelet concentration in the recirculation zone and a peak close to the walls where the RBCs are depleted.
This can be confirmed by the increased platelet concentration inside the cavity (figures 10b,c and 11b,c), providing evidence for an influx of platelets into the aneurysm, mainly increasing the outer parts of the recirculation zones.
A large area of high haematocrit is present in zone Sa100 (b), shown in figures 9 and 10b. The transport of RBCs there has formed a CFL on the top of the aneurysm, close to zone Sa100 (c). Platelets from the homogeneous initialization are trapped between RBCs in region Sa100 (b) and are visible as the steep peaks in figure 10b. A snapshot of this interesting situation is depicted in figure 1.
Comparing LLa100 with Sa100, a different behaviour is visible. A much smaller area with slightly more elevated haematocrit can be distinguished in LLa100 (ii) (figure 11b), but not to the same extent as Sa100 (b). A narrow CFL is also observed on the top, exhibiting an excess of platelets in contrast to the empty Sa100 (b) CFL. The higher concentration is depicted as a thin red layer following the boundaries of the aneurysm in figures 9 and 11b. Platelets most probably originate from the main flow and are transported there via the recirculation zone.
4. Discussion
In the current work, we studied the transport of platelets and RBCs in fast and slow flows, in two aneurysmal geometries with different aspect ratios. The distributions of cells inside the cavity are far from trivial.
Platelets flow closer to the vessel walls, remaining this way close to flow boundaries, e.g. walls or separation zones, where their function is beneficial. The connection of the platelet-rich CFL with the outer regions of the recirculation zones in the simulated fast flows enhances the transport of platelets inside the aneurysm and leads to an increased platelet concentration.
In the regions of high platelet concentration close to the top of the anurysmal wall, platelets may tether and roll, but the presence of activated platelets is also plausible, owing to a prior exposure to the higher shear rates in the orifice of the aneurysm. In the case of an unhealthy endothelium inducing coagulation, a thrombus could be formed in that region.
Another striking result of our simulations, however, is a large area of high haematocrit in the narrow necked case, which can have a series of consequences. RBCs release ADP and thromboxane A2, which enhance the aggregation of platelets [51]. This can increase the levels of these agonists inside the aneurysm, promoting the activation of platelets and resulting in the formation of a thrombus. Moreover, the proximity of the RBCs to the endothelium does not constitute a physiological condition. The endothelium plays a significant role in the regulation of thrombosis [52] and, normally, RBCs are kept away from the wall via the CFL. This unhealthy situation can cause the release of procoagulants into the flow, resulting in the onset of a thrombus. Another aspect that should be noted is that the adhesion of RBCs to the endothelium has been linked to several vascular disorders [53], and such close vicinity of RBCs to the endothelium may contribute to the wall weakening and lead to a possible rupture of the aneurysm.
The pulsatility of the flow was neglected owing to the short time of the simulation ( ) and, instead, two cases with high and low velocities were simulated. Low parent vessel velocities resulted in a stagnation zone inside the cavity, leaving the initial distribution almost unchanged. From this, we can argue that the fast flows within a cardiac cycle are those that determine the distribution of cells inside the aneurysms. The flow, however, traverses a spectrum of velocities and this estimation needs to be confirmed with more detailed studies.
To our knowledge, this is the first study exploring the transport of platelets and RBCs in aneurysmal geometries using explicit simulations of RBCs and platelets. The aneurysmal geometries used in the present work are 10 times smaller than normal aneurysms and more detailed studies are necessary in order to assess the importance of the current results to larger vessels. Nevertheless, the current work suggests that non-trivial distributions of RBCs and platelets are possible inside aneurysmal geometries and may contribute significantly to the formation of a thrombus inside the cavity.
‘Platelets’ in this study act like the latex beads used in in vitro experiments. Real platelets have a composite reactive behaviour, adhering to endothelial cells, aggregating with other platelets and rolling and tethering along the endothelial wall [54]. The authors are currently investigating modelling approaches and, in combination with in vitro experiments, will attempt to formulate a reliable micro-model for thrombosis and realize it in three dimensions.
Acknowledgements
This research receives funding from the European Union, 7th Framework Programme under grant agreement no. 26996 (http://www.thrombus-vph.eu). L.M. would also like to thank ‘SARA Computing and Networking Services’ for using their HPC infrastructure and for providing support.
References
- 1.Whittle IR, Dorsch NW, Besser M. 1982. Spontaneous thrombosis in giant intracranial aneurysms. J. Neurol. Neurosurg. Psychiatry 45, 1040–1047 10.1136/jnnp.45.11.1040 (doi:10.1136/jnnp.45.11.1040) [DOI] [PMC free article] [PubMed] [Google Scholar]
- 2.Weir B. 2002. Unruptured intracranial aneurysms: a review. J. Neurosurg. 96, 3–42 10.3171/jns.2002.96.1.0003 (doi:10.3171/jns.2002.96.1.0003) [DOI] [PubMed] [Google Scholar]
- 3.THROMBUS 2011. A quantitative model of thrombosis in intracranial aneurysms. See http://www.thrombus-vph.eu. [Google Scholar]
- 4.Tilles AW, Eckstein EC. 1987. The near-wall excess of platelet-sized particles in blood flow: its dependence on hematocrit and wall shear rate. Microvasc. Res. 33, 211–223 10.1016/0026-2862(87)90018-5 (doi:10.1016/0026-2862(87)90018-5) [DOI] [PubMed] [Google Scholar]
- 5.Aarts PA, van den Broek SA, Prins GW, Kuiken GD, Sixma JJ, Heethaar RM. 1988. Blood platelets are concentrated near the wall and red blood cells, in the center in flowing blood. Arterioscler. Thromb. Vasc. Biol. 8, 819–824 10.1161/01.ATV.8.6.819 (doi:10.1161/01.ATV.8.6.819) [DOI] [PubMed] [Google Scholar]
- 6.Zhao R, Kameneva MV, Antaki JF. 2007. Investigation of platelet margination phenomena at elevated shear stress. Biorheology 44, 161–177 [PubMed] [Google Scholar]
- 7.Uijttewaal WS, Nijhof EJ, Bronkhorst PJ, Den Hartog E, Heethaar RM. 1993. Near-wall excess of platelets induced by lateral migration of erythrocytes in flowing blood. Am. J. Physiol. 264, H1239–H1244 [DOI] [PubMed] [Google Scholar]
- 8.Fedosov DA, Fornleitner J, Gompper G. 2012. Margination of white blood cells in microcapillary flow. Phys. Rev. Lett. 108, 028104. 10.1103/PhysRevLett.108.028104 (doi:10.1103/PhysRevLett.108.028104) [DOI] [PubMed] [Google Scholar]
- 9.Mori D, Yano K, Tsubota Ki, Ishikawa T, Wada S, Yamaguchi T. 2008. Computational study on effect of red blood cells on primary thrombus formation. Thromb. Res. 123, 114–121 10.1016/j.thromres.2008.03.006 (doi:10.1016/j.thromres.2008.03.006) [DOI] [PubMed] [Google Scholar]
- 10.Pivkin I, Richardson P, Karniadakis G. 2009. Effect of red blood cells on platelet aggregation. Eng. Med. Biol. Mag. IEEE 28, 32–37 10.1109/MEMB.2009.931788 (doi:10.1109/MEMB.2009.931788) [DOI] [PubMed] [Google Scholar]
- 11.Hirabayashi M, Ohta M, Rüfenacht DA, Chopard B. 2003. Characterization of flow reduction properties in an aneurysm due to a stent. Phys. Rev. E Stat. 68, 021918. 10.1103/PhysRevE.68.021918 (doi:10.1103/PhysRevE.68.021918) [DOI] [PubMed] [Google Scholar]
- 12.Bernsdorf J, Harrison SE, Smith SM, Lawford PV, Hose RR. 2006. Concurrent numerical simulation of flow and blood clotting using the lattice Boltzmann technique. Int. J. Bioinform. Res. Appl. 2, 371–380 10.1504/IJBRA.2006.011036 (doi:10.1504/IJBRA.2006.011036) [DOI] [PubMed] [Google Scholar]
- 13.Xu Z, Chen N, Kamocka MM, Rosen ED, Alber M. 2008. A multiscale model of thrombus development. J. R. Soc. Interface 5, 705–722 10.1098/rsif.2007.1202 (doi:10.1098/rsif.2007.1202) [DOI] [PMC free article] [PubMed] [Google Scholar]
- 14.Filipovic N, Kojic M, Tsuda A. 2008. Modelling thrombosis using dissipative particle dynamics method. Phil. Trans. R. Soc. A 366, 3265–3279 10.1098/rsta.2008.0097 (doi:10.1098/rsta.2008.0097) [DOI] [PMC free article] [PubMed] [Google Scholar]
- 15.Chopard B, Ouared R, Rufenacht D. 2006. A lattice Boltzmann simulation of clotting in stented aneursysms and comparison with velocity or shear rate reductions. Math. Comput. Simul. 72, 108–112 10.1016/j.matcom.2006.05.025 (doi:10.1016/j.matcom.2006.05.025) [DOI] [Google Scholar]
- 16.Chopard B, Ouared R, Ruefenacht DA, Yilmax H. 2007. Lattice Boltzmann modeling of thrombosis in giant aneurysms. Int. J. Mod. Phys. C 18, 712. 10.1142/S0129183107010978 (doi:10.1142/S0129183107010978) [DOI] [Google Scholar]
- 17.Bedekar AS, Pant K, Ventikos Y, Sundaram S. 2005. A computational model combining vascular biology and haemodynamics for thrombosis prediction in anatomically accurate cerebral aneurysms. Food Bioprod. Process. 83, 118–126 10.1205/fbp.05020 (doi:10.1205/fbp.05020) [DOI] [Google Scholar]
- 18.Ventikos Y, Bowker TJ, Watton PN, Kakalis NMP, Byrne JV. 2009. Risk evaluation and interventional planning for cerebral aneurysms: computational models for growth, coiling and thrombosis. Int. J. Comput. Fluid Dyn. 23, 595–607 10.1080/10618560902758594 (doi:10.1080/10618560902758594) [DOI] [Google Scholar]
- 19.Hund SJ, Antaki JF. 2009. An extended convection diffusion model for red blood cell-enhanced transport of thrombocytes and leukocytes. Phys. Med. Biol. 54, 6415. 10.1088/0031-9155/54/20/024 (doi:10.1088/0031-9155/54/20/024) [DOI] [PMC free article] [PubMed] [Google Scholar]
- 20.Eckstein EC, Belgacem F. 1991. Model of platelet transport in flowing blood with drift and diffusion terms. Biophys. J. 60, 53–69 10.1016/S0006-3495(91)82030-6 (doi:10.1016/S0006-3495(91)82030-6) [DOI] [PMC free article] [PubMed] [Google Scholar]
- 21.Zydney AL, Colton CK. 1988. Augmented solute transport in the shear flow of a concentrated suspension. PCH PhysicoChem. Hydrodyn. 10, 77 [Google Scholar]
- 22.Sorensen EN, Burgreen GW, Wagner WR, Antaki JF. 1999. Computational simulation of platelet deposition and activation. I. Model development and properties. Ann. Biomed. Eng. 27, 436–448 10.1114/1.200 (doi:10.1114/1.200) [DOI] [PubMed] [Google Scholar]
- 23.Turitto VT, Benis AM, Leonard EF. 1972. Platelet diffusion in flowing blood. Ind. Eng. Chem. Fund. 11, 216–223 [Google Scholar]
- 24.Jordan A, David T, Homer-Vanniasinkam S, Graham A, Walker P. 2004. The effects of margination and red cell augmented platelet diffusivity on platelet adhesion in complex flow. Biorheology 41, 641–653 [PubMed] [Google Scholar]
- 25.Crowl L, Fogelson AL. 2011. Analysis of mechanisms for platelet near-wall excess under arterial blood flow conditions. J. Fluid Mech. 676, 348–375 10.1017/jfm.2011.54 (doi:10.1017/jfm.2011.54) [DOI] [Google Scholar]
- 26.Crowl LM, Fogelson AL. 2010. Computational model of whole blood exhibiting lateral platelet motion induced by red blood cells. Int. J. Numer. Methods Biomed. Eng. 26, 471–487 10.1002/cnm.1274 (doi:10.1002/cnm.1274) [DOI] [PMC free article] [PubMed] [Google Scholar]
- 27.Reasor DA, Mehrabadi M, Ku DN, Aidun CK. 2013. Determination of critical parameters in platelet margination. Ann. Biomed. Eng. 41, 238–249 10.1007/s10439-012-0648-7 (doi:10.1007/s10439-012-0648-7) [DOI] [PubMed] [Google Scholar]
- 28.Satoshi, Sugiyama K, Takagi S, Matsumoto Y. 2012. A computational blood flow analysis in a capillary vessel including multiple red blood cells and platelets. J. Biomech. Sci. Eng. 7, 72–83 10.1299/jbse.7.72 (doi:10.1299/jbse.7.72) [DOI] [Google Scholar]
- 29.Succi S. 2001. The lattice Boltzmann equation for fluid dynamics and beyond. Numerical Mathematics and Scientific Computation. Oxford, UK: Oxford University Press [Google Scholar]
- 30.Peskin CS. 2002. The immersed boundary method. Acta Numerica 11, 479–517 10.1017/S0962492902000077 (doi:10.1017/S0962492902000077) [DOI] [Google Scholar]
- 31.Tahir H, Hoekstra AG, Lorenz E, Lawford PV, Hose DR, Gunn J, Evans DJW. 2011. Multi-scale simulations of the dynamics of in-stent restenosis: impact of stent deployment and design. Interface Focus 1, 365–373 10.1098/rsfs.2010.0024 (doi:10.1098/rsfs.2010.0024) [DOI] [PMC free article] [PubMed] [Google Scholar]
- 32.Ouared R, Chopard B, Stahl B, Rufenacht D, Yilmaz H, Courbebaisse G. 2008. Thrombosis modeling in intracranial aneurysms: a lattice Boltzmann numerical algorithm. Comput. Phys. Commun. 179, 128–131 10.1016/j.cpc.2008.01.021 (doi:10.1016/j.cpc.2008.01.021) [DOI] [Google Scholar]
- 33.Artoli AM, Hoekstra AG, Sloot PMA. 2006. Mesoscopic simulations of systolic flow in the human abdominal aorta. J. Biomech. 39, 873–884 10.1016/j.jbiomech.2005.01.033 (doi:10.1016/j.jbiomech.2005.01.033) [DOI] [PubMed] [Google Scholar]
- 34.Axner L, Hoekstra A, Jeays A, Lawford P, Hose R, Sloot P. 2009. Simulations of time harmonic blood flow in the mesenteric artery: comparing finite element and lattice Boltzmann methods. BioMed. Eng. OnLine 8, 23. 10.1186/1475-925X-8-23 (doi:10.1186/1475-925X-8-23) [DOI] [PMC free article] [PubMed] [Google Scholar]
- 35.Bagchi P. 2007. Mesoscale simulation of blood flow in small vessels. Biophys. Journal. 92, 1858–1877 10.1529/biophysj.106.095042 (doi:10.1529/biophysj.106.095042) [DOI] [PMC free article] [PubMed] [Google Scholar]
- 36.Zhang J, Johnson PC, Popel AS. 2008. Red blood cell aggregation and dissociation in shear flows simulated by lattice Boltzmann method. J. Biomech. 41, 47–55 10.1016/j.jbiomech.2007.07.020 (doi:10.1016/j.jbiomech.2007.07.020) [DOI] [PMC free article] [PubMed] [Google Scholar]
- 37.Shi L, Pan TW, Glowinski R. 2012. Deformation of a single red blood cell in bounded Poiseuille flows. Phys. Rev. E 85, 016307. 10.1103/PhysRevE.85.016307 (doi:10.1103/PhysRevE.85.016307) [DOI] [PubMed] [Google Scholar]
- 38.Kaoui B, Krüger T, Harting J. 2012. How does confinement affect the dynamics of viscous vesicles and red blood cells? Soft Matter 8, 9246–9252 10.1039/c2sm26289d (doi:10.1039/c2sm26289d) [DOI] [Google Scholar]
- 39.Doddi SK, Bagchi P. 2009. Three-dimensional computational modeling of multiple deformable cells flowing in microvessels. Phys. Rev. E 79, 046318. 10.1103/PhysRevE.79.046318 (doi:10.1103/PhysRevE.79.046318) [DOI] [PubMed] [Google Scholar]
- 40.Kameneva MV, Watach MJ, Borovetz HS. 1999. Gender difference in rheologic properties of blood and risk of cardiovascular diseases. Clin. Hemorheol. Microcirc. 21, 357–363 [PubMed] [Google Scholar]
- 41.Yeh C, Eckstein EC. 1994. Transient lateral transport of platelet-sized particles in flowing blood suspensions. Biophys. J. 66, 1706–1716 10.1016/S0006-3495(94)80962-2 (doi:10.1016/S0006-3495(94)80962-2) [DOI] [PMC free article] [PubMed] [Google Scholar]
- 42.Lorenz E, Mountrakis L, Hoekstra AG. In preparation. [Google Scholar]
- 43.Popel AS, Johnson PC. 2005. Microcirculation and hemorheology. Annu. Rev. Fluid Mech. 37, 43–69 10.1146/annurev.fluid.37.042604.133933 (doi:10.1146/annurev.fluid.37.042604.133933) [DOI] [PMC free article] [PubMed] [Google Scholar]
- 44.Dhar S, Tremmel M, Mocco J, Kim M, Yamamoto J, Siddiqui AH, Hopkins LN, Meng H. 2008. Morphology parameters for intracranial aneurysm rupture risk assessment. Neurosurgery 63, 185–197 10.1227/01.NEU.0000316847.64140.81 (doi:10.1227/01.NEU.0000316847.64140.81) [DOI] [PMC free article] [PubMed] [Google Scholar]
- 45.Weir B, Amidei C, Kongable G, Findlay JM, Kassell NF, Kelly J, Dai L, Karrison TG. 2003. The aspect ratio (dome/neck) of ruptured and unruptured aneurysms. J. Neurosurg. 99, 447–451 10.3171/jns.2003.99.3.0447 (doi:10.3171/jns.2003.99.3.0447) [DOI] [PubMed] [Google Scholar]
- 46.Avolio AP. 1980. Multi-branched model of the human arterial system. Med. Biol. Eng. Comput. 18, 709–718 10.1007/BF02441895 (doi:10.1007/BF02441895) [DOI] [PubMed] [Google Scholar]
- 47.Fåhræus R, Lindqvist T. 1931. The viscosity of the blood in narrow capillary tubes. Am. J. Physiol. Legacy Content 96, 562–568 [Google Scholar]
- 48.Zhao H, Shaqfeh ESG. 2011. Shear-induced platelet margination in a microchannel. Phys. Rev. E 83, 061924. 10.1103/PhysRevE.83.061924 (doi:10.1103/PhysRevE.83.061924) [DOI] [PubMed] [Google Scholar]
- 49.Segre G, Silberberg A. 1962. Behaviour of macroscopic rigid spheres in Poiseuille flow. II. Experimental results and interpretation. J. Fluid Mech. 14, 136–157 10.1017/S0022112062001111 (doi:10.1017/S0022112062001111) [DOI] [Google Scholar]
- 50.Dünweg B, Ladd AJC. 2009. Lattice Boltzmann simulations of soft matter systems. In Advanced Computer Simulation Approaches for Soft Matter Sciences III, vol. 221 (eds. Holm C, Kremer K.), pp. 89–166 Advances in Polymer Science Berlin, Heidelberg: Springer [Google Scholar]
- 51.Alkhamis TM, Beissinger RL, Chediak JR. 1988. Red blood cell effect on platelet adhesion and aggregation in low-stress shear flow. Myth or fact? ASAIO Trans. 34, 868–873 [PubMed] [Google Scholar]
- 52.Watson T, Shantsila E, Lip GYH. 2009. Mechanisms of thrombogenesis in atrial fibrillation: Virchow's triad revisited. Lancet 373, 155–166 10.1016/S0140-6736(09)60040-4 (doi:10.1016/S0140-6736(09)60040-4) [DOI] [PubMed] [Google Scholar]
- 53.Yang Y, Koo S, Lin CSS, Neu B. 2010. Specific binding of red blood cells to endothelial cells is regulated by nonadsorbing macromolecules. J. Biol. Chem. 285, 40 489–40 495 10.1074/jbc.M110.116608 (doi:10.1074/jbc.M110.116608) [DOI] [PMC free article] [PubMed] [Google Scholar]
- 54.van Gils JM, Zwaginga JJ, Hordijk PL. 2009. Molecular and functional interactions among monocytes, platelets, and endothelial cells and their relevance for cardiovascular diseases. J. Leukoc. Biol. 85, 195–204 10.1189/jlb.0708400 (doi:10.1189/jlb.0708400) [DOI] [PubMed] [Google Scholar]


