Abstract
Perturbations to the homeostatic distribution of mechanical forces exerted by blood on the endothelial layer have been correlated with vascular pathologies, including intracranial aneurysms and atherosclerosis. Recent computational work suggests that, in order to correctly characterize such forces, the shear-thinning properties of blood must be taken into account. To the best of our knowledge, these findings have never been compared against experimentally observed pathological thresholds. In this work, we apply the three-band diagram (TBD) analysis due to Gizzi et al. (Gizzi et al. 2011 Three-band decomposition analysis of wall shear stress in pulsatile flows. Phys. Rev. E 83, 031902. (doi:10.1103/PhysRevE.83.031902)) to assess the impact of the choice of blood rheology model on a computational model of the right middle cerebral artery. Our results show that, in the model under study, the differences between the wall shear stress predicted by a Newtonian model and the well-known Carreau–Yasuda generalized Newtonian model are only significant if the vascular pathology under study is associated with a pathological threshold in the range 0.94–1.56 Pa, where the results of the TBD analysis of the rheology models considered differs. Otherwise, we observe no significant differences.
Keywords: blood flow modelling, rheology, multi-scale modelling, lattice Boltzmann, three-band diagram analysis
1. Introduction
Physiology and medicine are being revolutionized by the growing role of information technology. Our ability to acquire and manage data on both animals and humans allows us to develop increasingly detailed computational models of the biological processes sustaining life. These models, together with the relevant experimental data, are helping researchers to gain insight into the physiology and the pathology of the systems under study, in many cases beyond what is possible with purely observational methods.
Cerebrovascular disorders, including intracranial aneurysms (ICAs) that may rupture leading to subarachnoid haemorrhages, are one of the most prevalent and devastating diseases of adults, and are of worldwide concern. In the UK, the total burden has been estimated as £0.5 billion annually [1]. It is currently generally accepted that haemodynamics plays an important role in the appearance, evolution and potential rupture of these types of vascular pathologies [2,3]. More precisely, perturbations in the homeostatic distribution of mechanical forces exerted by the blood on the endothelial layer have been correlated not only with aneurysm initiation and rupture but also with the development of other vascular pathologies, such as atherosclerosis [4].
From a rheological point of view, blood is a shear-thinning fluid. This behaviour arises from the presence of red blood cells suspended in a medium known as blood plasma. Despite this fact, a large body of literature concerning computational haemodynamics characterizes blood as a Newtonian fluid under the assumption that in large arteries the shear rate is large enough for the viscosity to be treated as effectively constant [5].
There has been increasing interest during recent years in the comparison of blood rheology models using computational fluid dynamics (CFD) simulations in realistic computational domains reconstructed from medical images. These studies have been performed both in healthy vasculature [6–8] and in the presence of aneurysms [9–11]. In particular, authors pay special attention to the influence of the choice of rheology model on the computational estimates of wall shear stress (WSS) as a proxy for aneurysm rupture risk. It has been suggested that, in ICAs, the Newtonian simplification overestimates WSS [9,12] and may underestimate rupture risk. Furthermore, it has been argued that applications requiring accurate WSS estimates (e.g. those concerning vascular remodelling and biomechanics) will suffer from modelling inaccuracy unless the generalized Newtonian (GN) properties of blood are taken into account.
Different indices have been proposed as a way of integrating into CFD-based biomarkers of rupture risk the rich spatio-temporal structure of WSS induced by pulsatile flow in complex vascular networks. Minimal or maximal peak WSS, time-averaged WSS and oscillatory shear index (OSI) [13] have been extensively used, among others. In many of the studies cited previously, comparisons are performed based on colour map plots, of one or more of these indices, on the surface of the original computational domain. Differences between WSS estimates produced by different rheology models are hence presented in a very qualitative way. Furthermore, the link to actual rupture risk is based on the currently accepted low shear stress biomarker, but with no actual correlation with experimentally determined WSS thresholds. Several authors [14,15] have recently criticized this approach to rupture risk quantification, arguing that more quantitative methods are required in order to gain further insight into the problem.
In 2011, Gizzi et al. [16] proposed a new framework for the quantitative analysis of WSS: the so-called three-band diagram (TBD) analysis. The TBD analysis facilitates the evaluation of the WSS obtained at a given location over time (i.e. a WSS signal) against a range of WSS pathological thresholds (e.g. WSS magnitude lower than 0.5 Pa as reported in the case of atherosclerosis formation [4]). The analysis determines how likely a given WSS signal is to be considered risky for any given threshold. Furthermore, the results of the analysis can be easily compared against pathological values of WSS observed experimentally.
In this work, we apply TBD analysis to assess the impact of the choice of blood rheology model on the WSS estimates of the HemeLB [17] lattice Boltzmann blood flow solver in a high-resolution three-dimensional model of the right middle cerebral artery (MCA). The rest of the paper is structured as follows: §2 introduces the computational and mathematical models used in this work as well as the simulation workflow implemented; §3 presents the results of our simulation and their main implications; finally, §4 summarizes the main conclusions of the work and outlines future research directions.
2. Material and methods
2.1. Three-dimensional model of the middle cerebral artery
2.1.1. Geometry generation
The three-dimensional model of the MCA used in this work (figure 1) is a subset of a geometrical model of the intracranial vasculature reconstructed from rotational angiography scans. It corresponds to a section of the right MCA in the vicinity of the internal carotid artery. The main geometrical features of the model are (i) vessels of variable diameter, (ii) two bifurcations, and (iii) vessel bending. The National Hospital for Neurology and Neurosurgery, London, UK, provided the original images in the framework of the GENIUS project [18] as part of a larger dataset library. The dataset used in this work was segmented and the surface mesh in figure 1 generated with the open source package Vascular Modelling Toolkit (VMTK) [19].
Figure 1.
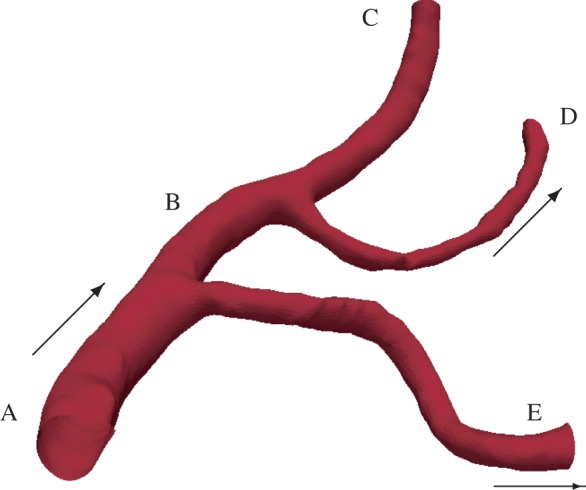
Three-dimensional model of a subset of the right MCA used in this work. Geometry segments are labelled A–E for later reference. The arrows indicate flow direction. (Online version in colour.)
2.1.2. HemeLB
HemeLB [17] is an open source software platform (the codebase is available under LGPL licence from http://ccs.chem.ucl.ac.uk/hemelb) for modelling and simulation of blood flow in sparse vascular networks. It comprises tools for geometrical model preprocessing (i.e. regular grid volume meshing of surface meshes), simulation on massively parallel architectures, real-time visualization and steering and data post-processing. To date, HemeLB has been successfully applied to the simulation of blood flow in healthy brain vasculature as well as in the presence of ICAs. Particular attention has been paid in obtaining and presenting simulation results in a clinically meaningful way [18]. HemeLB uses the lattice Boltzmann method for fluid dynamics [20] as it allows efficient implementations in large-scale high-performance computing infrastructures. For this work, we have developed an extension of HemeLB's lattice Bhatnagar–Gross–Krook (LBGK) collision operator in order to accommodate both Newtonian and GN rheology models. We use the D3Q15 velocity set and the halfway bounce-back rule [20] to enforce the no-slip boundary condition at the walls. We have recently shown [21] that this combination of collision operator, velocity set and wall boundary condition performs well from both a numerical and a computational point of view in complex domains for typical blood flow Reynolds and Womersley numbers. Our results show that first-order convergence of the velocity field is achieved over a wide range of resolutions and Reynolds numbers.
2.1.3. Generalized Newtonian rheology
The Carreau–Yasuda (CY) model is widely used to describe the shear-thinning behaviour of blood [22,23]. In this model, the dynamic viscosity η is related to the shear rate  through the following expression:
 |
2.1 |
where a, n and λ are empirically determined to fit a curve between regions of constant viscosity η∞ and η0. This model defines three different regimes: a Newtonian region with η0 for low shear rate, followed by a shear-thinning region, where η decreases with  ; finally, once η∞ is reached a third Newtonian region with constant viscosity η∞ is defined for high shear rates. In this work, we will use the parametrization given by Boyd et al. [22]: η0 = 0.16 Pa s, η∞ = 0.0035 Pa s, λ = 8.2 s, a = 0.64 and n = 0.2128 (both are dimensionless).
Figure 2 presents viscosity as a function of shear rate for the previous model and the Newtonian model considered in this work (η = 3.5 × 10⁻³ Pa s). The CY model displays a smooth transition between η0 and η∞. Significant haemodynamic differences between the two rheology models are expected for simulations with  .
.
Figure 2.
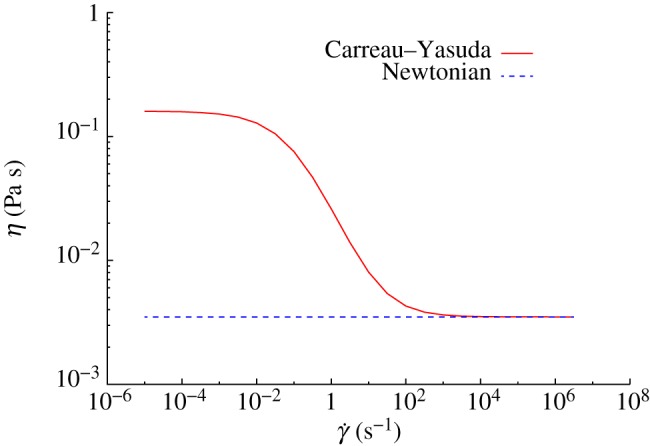
Dynamic viscosity η as a function of shear rate  for the CY and the Newtonian models. (Online version in colour.)
2.2. One-dimensional model of the human vascular system
In order to obtain inlet and outlet boundary conditions for our three-dimensional model, we use a modified version of a one-dimensional model of the human vascular system previously published by Mulder et al. [24]. The original model includes a one-dimensional representation of the main arteries in the upper body (including the circle of Willis and both MCAs) and a zero-dimensional representation of the peripheral vasculature. The geometry is available as part of the open source software package pyNS [25], which also implements a numerical solver for the one-dimensional pulse propagation mathematical model presented by Huberts et al. [26].
The original one-dimensional geometrical model does not include any detail about the vessels branching off the right MCA. Therefore, we modified it to include the two MCA side branches present in the three-dimensional model (figure 1). In order to achieve this, a one-dimensional characterization of the three-dimensional geometry was required. The open source software package VMTK was used to compute: (i) the length of the centrelines associated with segments A–E in figure 1 and (ii) the radii of the maximum inscribed spheres along the centrelines. Table 1 summarizes the results; and figure 3 shows a schematic of the one-dimensional model, including the more detailed representation of the right MCA. The reader is referred to Mulder et al. [24] or the pyNS tool for the names and characteristics (e.g. length, radius and connectivity) of each of the segments of the vascular system.
Table 1.
Geometrical characterization of the three-dimensional model used in this work.
| segment | length (mm) | proximal end radius (mm) | distal end radius (mm) |
|---|---|---|---|
| A | 8.9 | 1.30 | 1.25 |
| B | 11.2 | 1.25 | 1.10 |
| C | 13.6 | 1.10 | 0.85 |
| D | 20.6 | 0.62 | 0.62 |
| E | 21.1 | 0.77 | 0.77 |
Figure 3.
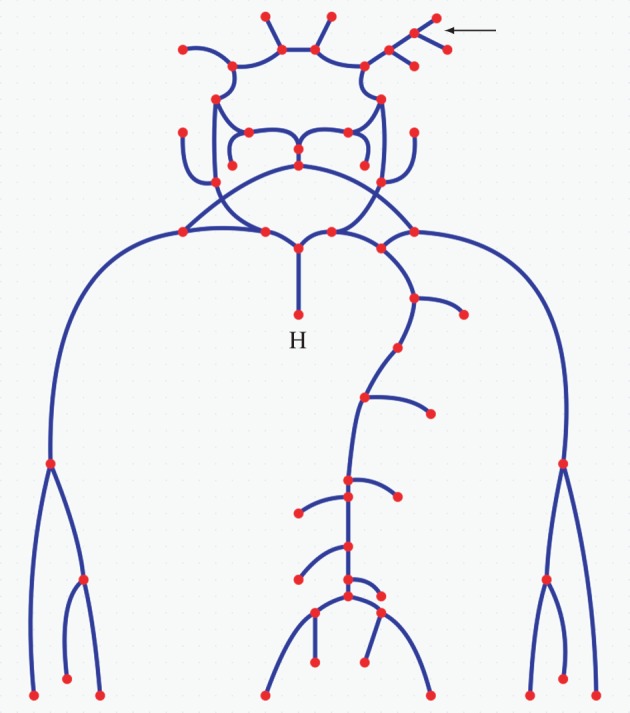
One-dimensional model of the main arteries in the upper body. Each segment (solid line) represents a different part of a human arterial system including characterization of the three-dimensional model of the right MCA in figure 1 (see top right arrow). Segment lengths are not to scale. The dots represent (i) bifurcations, when found at the intersection of two or more segments, (ii) zero-dimensional representations of the peripheral vasculature, when found at the end of an open-ended segment, or (iii) the heart in the case labelled with H. (Online version in colour.)
2.3. Three-band diagram analysis
The extraction of synthetic biomarkers of aneurysm rupture risk based on CFD analysis of patient-specific models is an active field of research. The TBD analysis framework was proposed [16] as a way of generalizing previously proposed indices (e.g. time-averaged WSS and OSI) and providing a quantitative way of comparing temporal WSS signals against specific risk factors.
Let t be the instantaneous traction vector at an arbitrary surface point with associated surface unit normal  such that
| 2.2 |
where T is the deviatoric part of the full stress tensor of a fluid computed from the mesoscopic lattice Boltzmann simulation variables as described by Krüger et al. [27]. The relationship between T and σ, the full stress tensor, is
| 2.3 |
where P is the hydrodynamic pressure and δ the usual Kronecker delta tensor. Furthermore, for a GN incompressible fluid, T can be rewritten as
| 2.4 |
where S is the shear rate tensor
| 2.5 |
η is the dynamic viscosity of a fluid as a function of shear rate  (see equation (2.1)) and v is the velocity vector. In the case of Newtonian fluids,
In this work, we will consider the temporal evolution of the signed magnitude of the traction vector t (which we will refer to as the WSS signal), i.e.
| 2.6 |
where  is the average traction vector over time, sgn is the sign function and |·| is the magnitude of a given vector.
Given a WSS signal, S(t), and a scalar risk factor σ ≥ 0, the TBD analysis defines a triplet of functions
| 2.7 |
| 2.7 |
| 2.7 |
where the Heaviside function H(x) is defined as H(x) = 1 if x > 0 and H(x) = 0 if x < 0. The closed support of the function S+ is a set of time intervals of cardinality N+(σ) (and similarly with S0 and S−). The main idea behind the method is to inspect the number of such intervals as a function of the variable threshold σ (i.e. the risk factor). It has been suggested that a WSS signal can be considered healthy if N+,0,−(σ) > 0 for a given risk factor σ. The reader is referred to the study by Gizzi et al. [16] for a more detailed description of the method. A Python implementation of the algorithm is freely available as part of HemeLB's post-processing tools.
2.4. Simulation workflow
Our simulation workflow is as follows. First, the original DICOM images were segmented, a region of interest was chosen, and a surface mesh was generated with the VMTK implementation of the marching cubes algorithm. A non-shrinking Taubin filter was then applied to smooth out imaging artefacts. Second, we loaded the resulting surface mesh in HemeLB's set-up tool in order to choose the location of the inlet and the outlets and generate a regular grid discretization of the volume enclosed by the surface (with a total of 4 161 046 grid points). Next, the pyNS solver was run to obtain pressure traces at inlet A and oulets C–E in figure 1. We then used these traces as inlet and outlet boundary conditions to run HemeLB simulations with both the Newtonian and CY rheology models for a total of three cardiac cycles. Note that, for flow in a domain with open boundaries, one must decide whether to close the system with pressure or flow rate boundary conditions. The former case ensures that the same pressure drop occurs regardless of the rheology model chosen but sacrifices the Reynolds number parity as a mathematical necessity. The latter would ensure that the same Reynolds number is recovered but different pressure drops occur. We chose to impose pressure boundary conditions as obtained from the one-dimensional simulations.
The following configuration parameters were used in this work: time step Δt = 2.5706 × 10⁻⁶ s, space step Δx = 3.50 × 10⁻⁵ m, maximum density difference in the domain Δρ/ρ0 = 0.019, Mach numbers (defined as the ratio between the largest velocity magnitude in the domain and lattice speed of sound  ) 0.31 and 0.244 for the Newtonian and CY rheology models, respectively, and LBGK relaxation parameter τ = 0.522 for the Newtonian model and
  for the CY model (which becomes τ = 0.522 for η∞). Finally, we post-processed the simulation results to compute TBDs of the WSS signal at different geometrical locations over time. Table 2 shows their location for reproducibility purposes.
Table 2.
Three-band diagram analysis sampling points.
| point | coordinates (mm) |
|---|---|
| x1 | (11.38, 36.89, 45.17) |
| x2 | (10.98, 41.64, 47.97) |
| x3 | (12.77, 41.15, 45.02) |
| x4 | (12.34, 42.69, 46.17) |
| x5 | (11.88, 50.29, 41.31) |
| x6 | (11.59, 50.55, 49.19) |
| x7 | (12.89, 55.45, 44.75) |
| x8 | (12.82, 55.33, 45.58) |
| x9 | (14.57, 55.73, 52.63) |
The pyNS simulations were run on a single core of a 2 GHz Intel Core i7 laptop with 4 GB of RAM and took of the order of minutes to run. The HemeLB simulations were run on 2048 cores of HECToR (the UK's national supercomputer) and took 53 min and 83 min for the Newtonian and CY models, respectively. The difference in computing time between the two rheology models is due to the cost associated with computing  and evaluating equation (2.1) at each lattice site every time step. The choice of core count is based on the number of lattice sites and the scalability analysis presented by Groen et al. [28] in order to ensure efficient use of the computational resources.
All the files required to run the pyNS and HemeLB simulations are available as part of the electronic supplementary material associated with this paper. Both software packages are open source and freely available to the public.
3. Results and discussion
3.1. Pressure profiles
Figure 4 plots the pressure traces generated by pyNS at inlet A and outlets C–E of figure 3. It can be seen how the typical pressure variations observed throughout the cardiac cycle are well recovered. First, the sudden increase in pressure following the opening of the aortic valve after approximately 0.06 s, which peaks at around 0.2 s and drops until approximately 0.4 s, corresponds to the ventricular ejection phase. Second, the isovolumic relaxation phase happens between the previous time point and the mitral valve opening around 0.55 s. Finally, the ventricular filling phase occurs between the time the mitral valve opens and the end of the cycle at approximately 0.91 s (for a cardiac rate of roughly 66 beats per minute).
Figure 4.
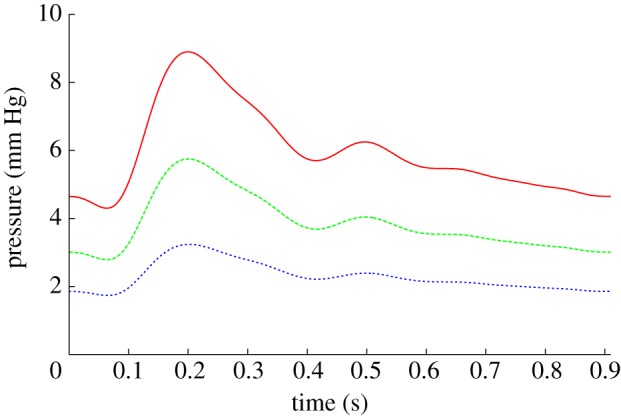
Pressure differentials, relative to outlet D, obtained from the one-dimensional model at the inlet and outlets. Simulations were run for a total of three cardiac cycles. Inlet A, solid line; outlet C, dashed line; outlet E, dotted line. (Online version in colour.)
3.2. Three-dimensional simulations and three-band diagram analysis
Figure 5 plots the traction vector t computed with HemeLB configured to use the CY rheology model at the end of diastole and at peak flow in systole (both in the third cardiac cycle simulated). The direction of t (which is consistent with the flow direction at any given point) and its magnitude follow a complex distribution throughout the domain with notable changes during the cardiac cycle. The main characteristics are (i) areas with larger WSS can be found in the interior side of both branches leaving the bifurcation, (ii) a zone of low WSS, or stagnation point, is found around the area where both branches meet, and (iii) there are substantial changes in the direction of t throughout the cardiac cycle around the stagnation point area, leading to oscillatory WSS signals.
Figure 5.
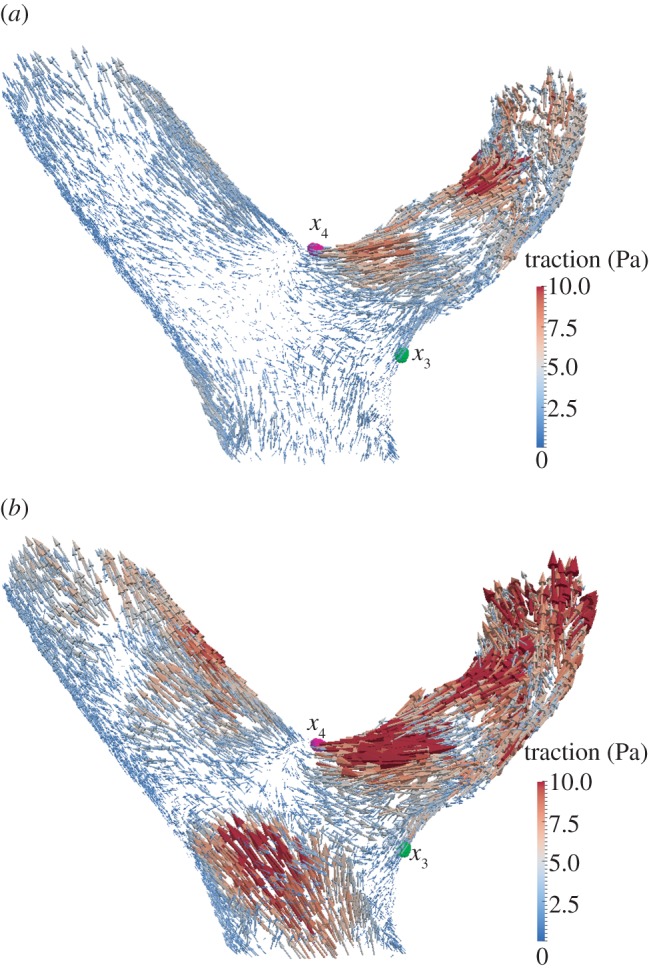
Traction vector t (estimated with the CY rheology model) at the upstream bifurcation of the three-dimensional model. Vectors are scaled according to their magnitude. Points x3 and x4 in table 2 are shown in green and magenta, respectively. Visualizations generated with the open source software package ParaView [29]. (a) End of diastole t = 1.82 s; (b) peak flow during systole t = 1.97 s.
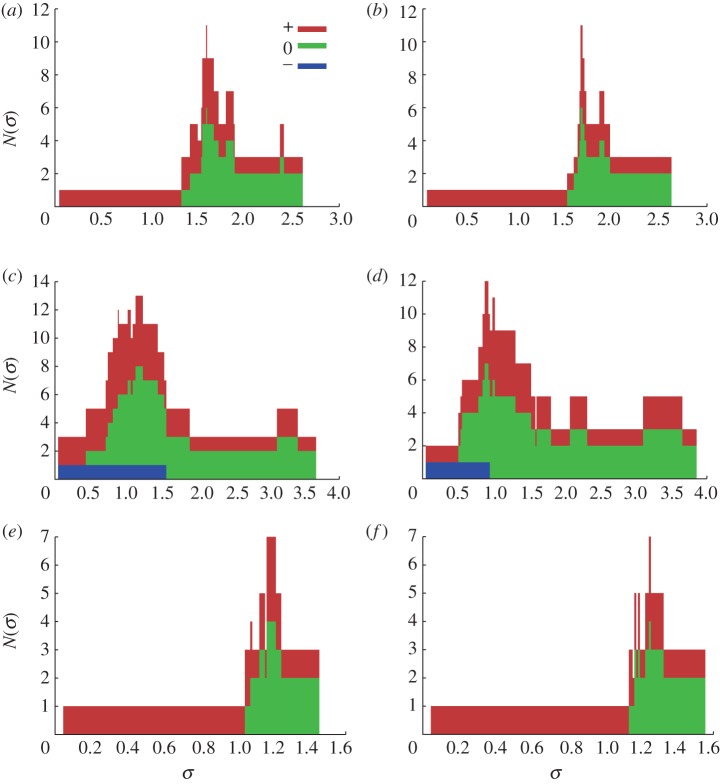
Figure 6 presents the TBD analysis at points x3, x4 and x5. The analysis confirms the change of sign of the WSS signal (due to a change of direction in the traction field) occuring at x4 throughout the cardiac cycle (note the presence of a negative component in figure 6c,d). Furthermore, the negative component covers a wider range of threshold values in the Newtonian case. According to the criteria outlined by Gizzi et al. [16], an oscillatory WSS signal is considered healthy when the TBD analysis displays all three components above a given critical threshold. In this case, we observe a variation of just over 0.5 Pa between the predicted largest healthy threshold in the Newtonian and CY cases.
Figure 6.
TBD analysis at points x3, x4 and x5. The values of N−,0,+(σ) are presented as a stacked histogram. (a) Newtonian TBD at x3, (b) CY TBD at x3, (c) Newtonian TBD at x4, (d) CY TBD at x4, (e) Newtonian TBD at x5, and (f) CY TBD at x5.
In the case of x3 and x5, no negative component appears in the analysis, indicating that there is no oscillation in the WSS signal. This rules out one of the main factors correlated with vascular disorders: oscillatory flow [13]. Nevertheless, such signals could still be considered risky if their mean value was below a given threshold value [3]. We can clearly view in figure 6a,b,e,f that the choice of rheology model would not have a significant impact on the assessment of risk as both diagrams are nearly identical.
The points listed in table 2 which have not been analysed in figure 6 fall within one of the two previous scenarios.
4. Conclusions
In this work, we present a complete workflow for the simulation of blood flow in a patient-specific three-dimensional model of the right MCA. The main features of the model are (i) the geometry is reconstructed from rotational angiography scans and discretized at high resolution (Δx = 3.5 × 10⁻⁵ m), (ii) inlet and outlet boundary conditions are obtained with a one-dimensional model of the complete vascular system, and (iii) the rheological properties of the blood can be described with both Newtonian and GN models. Simulations run efficiently on the HECToR supercomputer taking 53–83 min for a domain comprising 4 161 046 lattice sites.
The workflow is applied to the comparison of two blood rheology models: a Newtonian model (η = 3.5 × 10⁻³ Pa s) and the CY model. This is done in a quantitative manner in conjunction with the proposed TBD analysis framework. In agreement with previous work [6,9], our results show variations in the haemodynamics recovered with each of the rheology models studied. However, the evaluation of those results against a set of risk factors with a TBD shows little to no difference. In particular, a WSS signal with a strong oscillatory component was found to be risky for thresholds greater than or equal to 1.56 and 0.94 Pa for the Newtonian and CY models, respectively. In the case of non-oscillatory signals, the analysis returns almost identical results in both cases.
The main limitations of our study are (i) we have used a single geometry—in order to achieve statistical significance a larger number of other cases must be considered—and (ii) the results presented may not hold in the presence of ICAs or other vascular malformations, where regions of much smaller shear rate may occur.
Our future lines of work include applying the analysis methodology presented in the current work to a set of ICAs reconstructed from rotational angiography images. We also plan to investigate the coupling of the current one- to three-dimensional haemodynamics model with agent-based models of tissue remodelling using the multi-scale modelling framework presented by Groen et al. [30].
Acknowledgements
This work made use of HECToR, the UK's national high-performance computing service, funded by the Office of Science and Technology through EPSRC's High-End Computing Programme. We also thank Dr Simone Manini for support using the pyNS software. This work was supported by the British Heart Foundation, EPSRC grants ‘Large Scale Lattice Boltzmann for Biocolloidal Systems’ (EP/I034602/1) and 2020 Science (http://www.2020science.net/, EP/I017909/1), and the EC-FP7 projects CRESTA (http://www.cresta-project.eu/, grant no. 287703) and MAPPER (http://www.mapper-project.eu/, grant no. 261507).
References
- 1.Rivero-Arias O, Gray A, Wolstenholme J. 2010. Burden of disease and costs of aneurysmal subarachnoid haemorrhage (aSAH) in the United Kingdom. Cost Effectiveness Resour. Allocation 8, 6. 10.1186/1478-7547-8-6 (doi:10.1186/1478-7547-8-6) [DOI] [PMC free article] [PubMed] [Google Scholar]
- 2.Stehbens WE. 1989. Etiology of intracranial berry aneurysms. J. Neurosurg. 70, 823–831 10.3171/jns.1989.70.6.0823 (doi:10.3171/jns.1989.70.6.0823) [DOI] [PubMed] [Google Scholar]
- 3.Shojima M, Oshima M, Takagi K, Torii R, Hayakawa M, Katada K, Morita A, Kirino T. 2004. Magnitude and role of wall shear stress on cerebral aneurysm. Stroke 35, 2500–2505 10.1161/01.STR.0000144648.89172.0f (doi:10.1161/01.STR.0000144648.89172.0f) [DOI] [PubMed] [Google Scholar]
- 4.Chatzizisis YS, et al. 2008. Prediction of the localization of high-risk coronary atherosclerotic plaques on the basis of low endothelial shear stress. Circulation 117, 993–1002 10.1161/CIRCULATIONAHA.107.695254 (doi:10.1161/CIRCULATIONAHA.107.695254) [DOI] [PubMed] [Google Scholar]
- 5.Mejia J, Mongrain R, Bertrand OF. 2011. Accurate prediction of wall shear stress in a stented artery: Newtonian versus non-Newtonian models. J. Biomech. Eng. 133, 074501. 10.1115/1.4004408 (doi:10.1115/1.4004408) [DOI] [PubMed] [Google Scholar]
- 6.Morbiducci U, Gallo D, Massai D, Ponzini R, Deriu MA, Antiga L, Redaelli A, Montevecchi FM. 2011. On the importance of blood rheology for bulk flow in hemodynamic models of the carotid bifurcation. J. Biomech. 44, 2427–2438 10.1016/j.jbiomech.2011.06.028 (doi:10.1016/j.jbiomech.2011.06.028) [DOI] [PubMed] [Google Scholar]
- 7.Box FMA, van der Geest RJ, Rutten MCM, Reiber JHC. 2005. The influence of flow, vessel diameter, and non-Newtonian blood viscosity on the wall shear stress in a carotid bifurcation model for unsteady flow. Invest. Radiol. 40, 277–294 10.1097/01.rli.0000160550.95547.22 (doi:10.1097/01.rli.0000160550.95547.22) [DOI] [PubMed] [Google Scholar]
- 8.Johnston BM, Johnston PR, Corney S, Kilpatrick D. 2004. Non-Newtonian blood flow in human right coronary arteries: steady state simulations. J. Biomech. 37, 709–720 10.1016/j.jbiomech.2003.09.016 (doi:10.1016/j.jbiomech.2003.09.016) [DOI] [PubMed] [Google Scholar]
- 9.Bernsdorf J, Wang D. 2009. Non-Newtonian blood flow simulation in cerebral aneurysms. Comput. Math. Appl. 58, 1024–1029 10.1016/j.camwa.2009.02.019 (doi:10.1016/j.camwa.2009.02.019) [DOI] [Google Scholar]
- 10.Cavazzuti M, Atherton MA, Collins MW, Barozzi GS. 2011. Non-Newtonian and flow pulsatility effects in simulation models of a stented intracranial aneurysm. Proc. Inst. Mech. Eng. H J. Eng. Med. 225, 597–609 10.1177/09544119JEIM894 (doi:10.1177/09544119JEIM894) [DOI] [PubMed] [Google Scholar]
- 11.Fisher C, Rossmann J. 2009. Effect of non-Newtonian behavior on hemodynamics of cerebral aneurysms. J. Biomech. Eng. 131, 091004. 10.1115/1.3148470 (doi:10.1115/1.3148470) [DOI] [PubMed] [Google Scholar]
- 12.Xiang J, Tremmel M, Kolega J, Levy EI, Natarajan SK, Meng H. 2012. Newtonian viscosity model could overestimate wall shear stress in intracranial aneurysm domes and underestimate rupture risk. J. Neurointerventional Surg. 4, 351–357 10.1136/neurintsurg-2011-010089 (doi:10.1136/neurintsurg-2011-010089) [DOI] [PubMed] [Google Scholar]
- 13.Ku DN, Giddens DP, Zarins CK, Glagov S. 1985. Pulsatile flow and atherosclerosis in the human carotid bifurcation. Positive correlation between plaque location and low oscillating shear stress. Arterioscler. Thromb. Vasc. Biol. 5, 293–302 10.1161/01.ATV.5.3.293 (doi:10.1161/01.ATV.5.3.293) [DOI] [PubMed] [Google Scholar]
- 14.Kallmes D. 2012. Point: CFD—computational fluid dynamics or confounding factor dissemination. AJNR Am. J. Neuroradiol. 33, 395–396 10.3174/ajnr.A2993 (doi:10.3174/ajnr.A2993) [DOI] [PMC free article] [PubMed] [Google Scholar]
- 15.Cebral J, Meng H. 2012. Counterpoint: realizing the clinical utility of computational fluid dynamics—closing the gap. AJNR Am. J. Neuroradiol. 33, 396–398 10.3174/ajnr.A2994 (doi:10.3174/ajnr.A2994) [DOI] [PMC free article] [PubMed] [Google Scholar]
- 16.Gizzi A, Bernaschi M, Bini D, Cherubini C, Filippi S, Melchionna S, Succi S. 2011. Three-band decomposition analysis of wall shear stress in pulsatile flows. Phys. Rev. E 83, 031902. 10.1103/PhysRevE.83.031902 (doi:10.1103/PhysRevE.83.031902) [DOI] [PubMed] [Google Scholar]
- 17.Mazzeo MD, Coveney PV. 2008. HemeLB: a high performance parallel lattice-Boltzmann code for large scale fluid flow in complex geometries. Comp. Phys. Commun. 178, 894–914 10.1016/j.cpc.2008.02.013 (doi:10.1016/j.cpc.2008.02.013) [DOI] [Google Scholar]
- 18.Mazzeo MD, Manos S, Coveney PV. 2010. In situ ray tracing and computational steering for interactive blood flow simulation. Comp. Phys. Commun. 181, 355–370 10.1016/j.cpc.2009.10.013 (doi:10.1016/j.cpc.2009.10.013) [DOI] [Google Scholar]
- 19.Antiga L, Piccinelli M, Botti L, Ene-Iordache B, Remuzzi A, Steinman D. 2008. An image-based modeling framework for patient-specific computational hemodynamics. Med. Biol. Eng. Comp. 46, 1097–1112 10.1007/s11517-008-0420-1 (doi:10.1007/s11517-008-0420-1) [DOI] [PubMed] [Google Scholar]
- 20.Chen S, Doolen G. 1998. Lattice Boltzmann method for fluid flows. Annu. Rev. Fluid Mech. 30, 329–364 10.1146/annurev.fluid.30.1.329 (doi:10.1146/annurev.fluid.30.1.329) [DOI] [Google Scholar]
- 21.Carver HB, Nash RW, Bernabeu MO, Hetherington J, Groen D, Krüger T, Coveney PV. 2012. Choice of boundary condition and collision operator for lattice-Boltzmann simulation of moderate Reynolds number flow in complex domains. (http://arxiv.org/abs/1211.0205) [DOI] [PubMed]
- 22.Boyd J, Buick JM, Green S. 2007. Analysis of the Casson and Carreau–Yasuda non-Newtonian blood models in steady and oscillatory flows using the lattice Boltzmann method. Phys. Fluids 19, 093103. 10.1063/1.2772250 (doi:10.1063/1.2772250) [DOI] [Google Scholar]
- 23.Ashrafizaadeh M, Bakhshaei H. 2009. A comparison of non-Newtonian models for lattice Boltzmann blood flow simulations. Comput. Math. Appl. 58, 1045–1054 10.1016/j.camwa.2009.02.021 (doi:10.1016/j.camwa.2009.02.021) [DOI] [Google Scholar]
- 24.Mulder G, Bogaerds A, Rongen P, van de Vosse F. 2011. The influence of contrast agent injection on physiological flow in the circle of Willis. Med. Eng. Phys. 33, 195–203 10.1016/j.medengphy.2010.09.021 (doi:10.1016/j.medengphy.2010.09.021) [DOI] [PubMed] [Google Scholar]
- 25.Manini S, Antiga L, Huberts W, Botti L, Remuzzi A. 2012. pyNS, an open source framework for 0D/1D hemodynamic modelling. In 10th Int. Symp. on Biomechanics and Biomedical Engineering Berlin, Germany, 11–14 April 2012. [DOI] [PubMed] [Google Scholar]
- 26.Huberts W, Bode A, Kroon W, Planken R, Tordoir J, van de Vosse F, Bosboom E. 2012. A pulse wave propagation model to support decision-making in vascular access planning in the clinic. Med. Eng. Phys. 34, 233–248 10.1016/j.medengphy.2011.07.015 (doi:10.1016/j.medengphy.2011.07.015) [DOI] [PubMed] [Google Scholar]
- 27.Krüger T, Varnik F, Raabe D. 2009. Shear stress in lattice Boltzmann simulations. Phys. Rev. E 79, 046704. 10.1103/PhysRevE.79.046704 (doi:10.1103/PhysRevE.79.046704) [DOI] [PubMed] [Google Scholar]
- 28.Groen D, Hetherington J, Carver HB, Nash RW, Bernabeu MO, Coveney PV. 2012. Analyzing and modeling the performance of the HemeLB lattice-Boltzmann simulation environment. (http://arxiv.org/abs/1209.3972)
- 29.Henderson A. 2007. The ParaView guide: a parallel visualization application. Clifton Park, NY: Kitware Inc [Google Scholar]
- 30.Groen D, et al. 2013. Flexible composition and execution of high performance, high fidelity multiscale biomedical simulations. Interface Focus 3, 20120087. 10.1098/rsfs.2012.0087 (doi:10.1098/rsfs.2012.0087) [DOI] [PMC free article] [PubMed] [Google Scholar]


