

Abstract
The human immune system has a highly complex, multi-layered structure which has evolved to detect and respond to changes in the internal microenvironment of the body. Recognition occurs at the molecular or submolecular scale, via classical reversible receptor–ligand interactions, and can lead to a response with great sensitivity and speed. Remarkably, recognition is coupled to memory, such that responses are modulated by events which occurred years or even decades before. Although the immune system in general responds differently and more vigorously to stimuli entering the body from the outside (e.g. infections), this is an emergent property of the system: many of the recognition molecules themselves have no inherent bias towards external stimuli (non-self) but also bind targets found within the body (self). It is quite clear that the immune response registers pathophysiological changes in general. Cancer, wounding and chronic tissue injury are some obvious examples. Against this background, the immune system ‘state’ tracks the internal processes of the body, and is likely to encode information regarding both current and past disease processes. Moreover, the distributed nature of most immune responses (e.g. typically involving lymphoid tissue, non-lymphoid tissue, bone marrow, blood, extracellular interstitial spaces, etc.) means that many of the changes associated with immune responses are manifested systemically, and specifically can be detected in blood. This provides a very convenient route to sampling immune cells. We consider two different and complementary ways of querying the human immune ‘state’ using high-dimensional genomic screening methodologies, and discuss the potentials of these approaches and some of the technological and computational challenges to be overcome.
Keywords: transcriptomics, T-cell repertoire, microarray, next generation sequencing
1. Introduction
1.1. The immune system as a biomonitor
The immune system can be regarded as a complex detection system focused on identifying changes within the internal environment made up of the tissues, extracellular spaces and fluids of the body. The primary detectors are receptor complexes on the cell surface, or inside the cell and hence recognition occurs at a molecular scale. Larger scale more general representations made up of a set of many individual molecular changes may develop as an emergent property of the system. For example, recognition of an influenza infection is mediated by many individual interactions between molecular elements of the virus and a large set of receptors (which may include antibody, T-cell receptors and various innate pattern recognition receptors). But the overall outcome is an integrated response aimed at protecting the host from invasion by influenza virus. Although the immune system has presumably evolved primarily to recognize and respond to infectious agents, it is quite clear that the system can respond to an enormous array of physiological and pathological changes in the body, many of non-infectious origin. The immune system can therefore be regarded as a sensitive biomonitor of the body. The ability to read and to interrogate and interpret this biomonitor would provide valuable information for prognosis, diagnosis and stratification of a wide range of diseases. In this article, we outline some of the approaches to system-level analysis of the immune response, using the power of the recent revolution in DNA sequencing and transcriptomics technologies. We focus specifically on the experimental and computational challenges of developing a pipeline which starts with whole unfractionated blood samples, and describe some of our initial experiences of implementing such a pipeline. We argue that the ease with which whole blood RNA sampling can be scaled up for introduction into routine hospital diagnostic services provides a strong rationale for developing such a pipeline despite the complexities introduced by the heterogeneous cellular composition of the samples. However, interpretation of the output of such analysis will require new computational tools which can be applied to large numbers of datasets. This type of analysis will then be able to ‘learn’ new and informative patterns within the data which may not be predicted by our current cell-centric view of physiology and pathology.
1.2. The blood as a window for observing immunity
A unique feature of the immune system is that it has a plastic and moving anatomy, with both the number and location of many types of cells varying with immune state. The blood and lymphatic system serves as a universal conduit through which relevant immune cells can move from tissue to tissue, ultimately homing to the site at which they are required (figure 1). Furthermore, since leucocytes circulate rapidly through all tissues of the body, local changes in tissue micro-environment associated with physiological or pathological changes can influence cells as they transit through the affected tissue. Thus, although blood is not the site of most immunological activity, it may offer a unique window through which to observe the state of the immune system. However, a typical immune response can involve a wide variety of cell types, in both lymphoid and non-lymphoid tissues. This raises two important methodological questions. The first is the extent to which some cell types may be absent from blood altogether and hence may be missed by any analysis which focuses on blood samples. The second is the relative advantages of analysing whole unfractionated blood samples, versus analysis of subpopulations of leucocytes isolated from blood by one of many alternative sorting protocols available. Both these questions are relevant to both global transcriptomic and T-cell repertoire approaches which are discussed in more detail below. In terms of the first question, it is clear that a number of functionally significant cell populations will indeed be under-represented in blood. Tissue macrophages are one obvious example drawn from innate immunity, while plasma B-cells or mucosal associated invariant T-cells are examples from adaptive immunity. Whole blood profiling cannot by itself therefore aim to give a comprehensive view of immunological activity in all compartments of the body. Indeed, in our laboratory we are exploring transcriptional profiling of a variety of biopsy tissue samples to provide complimentary information to the blood profiling [1]. Nevertheless, as a prognostic or diagnostic tool, blood profiling may provide molecular signatures which reflect global patterns of activity associated with specific type of immune responses. For example, even though tissue macrophages are absent from blood, transcriptional changes resulting from cytokine release by macrophages at a site of inflammation may still reveal their activity. In respect to the second question, transcriptional analysis of whole blood samples is clearly not a replacement for detailed transcriptomic analysis of sorted subpopulations of leucocytes. Indeed, the analysis of unfractionated leucocyte populations from blood has some significant limitations. In particular, the analysis of extracts of heterogeneous cell populations loses a whole layer of information linking gene expression profiles to the accumulated knowledge regarding the function of the different subpopulations present. Rebuilding the functional picture of what is happening without this information adds a considerable layer of complexity to the analysis. In addition, gene expression changes occurring in very small subpopulations of cells may be missed in this global approach, since they will be diluted out by changes in larger more common cell types. Whole blood approaches do, however, offer several advantages. The first is scalability within a clinical setting. As discussed in more detail below, the use of RNA collection/stabilization tubes mean that high-quality RNA samples can be obtained by staff with no immunological expertise (e.g. local nursing staff within a hospital setting) and with minimum investment of additional time and effort. This is in fact a crucial factor in studies requiring collection of large numbers of longitudinal or population samples from multiple centres. The cost and time implications become even more crucial as the resource setting of the studies become more circumscribed. A second technical advantage is the short period between removal of a blood sample and stabilization of RNA. Prolonged sorting protocols, such as flow cytometry-based or bead-based methods inevitably involve lengthy in vitro incubation steps, which will induce changes in the cellular transcriptome even in the rare situations that the temperature of the samples is carefully controlled from the moment the blood sample is collected. Finally, it should be remembered that cell subset classification is to a greater or lesser extent artificial, reflecting our current ability to distinguish cells based on specific small sets of available markers. It is becoming increasingly clear that every defined subpopulation of cells can be further broken down into additional subgroups, as the tools for such classification become more sophisticated. The analysis of unfractionated cell populations adds a layer of complexity to the interpretation, but is not necessarily less informative than the analysis of marker defined subpopulations.
Figure 1.
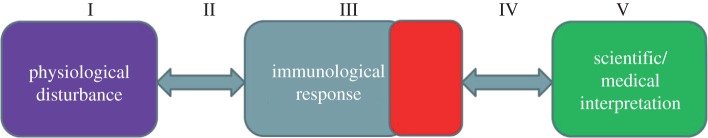
Blood as a window to the immune response. Pathophysiological disturbances (I, both infectious and non-infectious) elicit changes in the cells of the immune system (II, III), some of which circulate via the blood and hence can be sampled (IV) and analysed in the laboratory (V). The objective is to learn about I from studying V. However, the mappings between each compartment are high dimensional, nonlinear and possibly redundant. They may also require us to extend the current cell centric understanding of disease.
1.3. Qualitative and quantitative immune profiling
The immune system comprises several sets of molecular sensors or receptors which interact directly with their targets (generally named antigens for receptors of adaptive immunity, and molecular patterns for receptors of innate immunity). These primary interactions lead to a complex sequence of subsequent intra-cellular and inter-cellular changes, which together comprise an immune response (figure 2). An analysis of these changes at a transcriptomic level, and how they map onto known intra- and inter-cellular molecular networks reveals much information on the qualitative nature of a particular immune response, both innate and adaptive. For example, an analysis of whole blood transcriptomics highlighted a previously overlooked role of type I interferon responses in neutrophils, a facet of innate immunity, in the pathogenesis of tuberculosis [2]. Global transcriptomics does not, however, directly address the antigen-specific (adaptive) element of the immune response which requires a different approach. A fundamental tenet of our understanding of adaptive immunity is that most B- and T-lymphocytes carry only receptors of one unique sequence, and that the number of cells carrying a specific receptor increases following exposure to the cognate antigen. These two fundamental rules form the basis for the clonal theory of immune function, which remains a central dogma of immunology. The quantitative description of the frequency of cells carrying each specific receptor as a function of time therefore carries quantitative information on the response to specific antigen. In this paper, we examine ways to capture both these qualitative and quantitative aspects of the immune response, by different strategies for whole blood expression profiling. The overall workflow we are currently using is illustrated in figure 3. By combining qualitative and quantitative analyses, we aim to obtain an integrated picture of the immune response, and use it to reveal the underlying pathological processes which may be difficult to access using conventional diagnostic tools.
Figure 2.

The immune system as a complex biomonitor: qualitative and quantitative immune profiling. The immune system responds to a wide variety of diseases, by changes in the number of cells carrying antigen-specific receptors (adaptive immunity) and by a network of non-specific molecular interactions which transduce the primary recognition signals, drive cell maturation and phenotype, and shape an overall immune response.
Figure 3.

The pipeline for human transcriptomic analysis: qualitative and quantitative immune profiling.
2. Whole blood expression profiling
2.1. Data collection and low-level processing
Several groups have used whole blood transcriptional profiling previously [2–6]. Unfortunately, there is no consensus on the best protocols and different laboratories use different experimental and computational packages. For example, microarray platforms are increasingly being superceded by high-throughput sequencing approaches. In the context of these rapid improvements in technology, it seems naive to believe that it will be possible to establish a consensus pipeline, and the challenge will be to develop bioinformatic computational tools which will allow cross-platform analysis of different datasets, and which will be backwardly compatible so as to make use of the large amounts of data which have already been generated. The wet laboratory protocols for RNA collection, isolation and hybridization used in our laboratory are similar to published protocols [7,8] and include a step to remove the very abundant hemoglobin transcript in order to increase the sensitivity of detection of other transcripts. The output of the Agilent scanners generates files with a large amount of image analysis information, most of which is rarely used in subsequent analysis. We wished to develop a computational pipeline which gave us full control over key steps in data processing, such as normalization and scaling, but which was simple enough to be learned rapidly by people with little previous computational background. For this purpose, we developed the package agilp, written in R and available in Bioconductor [9]. The package contains a series of modules (table 1).
Table 1.
agilp modules and their function.
| module | function |
|---|---|
| AAProcess | extracts raw expression data from Agilent expression array scanner files |
| Loader | a file chooser utility file, to select sets of data from a large database of expression datafiles |
| filenamex | a file name listing utility |
| Baseline | constructs a file with the mean of each probe from a set of raw expression array data files |
| AALoess | normalizes a set of gene expression data files using LOESS against a reference dataset |
| IDswop | maps expression data across different bioinformatic identifiers |
| Equaliser | trims a set of gene expression data files to include only the set of identifiers common to all files |
A typical pipeline would first extract raw expression data from the scanner output files using AAProcess. This module is platform-specific and is designed to extract median spot raw expression intensity values from the Agilent scanner output. The module can use both one-colour and two-colour formats, but typically our laboratory uses both colours for independent samples thus doubling the number of samples which can be run. The remaining modules are all platform independent and simply require files which contain a list of identifiers (typically probe names) in the first column and a list of numbers representing intensities in the second. The expression data from each sample output from AAProcess are stored as a single tab delimited txt file, whose name uniquely identifies the array. A key feature in managing the workflow is a file named the template. The template is a spreadsheet (for example, a simple Excel worksheet), which acts as a database storing the key experimental details for each sample (cell type, date of hybridization, stimulus, user, etc.) along with the unique identifier linking the sample to the array output. We found that a common problem was operator error in manually entering the unique array identifier file names, which are often long series of numbers and letters, into the template manually. The utility filenamex returns the list of file names in a directory in a form which can be very easily copied and pasted into the template, thus minimizing the opportunities for operator error. A set of files for further processing can be selected from a large bank of files on the basis of specific criteria as detailed in the template (e.g. all files containing results from whole blood samples), using the utility loader.
The two modules baseline and AALoess perform normalization and transformation of the data. The data are log2 transformed by default, although an option is available to use untransformed data. In addition to being standard practice in the microarray field, log transformation equalizes the variance across the intensity range, and also improves the fit to normal distribution for many probes [10]. Further analysis by parametric tests is therefore more robust. The normalization algorithm uses a local regression model (LOESS) to compare individual datasets to a standard, which is typically the mean of many similar datasets, and then apply an intensity-dependent correction factor across the intensity range. The underlying assumption is that all samples will have the same overall distribution of intensities across the probe ensemble, since only a minority of genes change between samples. This is a somewhat tighter assumption than standardizing the mean or median, and the evidence supporting it is discussed in more detail in [10]. Median centring, which is often computationally helpful for further analysis, is a relatively trivial additional step once LOESS normalization has been carried out. Standardization of variance is not carried out, and is indeed not recommended, since variance of the log transformed data is intensity independent, and the different magnitude of changes between different genes is an important variable in downstream analysis. The final two modules, IDswop and Equaliser deal with cross platform analysis. Further details are given in the agilp vignette.
2.2. Supervised and unsupervised approaches to high-level analysis
The experimental and computational pipeline described above produces datasets which are robust and highly reproducible in a number of different models [1,7,11,12]. These datasets therefore provide a solid base on which to develop high-level analysis tools which interrogate the data, to derive information which can be useful to clinicians in terms of patient stratification and management, and may also provide clues to understanding disease pathogenesis. The development of analysis tools for microarray data is an enormously active field, requiring close interaction between biologists, clinicians, computer scientists and statisticians. It is not possible to review the different approaches within the confines of this discussion, and indeed it is too early to say which tools will be of most value. Two major challenges are that the datasets are both ultra high dimensional and noisy, due in large part to the underlying enormous individual variability within the human population. The network of gene interactions, which is often the focus of interest, is sparse, in the sense that most genes are not directly linked to most other genes, posing additional challenges [13]. Current machine learning and statistical tools still struggle with finding meaningful patterns within such datasets. One approach to dimension reduction is to use prior knowledge to build gene modules which may reflect known biological entities or functions [14]. At the simplest level, modules can define a cell type. For example, we have defined a T-cell module, by choosing some ‘known’ T-cell markers and then selecting other genes which closely correlate with these initial seed genes across sets of data. A common core of genes all closely correlated with each other emerge as a putative T-cell signature. We tested the validity of this approach by comparing the T-cell module signal (the median intensity signal from all genes within a module) across a set of 25 whole blood arrays with the differential T-cell count obtained by classical methods. The T-cell module signal gave excellent correlation with T-cell numbers, but was uncorrelated to monocyte numbers confirming that the signature was cell type-specific (figure 4). This simple test example demonstrates that the whole blood expression profile contains within it information such as differential cell counts which has long been used as a biomarker of clinical utility. It seems probable that many other such informative signatures can potentially be accessed, all from the same dataset, making whole blood transcriptional profiling not only a powerful but very cheap option for biomarker measurement.
Figure 4.

A gene module which identifies T-cells. The median processed gene expression level from the set of genes shown on the right was plotted against (a) T-cell and (b) monocyte count for a set of whole blood samples (n = 25). The T-cell signature score is highly correlated with T-cell count, but not with monocyte count.
3. The T-cell receptor repertoire
The power of vertebrate adaptive immunity lies in its ability to synthesize an enormously diverse repertoire of antigen-specific receptors, by a unique process of imprecise recombination of DNA segments within the lymphocyte germline. Diversity is generated by stochastic recombination of many copies of minigenes (V, D and J segments). At each segment join, bases can be lost and added. Each receptor contains two variable chains, and these join in a random (or at least very promiscuous) way further boosting variability. Estimates for the number of possible B- and T-cell receptors which can be generated by this mechanism are in excess of 1010 [15], and may be much higher (table 2). Because of this diversity, global analysis of immune repertoires and responses has lagged behind the structural understanding of receptor/antigen interactions. Advances in high-throughput sequencing (HTS) now offer the possibility of analysing immune responses with unprecedented breadth and depth [16,17].
Table 2.
The possible diversity of T-cell receptor α and β chains, not including the effects of two additional D regions in the β chains.
| chain | V region | 3′ V deletions | J region | 5' J deletions | combinations | additions | total combinations |
|---|---|---|---|---|---|---|---|
| α | 45 | 15 | 50 | 12 | 15 | ||
| α | 45 | 15 | 50 | 12 | 405 000 | 4.3 × 10¹⁴ | |
| β | 48 | 10 | 13 | 12 | 18 | ||
| β | 48 | 10 | 13 | 12 | 74880 | 5.1 × 10¹⁵ |
The accurate description and analysis of the T- and B-cell repertoires provides both wet laboratory and computational challenges. A number of different approaches have been described to isolate DNA which is representative of a whole sample of diverse TcR or BcR sequences [18–21]. So far, this approach has been applied only to a handful of examples. However, with the rapid increase in high-quality read length which can be achieved, and the fall in cost, the number of such datasets generated in the coming years are likely to increase rapidly. Most studies have used as starting material messenger RNA, although at least theoretically gene recombination associated with lymphocyte receptor expression is a genomic event and could be tracked at DNA level. Nevertheless, for methodological reasons RNA has remained the favoured target, although accurate reflection of the repertoire based on RNA measurements depends on the assumption that the level of TcR message does not vary very much during different stages of T-cell differentiation and activation. This assumption has not been extensively investigated, and is certainly not true for B-cells where immunoglobulin levels vary by as much as 1000-fold by stages of differentiation and activation. All published studies have used PCR for receptor amplification, and a major challenge has been to ensure that amplification over the diverse set of receptors occurs with uniform efficiency. With continued improvements in sequencing technology (longer reads, less DNA input requirement and ever higher depth of sequencing) many of the challenges of the experimental protocol are likely to be solved within the next year or two.
One outstanding question in regard to whole blood repertoire analysis will be the interdependence of repertoire on lymphocyte subset composition. Some of the generic advantages and disadvantages of analysis of whole blood versus sorted populations are discussed above. However, the repertoire is the result of specific constraints imposed by germline gene sequence content and sequential somatic selection at specific developmental and antigen challenge dependent checkpoints. These processes will clearly be different among various T-cell subpopulations. Indeed, some T-cell subpopulations may be sampled poorly or not at all in blood, since they are found predominantly within tissues: for example, tumour-associated lymphocytes may be strongly under-represented in blood. In practice, therefore studies of both sorted and whole blood populations will be required, and will need to be supplemented by analysis of repertoire from tissue biopsy material where this is available. Analysis of sequences obtained from specific lymphocyte subsets, both antigen-specific (e.g. tetramer selected) and non-specific (e.g. CD4 versus CD8, Tregs versus CD4, etc.) will inform interpretation and understanding of the rules which determine the relationship between genetic recombination, selection and antigen specificity. Nevertheless, as these rules become better understood, and the relationships between sequence and antigen recognition are established, whole blood TcR profiling will provide a powerful tool for the large-scale longitudinal and population analysis of repertoire changes which may accompany infection or other diseases affecting immune function.
3.1. Low-level sequence processing
In the same way as we describe above for microarray expression analysis, our first step has been to develop a computational tool for low-level analysis of large sequence datafiles, which allows us control over key processing steps but is sufficiently robust and easy to use that it can be readily adopted by experimental scientists with little previous computational training. To simplify analysis of the vast number of short read sequences (potentially 100 million from a single experiment using Illumina HiSeq technology), and also to mitigate the influence of sequencing error on subsequent analysis, we have developed an algorithm to classify each TcR sequence read in terms of a five-part classifier. This classifier consists of four numeric fields, namely the V gene segment used, the J gene segment used, the number of V and J deletions, and finally a categorical variable consisting of the oligonucleotide string found between 3' V and 5' J. Following previous studies, we have not tried to distinguish between the two possible β D regions, since they are very similar and are difficult to classify particularly when the ends are significantly deleted. Each five part identifier unambiguously defines a complete TcR chain sequence, thus compressing the data from a string of several hundred characters, to typically less than 50. Each identifier also reflects an underlying biological process, so that the frequency of each item can be given biological meaning (e.g. V or J gene usage, etc.). Further advantages of categorizing sequence reads are it distinguishes true TcR sequences from ‘junk’ sequences (and loses the latter). It removes some of the sequencing error (which adds false additional diversity), typically quoted as occurring at up to 1 per cent on the Illumina platform. Finally, it allows efficient storage of high-dimensional data in a form which can be rapidly interrogated (for example, using hash tables) in order to look for patterns and clusters across multiple different samples.
To parse the raw sequence files and convert each sequence into an identifier, we implement the algorithm described by Aho & Corasick [22], which allows efficient, exact searching of a set of keywords within a target. The classical Aho–Corasick algorithm was extended to account for sequencing error and assign gene regions using keywords which differ from the target sequence by at most one letter (i.e. one base pair). A set of V (or J) tags were found which uniquely define one, and only one, V (or J) gene segment [23]. These tags are used as the keywords. The beauty of the algorithm is that it makes only one pass through the target string to find all keywords present within it. The algorithm was implemented using Acora in BioPython and is available at https://github.com/uclinfectionimmunity/Decombinator with full instructions on usage.
Once a tag has been assigned, the number of deletions is calculated by using our knowledge of the location of the tag within that gene segment. The algorithm jumps to the end of where the full length gene segment would finish in the sequence read, and then counts back towards the tag (figure 5) until it finds the end of the V or J region, by finding three consecutive bases which match to the expected V or J region. Finally, the sequence found between 3' V and 5' J gives the additional non-template nucleotides along with the remnants of the D gene segment used.
Figure 5.

Once a V (or J) tag has been found in the sequence read, its known, relative position within each V or J segment is used to determine where a full V or J would end within the sequence read. From this position, consecutive comparisons are made working backwards from this inferred position to determine the number of germline deletions.
Determining these five variables allows us to express each sequence in terms of a classifier, providing a simple means of clustering a repertoire of sequences. We categorize each sequence fs as
| 3.1 |
From this classifier, we are then able to determine the underlying nucleotide sequence, mitigating for sequencing error, and determine the CDR3 region, which is believed to reflect the region of protein making direct contact with antigen, via translation of the nucleotide sequence (figure 6), defined as the region between the last cysteine residue in V and the conserved FG(X)G motif in J.
Figure 6.

Once a sequence read has been classified according to the five variables described in the text, the underlying nucleotide sequence can be determined from the classifier, crucially without sequence error. From this underlying nucleotide sequence, it is then straightforward to determine the amino acid sequence via translation, where the CDR3 region is defined as the last conserved cysteine residue in V to the conserved FG(X)G motif in J.
3.2. High-level analysis
We have used the analysis tool described above to parse sequence data on β chains available in the public domain [24]. As described previously, V and J region usage is non-uniform, as are deletions and additions (figure 7a). The pictorial depiction of the repertoire from one individual is shown in a bubble plot in (figure 7b) where each distinct sequence is represented by a circle, and its frequency by the circle area and colour. The picture emphasizes the extraordinary diversity of each individual's repertoire.
Figure 7.

The TcR repertoire as classified by the Aho–algorithm described in the text. (a) V and J gene usage in three unrelated individuals sequenced by Warren et al. [24]. (b) Bubble plot depicting the frequency distribution of 11 000 distinct TcRs sequences from one individual. Each circle represents a distinct sequence, and the area of the circle and its diameter represent its frequency.
Merely by investigating the quantity and persistence of clones over time, studies using high-throughput DNA analysis of TcR repertoire sequence data have revealed several important fundamental features of T-cell biology, such as the timing of β chain rearrangement [25], a minimum size of the β repertoire [19,20], and the presence of surprisingly few expanded clones in the memory compartment [15]. Some initial clinical applications of the approach have also been explored. Two particular recent studies have employed TcR sequencing with a translational focus, by tracking subsets of T-cell clones in important clinical settings. The first tracked the retention of clones in a patient with ankylosing spondylitis who underwent autologous haematopoietic stem cell transplantation [26]. In this setting, the authors were able to observe that at least 250 unique TcRβ clones seem to have survived the chemotherapy, being both detectable and seemingly expanded post-ablation. A second group used similar approaches to track the survival of malignant clones in lymphoid cancer patients [27]. Deep sequencing of T-cell receptor β and γ allowed monitoring of minimum residual disease, a major prognostic marker, with greater sensitivity than current clinical assays.
However, it is clear that the real power of the TcR and BcR sequence analysis will only be understood when it is applied to antigen-specific responses. Basic parameters including the number of different clones which expand to a given antigen stimulus and the kinetics of the response remain unknown. We are beginning to collect longitudinal samples from various cohorts of individuals exposed to known antigen stimulation, for example vaccination or infection. The long-term objective will be to combine this sort of observational data with bioinformatic structure predictions, to build up a comprehensive catalogue of the predicted specificity of a substantial proportion of the overall T-cell repertoire. Achieving this objective remains an ambitious goal.
4. General conclusions
Whole blood cell transcriptional profiling remains in its infancy, but continued improvements in the underlying technologies will continue to make the wet laboratory analysis of these samples easier, cheaper and more reliable. The conceptual framework of the approach is however radical. It goes beyond the cell centric view of human pathology which has dominated medicine for the past 150 years [28] because it focuses on recognizing emergent global molecular networks or signatures derived from complex cell mixtures which reflect holistic changes in the body's physiology. To a great extent, the approach remains data-driven rather than hypothesis or knowledge-driven. The relationships between the detailed molecular interaction networks which have been painstakingly defined over the last half century and the gene expression profiles generated by global transcriptomics remain very poorly defined. From a computational point of view, this data-driven discovery relies heavily on unsupervised machine learning techniques. However, as our knowledge base deepens, prior knowledge will increasingly drive supervised or semi-supervised learning algorithms. It is clear, however, that if it is to take its part as part of the twenty-first century's personalized medicine revolution, whole blood transcriptional profiling (whether global gene expression or lymphocyte receptor specific) must be rolled out as ‘big science’. Only by collecting large enough datasets, and linking them carefully and methodically to detailed clinical data will the power of the approach be properly realized. Analysing these emerging datasets will then require new generations of young biomedical researchers who are as comfortable with computational and mathematical skills as they are with the molecular and cellular biology which forms the basis for most of the current biomedical training and research.
References
- 1.Tomlinson GS, et al. 2011. Transcriptional profiling of innate and adaptive human immune responses to mycobacteria in the tuberculin skin test. Eur. J. Immunol. 41, 3253–3260 10.1002/eji.201141841 (doi:10.1002/eji.201141841) [DOI] [PMC free article] [PubMed] [Google Scholar]
- 2.Berry MPR, et al. 2010. An interferon-inducible neutrophil-driven blood transcriptional signature in human tuberculosis. Nature 466, 973–977 10.1038/nature09247 (doi:10.1038/nature09247) [DOI] [PMC free article] [PubMed] [Google Scholar]
- 3.Bennett L, Palucka AK, Arce E, Cantrell V, Borvak J, Banchereau J, Pascual V. 2003. Interferon and granulopoiesis signatures in systemic lupus erythematosus blood. J. Exp. Med. 197, 711–723 10.1084/jem.20021553 (doi:10.1084/jem.20021553) [DOI] [PMC free article] [PubMed] [Google Scholar]
- 4.Chaussabel D, Allman W, Mejias A, Chung W, Bennett L, Ramilo O, Pascual V, Karolina Palucka A, Banchereau J. 2005. Analysis of significance patterns identifies ubiquitous and disease-specific gene-expression signatures in patient peripheral blood leukocytes. Ann. NY Acad. Sci. 1062, 146–154 10.1196/annals.1358.017 (doi:10.1196/annals.1358.017) [DOI] [PubMed] [Google Scholar]
- 5.Ramilo O, et al. 2007. Gene expression patterns in blood leukocytes discriminate patients with acute infections. Blood 109, 2066–2077 10.1182/blood-2006-02-002477 (doi:10.1182/blood-2006-02-002477) [DOI] [PMC free article] [PubMed] [Google Scholar]
- 6.Maertzdorf J, Repsilber D, Parida SK, Stanley K, Roberts T, Black G, Walzl G, Kaufmann SHE. 2011. Human gene expression profiles of susceptibility and resistance in tuberculosis. Genes and Immunity 12, 15–22 10.1038/gene.2010.51 (doi:10.1038/gene.2010.51) [DOI] [PubMed] [Google Scholar]
- 7.Le Bert N, Chain BM, Rook G, Noursadeghi M. 2011. DC priming by M. Vaccae inhibits Th2 responses in contrast to specific TLR2 priming and is associated with selective activation of the CREB pathway. PLoS ONE 6, e18346. 10.1371/journal.pone.0018346 (doi:10.1371/journal.pone.0018346) [DOI] [PMC free article] [PubMed] [Google Scholar]
- 8.Maertzdorf J, et al. 2012. Common patterns and disease-related signatures in tuberculosis and sarcoidosis. Proc. Natl Acad. Sci. USA 109, 7853–7858 [DOI] [PMC free article] [PubMed] [Google Scholar]
- 9.Chain B. 2012. agilp: Agilent expression array processing package, R package version 3.0.0, Bioconductor. (http://www.bioconductor.org/packages/release/bioc/html/agilp.html) [Google Scholar]
- 10.Chain B, Bowen H, Hammond J, Posch W, Rasaiyaah J, Tsang J, Noursadeghi M. 2010. Error, reproducibility and sensitivity: a pipeline for data processing of Agilent oligonucleotide expression arrays. BMC Bioinformatics 11, 344. 10.1186/1471-2105-11-344 (doi:10.1186/1471-2105-11-344) [DOI] [PMC free article] [PubMed] [Google Scholar]
- 11.Tsang J, Chain BM, Miller RF, Webb BL, Barclay W, Towers GJ, Katz DR, Noursadeghi M. 2009. HIV-1 infection of macrophages is dependent on evasion of innate immune cellular activation. AIDS (London, England) 23, 2255–2263 10.1097/QAD.0b013e328331a4ce (doi:10.1097/QAD.0b013e328331a4ce) [DOI] [PMC free article] [PubMed] [Google Scholar]
- 12.Tomlinson GS, et al. 2012. Adherent human alveolar macrophages exhibit a transient pro-inflammatory profile that confounds responses to innate immune stimulation. PLoS ONE 7, e40348. 10.1371/journal.pone.0040348 (doi:10.1371/journal.pone.0040348) [DOI] [PMC free article] [PubMed] [Google Scholar]
- 13.Bien J, Tibshirani RJ. 2011. Sparse estimation of a covariance matrix. Biometrika 98, 807–820 10.1093/biomet/asr054 (doi:10.1093/biomet/asr054) [DOI] [PMC free article] [PubMed] [Google Scholar]
- 14.Chaussabel D, et al. 2008. A modular analysis framework for blood genomics studies: application to systemic lupus erythematosus. Immunity 29, 150–164 10.1016/j.immuni.2008.05.012 (doi:10.1016/j.immuni.2008.05.012) [DOI] [PMC free article] [PubMed] [Google Scholar]
- 15.Wang C, et al. 2010. High throughput sequencing reveals a complex pattern of dynamic interrelationships among human T cell subsets. Proc. Natl Acad. Sci. USA 107, 1518–1523 10.1073/pnas.0913939107 (doi:10.1073/pnas.0913939107) [DOI] [PMC free article] [PubMed] [Google Scholar]
- 16.Shendure J, Ji H. 2008. Next-generation DNA sequencing. Nat. Biotechnol. 26, 1135–1145 10.1038/nbt1486 (doi:10.1038/nbt1486) [DOI] [PubMed] [Google Scholar]
- 17.Holt RA, Jones SJM. 2008. The new paradigm of flow cell sequencing. Genome Res. 18, 839–846 10.1101/gr.073262.107 (doi:10.1101/gr.073262.107) [DOI] [PubMed] [Google Scholar]
- 18.Weinstein JA, Jiang N, White RA, Fisher DS, Quake SR. 2009. High-throughput sequencing of the zebrafish antibody repertoire. Science 324, 807–810 10.1126/science.1170020 (doi:10.1126/science.1170020) [DOI] [PMC free article] [PubMed] [Google Scholar]
- 19.Freeman JD, Warren RL, Webb JR, Nelson BH, Holt RA. 2009. Profiling the T-cell receptor beta-chain repertoire by massively parallel sequencing. Genome Res. 19, 1817–1824 PMID: 19541912 10.1101/gr.092924.109 (doi:10.1101/gr.092924.109) [DOI] [PMC free article] [PubMed] [Google Scholar]
- 20.Robins HS, Srivastava SK, Campregher PV, Turtle CJ, Andriesen J, Riddell SR, Carlson CS, Warren EH. 2010. Overlap and effective size of the human CD8+ T-cell receptor repertoire. Sci. Transl. Med. 2, 47ra64. 10.1126/scitranslmed.3001442 (doi:10.1126/scitranslmed.3001442) [DOI] [PMC free article] [PubMed] [Google Scholar]
- 21.Ndifon W, et al. 2012. Chromatin conformation governs T-cell receptor J gene segment usage. Proc. Natl Acad. Sci. USA. (http://www.ncbi.nlm.nih.gov/pubmed/22984176) [DOI] [PMC free article] [PubMed] [Google Scholar]
- 22.Aho AV, Corasick MJ. 1975. Efficient string matching: an aid to bibliographic search. Commun. ACM 18, 333–340 10.1145/360825.360855 (doi:10.1145/360825.360855) [DOI] [Google Scholar]
- 23.Giudicelli V, Chaume D, Lefranc MP. 2005. IMGT/GENE-DB: a comprehensive database for human and mouse immunoglobulin and T cell receptor genes. Nucleic Acids Res. 33(Database issue), D256–D261 10.1093/nar/gki010 (doi:10.1093/nar/gki010) [DOI] [PMC free article] [PubMed] [Google Scholar]
- 24.Warren RL, Freeman JD, Zeng T, Choe G, Munro S, Moore R, Webb JR, Holt RA. 2011. Exhaustive T-cell repertoire sequencing of human peripheral blood samples reveals signatures of antigen selection and a directly measured repertoire size of at least 1 million clonotypes. Genome Res. 21, 790–797 10.1101/gr.115428.110 (doi:10.1101/gr.115428.110) [DOI] [PMC free article] [PubMed] [Google Scholar]
- 25.Sherwood AM, et al. 2011. Deep sequencing of the human TCRα and TCRβ repertoires suggests that TCRβ rearranges after αβ and γδ T cell commitment. Sci. Transl. Med. 3, 90ra61. [DOI] [PMC free article] [PubMed] [Google Scholar]
- 26.Mamedov IZ, et al. 2011. Quantitative tracking of T cell clones after haematopoietic stem cell transplantation. EMBO Mol. Med. 3, 201–207 10.1002/emmm.201100129 (doi:10.1002/emmm.201100129) [DOI] [PMC free article] [PubMed] [Google Scholar]
- 27.Wu D, et al. 2012. High-throughput sequencing detects minimal residual disease in acute T lymphoblastic leukemia. Sci. Transl. Med. 4, 134ra163. [DOI] [PubMed] [Google Scholar]
- 28.Virchow RC. 1859. Vorlesungen über Cellularpathologie in ihrer Begründung auf physiologischer und pathologischer Gewebelehre. Berlin, Germany: Verlag von August Hirschwald. [Google Scholar]