

Abstract
Purpose.
Reports of altered retinal blood flow in experimental models of type I diabetes have provided contrasting results, which leads to some confusion as to whether flow is increased or decreased. The purpose of our study was to evaluate early diabetes-induced changes in retinal blood flow in diabetic rats, using two distinctly different methods.
Methods.
Diabetes was induced by injection of streptozotocin (STZ), and retinal blood flow rate was measured under anesthesia by a microsphere infusion technique, or by an index of flow based on the mean circulation time between arterioles and venules. Measurements in STZ rats were compared to age-matched nondiabetic controls. In addition, the retinal distribution of fluorescently-labeled red blood cells (RBCs) was viewed by confocal microscopy in excised flat mounts.
Results.
Retinal blood flow rate was found to decrease by approximately 33% in the STZ rats compared to controls (P < 0.001) as assessed by the microsphere technique. However, in striking contrast, the mean circulation time through the retina was found to be almost 3× faster in the STZ rats (P < 0.01). This contradiction could be explained by flow redistribution through the superficial vessels of the diabetic retina, with this possibility supported by our observation of significantly fewer RBCs flowing through the deeper capillaries.
Conclusions.
We conclude that retinal blood flow rate is reduced significantly in the diabetic rat, with a substantial decrease of flow through the capillaries due to shunting of blood through the superficial layer, allowing rapid transit from arterioles to venules.
Keywords: retinal blood flow, diabetic retinopathy, microsphere, mean transit time
Contrasting results of two different blood flow measures demonstrates that retinal blood flow rate is reduced significantly in diabetic rats, with a substantial decrease of flow through the capillaries due to shunting of blood through the superficial vessels.
Introduction
Previous reports suggest an early 30% to 35% decrease in retinal blood flow rate in individuals with diabetes before the development of more advanced retinopathy.1–3 This decrease in retinal perfusion has been implicated in causing pathologic consequences, such as retinal hypoxia, leukostasis, and capillary dropout.4 Therefore, the mechanisms of the early decrease in retinal blood flow are important to investigate, and several animal models of type I diabetes (including from our own lab) demonstrate a similar percentage early drop in flow (∼20%–45%)5–11 as found in humans. However, it should be noted that contrasting results have been reported, with some animal studies finding the opposite, that is, an early increase in retinal perfusion.12,13 Variations in the animal models have been speculated to contribute to the differing results,14 although it also is possible that variations in the measurement techniques could be a major contributor to the contrasting data.
The primary purpose of our investigation was to compare early diabetes-induced changes in retinal blood flow using two different measures, specifically the microsphere infusion technique and the mean circulation time index. These two techniques were applied to a model of streptozotocin-induced diabetes in rats. As we show in our study, the results are strikingly in contrast to each other, but despite this disparity, we believe that both methods provide important information regarding the altered microvasculature in the diabetic retina.
Methods
Model of Type I Diabetes
Male Wistar rats (Harlan Laboratories, Houston, TX) weighing an average of approximately 140 g were injected intraperitoneally (IP) with 60 mg/kg streptozotocin (STZ; Sigma-Aldrich, St. Louis, MO) dissolved in pH 4.5 sodium citrate buffer, N = 41 rats), or with the sodium citrate buffer alone for age-matched nondiabetic controls (N = 45 rats). The STZ was injected within 15 minutes of preparation in solution. Body weights and nonfasting plasma glucose values (AlphaTRAK glucometer; Abbott Laboratories, Abbott Park, IL) were recorded on the day of injection and on the day of retinal blood flow measurements (∼60 days later). No insulin was given during the protocol. The animals were treated in accordance with the ARVO Statement for the Use of Animals in Ophthalmic and Vision Research, and the animal protocol was approved by the Animal Care and Use Committee at LSU Health Sciences Center in Shreveport.
Microsphere and Laser Doppler Measurements of Blood Flow
Rats were anesthetized with 100 mg/kg ketamine and 40 mg/kg pentobarbital. After a 15-minute stabilization period of anesthesia, a laser Doppler flow probe (LaserFlo Blood Perfusion Monitor BPM2; Vasamedics, St. Paul, MN) was held by micromanipulator perpendicular to the head and centered on the eye at a distance of approximately 1 to 2 mm from the cornea. The median of five measurements of blood flow (ocular blood flow, not specific to the retina) was recorded for the right and left eyes for 16 control and 12 STZ rats. Additional pentobarbital was administered as needed before a surgical incision of the upper abdomen, which allowed insertion of a 27-gauge needle through the diaphragm into the left ventricle in accordance with the optimized procedure published by Wang et al.15,16 for the use of microspheres in the measurement of retinal blood flow in rats. In this procedure, 2.5 × 10⁶ fluorescent microspheres (8 μm in diameter; Bangs Laboratories, Fisher, IN) were injected into the left ventricle while a reference blood sample was collected through a cannula of the right femoral artery. The rate of arterial withdrawal was 200 μL/min: the withdrawal began 10 seconds before the injection and continued for a period of 30 seconds following the injection. The eyes then were removed (and the rat euthanized with an overdose of pentobarbital), and the retinas of both eyes were prepared as flat mounts for counting the number of microspheres lodged in the retinal microvessels. The number of microspheres in the reference blood sample was counted with the use of a hemacytometer. Retinal blood flow rate was calculated as the femoral blood withdrawal rate multiplied by the ratio of microspheres found in the retinal tissue and divided by the number counted in the blood sample. The numbers of rats included in the microsphere measurements were 9 controls and 10 STZ.
Retinal Mean Transit Times
Rats were anesthetized as described above, with a femoral vein cannula inserted for infusion of 2 × 10⁶ molecular weight fluorescein isothiocyanate (FITC)-dextran. The dye was injected as a bolus while the retina was video recorded through a Coolsnap ES camera (Photometrics, Tucson, AZ) attached to a Nikon Eclipse microscope (Nikon Instruments, Melville, NY) using a 10× objective. Two infusions in the amount of 5 mg/kg were performed so that measurements could be made for both eyes: the dye was administered in a volume of 100 μL saline for the first bolus, and then after an equilibration period, the dye infusion was concentrated 2× (i.e., using a volume of 50 μL instead of 100 μL) for the second eye. The vessels filling first with dye were the arterioles (Fig. 1A), with the arteriolar fluorescent intensity reaching a peak, and beginning to decline as the dye made its transit through the capillaries and into the venules (Fig. 1B). The fluorescent intensity curves of the arterioles and venules were used to calculate the mean transit times of each as described previously,5,17,18 with the difference in mean transit times defined as the mean circulation time (MCT). In this technique, the tail end of the intensity curves are obscured by the recirculating dye in the bloodstream, but are estimated conventionally by a logarithmic fit of the declining phase of the curve, as shown in Figure 1C. Data from the right and left eyes were averaged together, whenever data were obtained for both. A flow rate index (retinal blood volume divided by the MCT) can be calculated by dividing the sum of the squares of the arteriolar and venular diameters (Dart and Dven) by the MCT, that is, (Dart2 + Dven2)/MCT, with the assumption that the numerator is proportional to the effective circulating retinal blood volume.17 Diameters were measured from the video recordings using NIS Elements software (Nikon Instruments): the 10× objective coupled with 2 × 2 binning of the camera pixels (to enhance fluorescent contrast) provided a resolution of 1.29 μm per measurement pixel. The numbers of rats included in these measurements were 12 controls and 9 STZ.
Figure 1. .

Following the infusion of FITC-dextran, the dye appears first in the retinal arterioles (A), then in the venules (B). (C) The arteriolar and venular fluorescent intensities following the infusion, with a logarithmic fit of the declining phase used to estimate the clearance of the dye that is obscured by recirculation.
Measurements of Retinal Capillary Density
While under anesthesia and with 5 mg/kg 2 × 10⁶ molecular weight FITC-dextran infused through the right femoral vein as described above, eyes were removed and retinas separated for flat mount preparation. Capillary density was quantified (for the inner and deep capillary layers) as the number of capillaries intersected by a 500 μm straight line, as demonstrated in Figure 2. Whenever possible, 12 measures of capillary density were averaged for the inner and deep capillary layers for each retina. The numbers of rats included in these measurements were 10 controls and 8 STZ.
Figure 2.
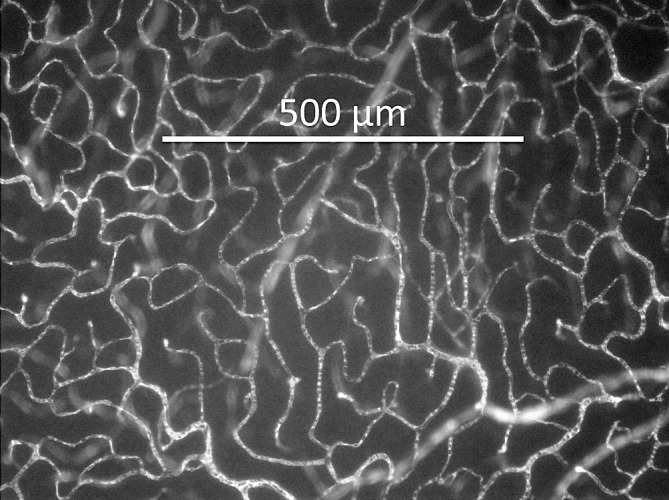
Retinal flat mount showing FITC-dextran fluorescence in the capillaries, with linear capillary density calculated as the number of capillaries crossed by a 500 μm straight line.
Confocal Imaging of RBC Distribution in the Retina
To image red blood cell (RBC) distribution in the retinal circulation, the right femoral vein of the anesthetized rats was cannulated for infusion of 5 mg/kg 2 × 10⁶ molecular weight FITC-dextran along with fluorescently-labeled RBCs. The RBCs were labeled with 1,1′-dioctadecyl-3,3,3′,3′-tetramethyl-indocarbocyanine perchlorate (DiI) as described previously,5–7,19 with 1.8 mL/kg RBCs injected per rat. After the infusions circulated for 5 minutes, the eyes were excised for retinal flat mounts, which were imaged by a Leica TCS SP5 confocal microscope (Leica, Wetzlar, Germany). The number of RBCs per 20× field of view was counted for the combined inner and deep capillary layers, as well as for the superficial vasculature (excluding the number of RBCs in the primary arterioles and venules). Figure 3 focuses in on approximately 1/10 of a field of view, showing the RBCs in the superficial retinal vasculature (Figs. 3A, 3C), and in the inner and deep capillary layers (Figs. 3B, 3D). The numbers of rats included in these measurements were 8 controls and 10 STZ.
Figure 3. .

Images captured by confocal microscopy, showing FITC-dextran (green) and DiI-labeled RBCs (red) in a retinal flat mount. (A, C) Merged green/red images from the superficial section of the retina. (B, D) Red RBC fluorescence in the deeper capillary layers of the retina. The arrow in (A) points to an arteriole that branches down from the superficial layer into the capillary layers shown in (B).
Mean Arterial and Intraocular Pressures
While under anesthesia in a subset of rats, mean arterial pressure (N = 21 controls and 19 STZ) was obtained using the cannulated femoral artery (Pressure Monitor BP-1; World Precision Instruments, Sarasota, FL), and intraocular pressure (N = 16 controls and 14 STZ) was obtained via tonometry (Tono-Pen Avia Vet; Reichert, Depew, NY) as we have described previously.5,19
Statistics
Data are presented as means ± SEM. Statistical t-tests were performed using GraphPad Prism (version 5 for Mac OS X; GraphPad, La Jolla, CA), using a criterion of P < 0.05 as statistically significant. In any measurement where data were obtained from both eyes of a rat, the data were pooled per rat before the statistical analysis.
Results
Experiments were performed on diabetic (STZ) and age-matched nondiabetic control rats approximately two months following injection of either STZ or vehicle alone. The time between injection and the day of the experiment averaged 60 ± 1 days for both groups. STZ rats (N = 41) gained on average approximately 150 g body weight over this study period, increasing from 137 ± 3 to 282 ± 7 g, while age-matched control rats (N = 45) typically gained >300 g, increasing from 144 ± 3 to 465 ± 7 g. During this same period, plasma glucose values increased by a factor of approximately 3 in the STZ rats, increasing from 162 ± 4 to 548 ± 15 mg/dL, with plasma glucose remaining near the initial values in the controls (170 ± 4 mg/dL initial, 159 ± 4 mg/dL final). Three of the 41 STZ rats had final glucose values exceeding the glucometer maximum of 750 mg/dL and, therefore, were assigned values of 750 mg/dL in the calculated mean.
In a subset of rats, fluorescent microspheres were injected into the left ventricle in a protocol measuring retinal blood flow, where the number of microspheres lodged in the tissue is proportional to the blood flow rate. Figure 4A gives an example flat mount of the retinal tissue, showing the fluorescent microspheres in one field of view. The number of microspheres lodged in diabetic retinas averaged 124 ± 20 per retina (N = 10 rats), which was statistically lower than in controls, 190 ± 20 per retina (N = 9 rats, P < 0.05). In each rat, the number of retinal microspheres was multiplied by the femoral blood withdrawal rate and divided by the number of microspheres found in the femoral blood sample to calculate retinal blood flow rate. As shown in Figure 4B, retinal blood flow rates averaged approximately 33% lower in the diabetic rats (P < 0.001).
Figure 4.
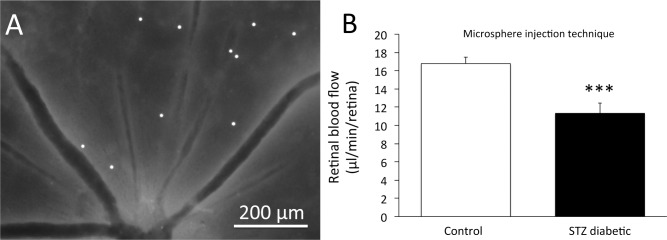
(A) Retinal flat mount showing the presence of 8 μm diameter fluorescent microspheres lodged in the arteriolar branches leading to the capillaries. (B) Retinal blood flow rate in nondiabetic control rats (N = 9) and STZ-injected diabetic rats (N = 10), with the flow rate calculated from the number of microspheres counted in the flat mounts. ***P < 0.001 between the two groups. Data are presented as means ± SE.
A Doppler flow probe was used in a subset of the rats to obtain nonspecific (i.e., not specific to the retina) values of ocular blood flow. The Doppler flow values decreased in the diabetic rats by approximately 35 to 40% (P < 0.01), from 133 ± 10 mL/min/100 g in controls (N = 16) to 85 ± 7 mL/min/100 g in the diabetic rats (N = 12). Although this percentage decrease is similar to the results of the microsphere technique, it should be noted that the Doppler values are influenced by flow not only in the retina, but also by other vascularized ocular tissues, such as the choroid.
Using a second measure of retinal blood flow, mean arteriolar and venular transit times were obtained in a protocol in which fluorescent dextran was infused into the bloodstream. Figure 5 provides the calculated values of the mean circulation time (i.e., the difference between the mean retinal arteriolar and venular transit times), with the unexpected result of circulation times being decreased dramatically (i.e., faster) in the diabetic retina by a factor of almost three (0.95 ± 0.16 seconds in N = 12 controls versus 0.34 ± 0.09 seconds in N = 9 STZ rats). Vascular diameters were measured for >90% of the control vessels, and for >80% of the STZ vessels; that is, for all the vessels in which the optical clarity of the eye allowed sufficient resolution, with cataract formation in some STZ rats interfering with light transmission. No statistically significant differences in diameters were found, with arterioles averaging 75 ± 4 μm in controls versus 76 ± 5 μm in STZ rats, and venules averaging 105 ± 5 μm in controls versus 99 ± 6 μm in STZ rats (pooled averages per rat). Combining the MCT with the estimated retinal blood volume index, (Dart2 + Dven2), the retinal blood flow index ([Dart2 + Dven2]/MCT) can be estimated to increase by a factor of approximately 2.6 in the diabetic rats (17,500 μm2/s in controls versus 45,800 μm2/s in STZ rats). These results contrast dramatically with the results from the microsphere technique, where the changes were in the opposite direction.
Figure 5. .
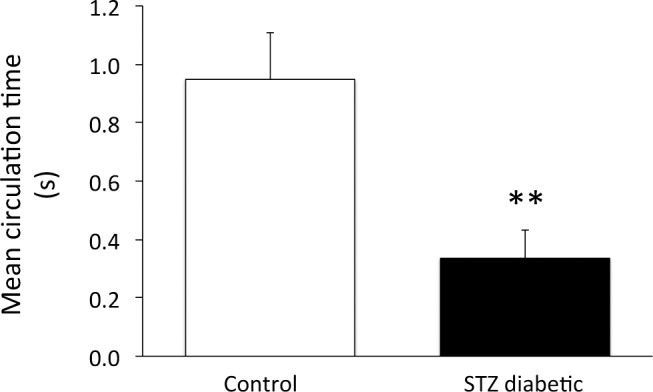
Mean circulation time of FITC-dextran through the retina of nondiabetic control rats (N = 12) and STZ-injected diabetic rats (N = 9). **P < 0.01 between the two groups. Data are presented as means ± SE.
One possible explanation for the faster transit of blood through the diabetic retina is that the capillary beds could be occluded, causing the blood to flow only through superficial retinal pathways (Fig. 6). Normally, most retinal blood flow branches from the primary arterioles into vessels that dive down into the inner and deep capillary layers, with the blood returning to the superficial layer after draining into the venules. In an extreme case where the deeper capillaries are occluded completely, the flow would pass from the arterioles to the venules more directly and possibly much more rapidly. However, in our experiments (Fig. 7), we did not see any substantial capillary occlusion, with the number of capillaries perfused with injected fluorescent dextran similar between controls (N = 10 rats) and STZ (N = 8 rats) – no statistical differences in capillary density were found in either the inner or deep capillary beds.
Figure 6. .
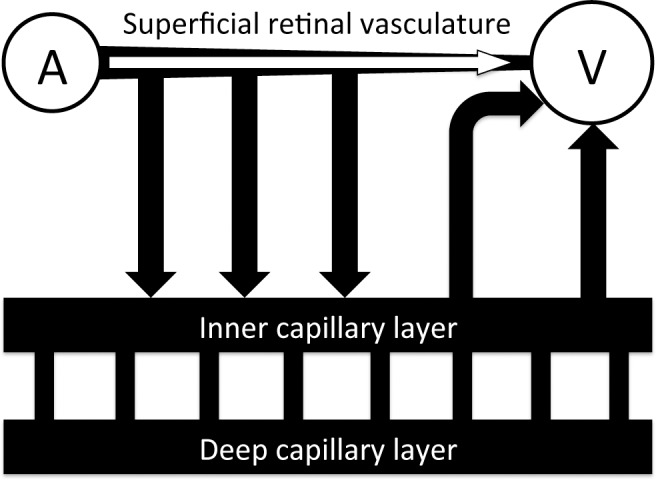
Depiction of the pathways available for blood flow to pass from the superficial arterioles into the superficial venules. In addition to the pathways leading to the inner and deep capillary layers, blood can flow more directly through the superficial layer.
Figure 7. .
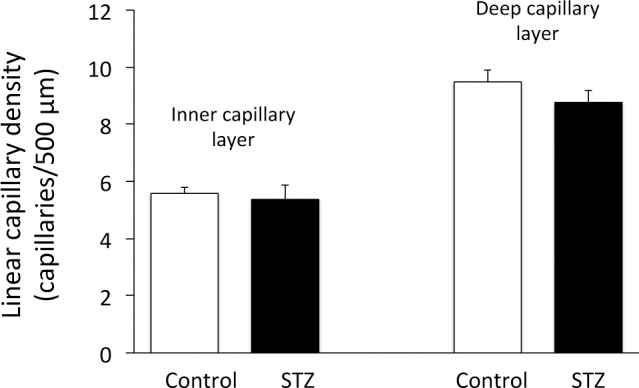
Linear capillary density in nondiabetic control rats (N = 10) and STZ-injected diabetic rats (N = 8), in the inner and deep capillary layers. No statistical differences between the two groups were found. Data are presented as means ± SE.
A second possibility (which is similar to the first) that could explain the faster transit through the diabetic retina is that the capillary beds still are flowing in the STZ rats, but that a lower fraction of the retinal blood flow passes through the inner and deep capillaries, with a higher than normal fraction of blood flowing through superficial arteriovenular pathways. To address this possibility, fluorescently-labeled RBCs were infused into a subset of the rats (N = 8 control and N = 10 STZ), and the distribution of the fluorescent RBCs in the vascular layers was counted using confocal microscope images (Fig. 3). In control rats, the number of fluorescent RBCs in the inner and deep capillary layers outnumbered the RBCs in the superficial branches of the primary arterioles, by a factor of 1.56 ± 0.11. However, in the diabetic rats, this ratio decreased substantially to 0.89 ± 0.13 (P < 0.01, Fig. 8), indicating that a smaller fraction of blood cells (and probably less total blood volume per unit time) travels through the inner and deep capillary layers in the diabetic animal. A higher fraction of retinal blood in the diabetic rats, therefore, travels through the faster superficial route shown in Figure 6, bypassing the more lengthy and time-consuming pathways through the capillary beds.
Figure 8. .
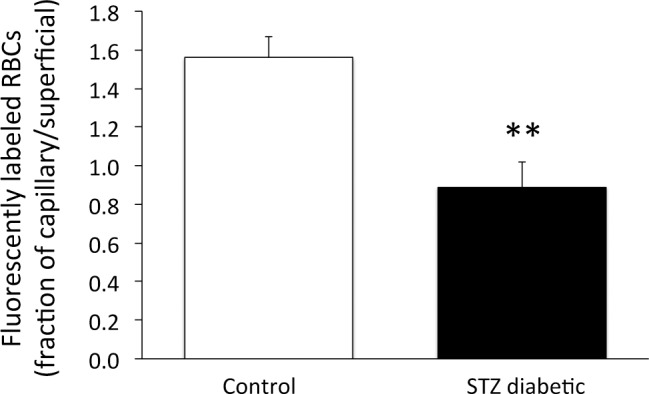
From confocal microscopy of retinal flat mounts, the ratio of DiI-labeled RBCs in the combined inner and deep capillary layers divided by the number in the superficial vessels branching from the primary arteriole. **P < 0.01 between the two groups; N = 8 controls and N = 10 STZ. Data are presented as means ± SE.
Mean arterial pressure (MAP) and IOP were measured in a subset of the rats to determine the potential influence of these pressures on ocular perfusion. MAP under anesthesia was found to be 12% lower (P < 0.05) in the STZ rats (89 ± 4 mm Hg, N = 19), compared to controls (102 ± 4 mm Hg, N = 21). Measurements of IOP were similar between the two groups, with values of 17.3 ± 0.6 mm Hg in controls (N = 16) and 16.5 ± 0.9 mm Hg in STZ (N = 14). Arterial blood gas data of the anesthetized rats are provided in the Table, with significant differences between N = 16 control rats and N = 10 STZ rats in total CO2, HCO3−, and base excess, but no differences in pH, pO2, O2 saturation, or pCO2.
Table.
Arterial Blood Gas Data, Presented as Means ± SE
|
|
Control,
N
= 16 |
STZ,
N
= 10 |
| pH | 7.38 ± 0.01 | 7.38 ± 0.01 |
| pO2, mm Hg | 89 ± 4 | 77 ± 6 |
| Oxygen saturation, % | 95 ± 1 | 93 ± 2 |
| pCO2, mm Hg | 41 ± 2 | 46 ± 2 |
| Total CO2, mM | 25.2 ± 0.4 | 28.5 ± 1.0* |
| HCO3−, mM | 23.9 ± 0.4 | 27.0 ± 0.9† |
| Base excess, mM | −1.3 ± 0.3 | +1.8 ± 0.8† |
P < 0.01 versus control.
P < 0.001 versus control.
Discussion
Our results suggested two major alterations in blood flow in the diabetic retina. Firstly, the microsphere infusion experiments indicated that retinal blood flow rate decreased by approximately 33% in STZ rats 2 months after becoming diabetic. This percentage change in flow is very similar to the 20% to 45% decreases that we have reported in several other studies using intravital microscopy, in models lasting from 3 to 26 weeks of hyperglycemia in mice and rats, using STZ and genetic models of type I diabetes.5–11,19 Secondly, the mean transit time technique, which demonstrated unexpected rapid transit from arterioles to venules in diabetes, suggested that much of the blood flow is being shunted through the superficial retinal layer rather than being allowed to flow through the deeper capillary layers. Our RBC distribution experiments appear to confirm this redistribution. The importance of these results goes beyond a caution of using clearance-type blood flow indices, but also demonstrates a potentially pathologic redistribution in the diabetic retina whereby nutrient delivery to the midretina could be attenuated substantially.
Our current measurements of retinal blood flow with microspheres, and our previous measurements using intravital microscopy, are consistent with a retinal blood flow decrease early in experimental diabetes. However, at least two previous studies have reported early increases in retinal blood flow in diabetic rats.12,13 In one of these,12 blood flow was measured by the retinal clearance rate of infused hydrogen, where the arteriolar, venular, and tissue concentrations were analyzed in a method somewhat similar to our current study's mean circulation time assay, which quantified the clearance of a fluorescent plasma marker. It is possible that the hydrogen clearance technique may suffer from similar limitations as with the mean transit time assay; that is, a higher proportion of the infused hydrogen in the previous study may have been cleared more rapidly in the diabetic retina if a higher fraction of flow was being shunted through the superficial layer. In addition, another limitation of using the mean circulation time assay in rats is the rapid recirculation time of the blood from the head to the heart and back to the head again, which takes less than 10 seconds. This short recirculation time prevents an adequate assessment of the potentially slower pathways of retinal capillary flow, with the tail of the fluorescent intensity curves obscured by the returning flow (Fig. 1C). The tail of the intensity curve could be highly influential to the actual – rather than estimated – mean transit time if a significant proportion of retinal blood flow travels very slowly through the capillary bed.
In another report suggesting an early diabetes-induced increase in retinal blood flow,13 the investigators infused microspheres, in a technique somewhat similar to our current method. However, two major possible complications were included in their study – specifically nonoptimal microsphere size (they used 15 μm beads) and number (∼20 microspheres lodged in the entire retina). Wang et al. have reported an optimization of the microsphere measure of retinal blood flow, with 15 μm diameter beads found to be unacceptable due to their inability to lodge in the appropriate size of precapillary arterioles (8 μm beads were found to be optimal), and with hundreds of lodged microspheres preferred for adequate sensitivity.15 We followed the optimal dose and size recommendations in our present study, and believe that our results should give a more accurate assessment of retinal blood flow than in the study showing an increase in flow.13
Anesthetics alter systemic parameters and, therefore, influence in vivo measurements. Inasmuch as we used the same anesthetic combination (ketamine/pentobarbital) in both our techniques of measuring retinal blood flow in our study (microspheres, mean transit time), it is unlikely that the contrasting results of the two techniques are a consequence of the anesthetic. It should be noted that the 33% reduction in retinal blood flow that we measured with the microsphere technique in anesthetized rats essentially is identical to the decrease seen in unanesthetized diabetic rats at almost the same time point of diabetes (flow measured by quantitative autoradiography at 6 weeks STZ), as published previously by Pouliot et al.20 When using clearance-type measures of retinal blood flow, our mean transit time data (in rats anesthetized with ketamine/pentobarbital), as well as the previously reported hydrogen clearance technique (Inactin anesthesia),12 showed apparent increases in the respective retinal blood flow indices, with this finding independent of the choice of anesthetic.
No insulin was administered to the STZ rats in our study and, therefore, plasma glucose values were high. It should be noted that tight glucose control (plasma glucose not significantly different from nondiabetic controls) has been found to attenuate diabetes-induced decreases in a mean circulation time index of retinal blood flow (from a 24% to a 7% decrease) at a 4-week time point in amobarbital-anesthetized STZ rats,21 consistent with a role for hyperglycemia in the microvascular alterations. Their finding of a diabetes-induced decrease with a mean circulation time flow index possibly suggests that the redistribution of blood flow that we observe at 8 weeks STZ might not be significant at an earlier 4-week time point.
We found no change in capillary density between control and diabetic rats in our study, whereas a series of studies by de la Cruz et al. has suggested a major loss of capillary density in the same model (STZ injection of rats).22–25 However, despite this apparent discrepancy, the difference is likely to be attributed to the methodology. We used a plasma marker to identify flowing capillaries, whereas their group used labeling with horseradish peroxidase (HRP), with the HRP able to bind RBCs. Therefore, even though their results were interpreted as a loss of vascularity, their data may be consistent with ours in finding a substantially lower number of RBCs entering the capillary beds of the midretina.
Our results suggested two possible mechanisms for retinal oxygen and nutrient delivery to be attenuated in the early stages of experimental diabetes: a significant drop in retinal blood flow and a redistribution of RBC flow away from the capillary beds. Based on these changes, significant hypoxia of the retina at 2 months of diabetes in these rats could be predicted. In contrast with this prediction, however, we previously have reported the observation of the opposite, that is, less hypoxia in the STZ rat retina (at the close time point of 3 months).26 In the previous study, our assay used the probe pimonidazole (Hypoxyprobe, Burlington, MA), with the results from this probe agreeing with the report by Lau and Linsenmeier (Lau JC, Linsenmeier RA. IOVS 2010;51:ARVO E-Abstract 5644) who came to the same conclusion when measuring oxygen with microelectrodes in the same STZ model (also at 3 months). Although speculative, the lack of hypoxia in the face of substantially reduced capillary RBC flow could occur with a decrease in retinal metabolism. This possibility was discussed a number of years ago,27,28 with speculations that elevations in oxygen due to a decreased metabolic rate could cause a decrease in retinal blood flow (the flow changes that we observe).
However, even though significant retinal hypoxia may not occur in the first few months of diabetes, the decrease in overall retinal blood flow, as well as a decrease in the number of RBCs flowing through the capillaries, may worsen progressively with time. In the previously mentioned studies by de la Cruz et al., capillary RBC labeling by HRP decreases by approximately 55% to 60% in STZ rats by two months of hyperglycemia, and continues to decrease to only approximately 10% to 25% of controls by the 3-month time point.22–25 In the STZ mouse studies performed by Kumar and Zhou, retinal diameters decreased by approximately 10% to 15% by 1 month of diabetes and then worsened to a 25% decrease by 4 months.29 With resistance to blood flow being inversely proportional to the fourth power of diameter, a 25% decrease in retinal diameters can be highly significant. In our own studies of 6-month old diabetic Ins2Akita mice, blood flow is reduced severely by approximately 40% as assessed by intravital microscopy.11 If the decreases in RBC delivery become severe enough, hypoxia is likely to ensue, and it is possible that hypoxia develops sometime before 9 months of hyperglycemia in Ins2Akita mice, if the recently reported angiogenesis at this time point30 is related to an oxygen deficit.
The two main diabetes-induced retinal vascular changes that we observed in our study, a decrease in blood flow rate and a redistribution of flow away from the capillaries, are possibly linked. Constriction of capillaries or precapillary arterioles can shunt flow away from the capillary beds and, at the same time, increase vascular resistance to cause a decrease in blood flow. However, it should be mentioned that the STZ-induced decreases in blood flow also may be influenced by a slightly lower perfusion pressure, which can be defined as 0.67(Part) − IOP.31 Substituting our data into this equation yields a perfusion pressure in STZ rats of 0.67(89) − 16.5 = 43 mm Hg, compared to 0.67(102) − 17.3 = 51 mm Hg in controls. Given that autoregulation could be impaired in STZ rats, we cannot exclude the possibility that this difference in perfusion pressure may contribute to the decreased retinal blood flow rates that we observed. However, it should be mentioned that the same decrease in retinal blood flow that we observe (∼33%) is reported in a similar study where there was no STZ-induced change in mean arterial blood pressure.20
The limitations of the different flow measures have been mentioned, including a requirement for sufficient numbers and size of beads for the microsphere technique, the effect of flow shunting and systemic recirculation on the mean transit time index, and the nonspecific nature of the laser Doppler meter that is influenced by the choroidal microcirculation, with these limitations introducing a challenge to interpret correctly the differences among the data that these techniques provide. However, each of these techniques can be valuable in describing different aspects of the microcirculation, and even though we suggest that the mean circulation time index provides incorrect values of relative flow in the presence of arteriovenous shunting, this index can be helpful in recognizing the potentially important redistribution of flow.
The current experiments examined retinal blood flow in diabetic rats, whereas other reports have focused on diabetic mice. As mentioned earlier in the Discussion, we have observed 20% to 45% decreases in retinal blood flow in diabetic mice and rats using intravital microscopic measurements of RBC velocities and vascular diameters to measure perfusion accurately.5–11,19 However, due to cataract formation in rats that have been diabetic for several months, the method of intravital microscopy becomes more difficult. Another technique (besides microspheres) that avoids this optical limitation is magnetic resonance imaging, which has been used in a genetic mouse model of diabetes (Ins2Akita mice), where the observed decreases in retinal blood flow were found to be statistically significant at 7.5 months, but not at 2.5 months.32
In summary, the data in this report using fluorescently-labeled microspheres appear to confirm our earlier reports of decreased retinal blood flow rate in the initial two months of experimental diabetes, with our previous measures performed by intravital microscopy. However, in addition, our experiments using a mean circulation time suggest that the routes of retinal transit are substantially altered in the diabetic retina, with a loss of RBCs flowing through the capillaries of the mid-retina.
Acknowledgments
Supported by NIH EY017599 (NRH).
Disclosure: W. Leskova, None; M.N. Watts, None; P.R. Carter, None; R.S. Eshaq, None; N.R. Harris, None
References
- 1. Clermont AC, Aiello LP, Mori F, et al. Vascular endothelial growth factor and severity of nonproliferative diabetic retinopathy mediate retinal hemodynamics in vivo: a potential role for vascular endothelial growth factor in the progression of nonproliferative diabetic retinopathy. Am J Ophthalmol. 1997; 124: 433–446 [DOI] [PubMed] [Google Scholar]
- 2. Bursell SE, Clermont AC, Kinsley BT, et al. Retinal blood flow changes in patients with insulin-dependent diabetes mellitus and no diabetic retinopathy. Invest Ophthalmol Vis Sci. 1996; 37: 886–897 [PubMed] [Google Scholar]
- 3. Kawagishi T, Nishizawa Y, Emoto M, et al. Impaired retinal artery blood flow in IDDM patients before clinical manifestations of diabetic retinopathy. Diabetes Care. 1995; 18: 1544–1549 [DOI] [PubMed] [Google Scholar]
- 4. Curtis TM, Gardiner TA, Stitt AW. Microvascular lesions of diabetic retinopathy: clues towards understanding pathogenesis? Eye (Lond). 2009; 23: 1496–1508 [DOI] [PubMed] [Google Scholar]
- 5. Wright WS, Harris NR. Ozagrel attenuates early streptozotocin-induced constriction of arterioles in the mouse retina. Exp Eye Res. 2008; 86: 528–536 [DOI] [PMC free article] [PubMed] [Google Scholar]
- 6. Lee S, Morgan GA, Harris NR. Ozagrel reverses streptozotocin-induced constriction of arterioles in rat retina. Microvasc Res. 2008; 76: 217–223 [DOI] [PMC free article] [PubMed] [Google Scholar]
- 7. Wright WS, Messina JE, Harris NR. Attenuation of diabetes-induced retinal vasoconstriction by a thromboxane receptor antagonist. Exp Eye Res. 2009; 88: 106–112 [DOI] [PMC free article] [PubMed] [Google Scholar]
- 8. Wang Z, Yadav AS, Leskova W, et al. Attenuation of streptozotocin-induced microvascular changes in the mouse retina with the endothelin receptor A antagonist atrasentan. Exp Eye Res. 2010; 91: 670–675 [DOI] [PMC free article] [PubMed] [Google Scholar]
- 9. Yadav AS, Harris NR. Effect of tempol on diabetes-induced decreases in retinal blood flow in the mouse. Curr Eye Res. 2011; 36: 456–461 [DOI] [PubMed] [Google Scholar]
- 10. Wang Z, Yadav AS, Leskova W, et al. Inhibition of 20-HETE attenuates diabetes-induced decreases in retinal hemodynamics. Exp Eye Res. 2011; 93: 108–113 [DOI] [PMC free article] [PubMed] [Google Scholar]
- 11. Wright WS, Yadav AS, McElhatten RM, et al. Retinal blood flow abnormalities following six months of hyperglycemia in the Ins2(Akita) mouse. Exp Eye Res. 2012; 98: 9–15 [DOI] [PMC free article] [PubMed] [Google Scholar]
- 12. Cringle SJ, Yu DY, Alder VA, et al. Retinal blood flow by hydrogen clearance polarography in the streptozotocin-induced diabetic rat. Invest Ophthalmol Vis Sci. 1993; 34: 1716–1721 [PubMed] [Google Scholar]
- 13. Tilton RG, Chang K, Pugliese G, et al. Prevention of hemodynamic and vascular albumin filtration changes in diabetic rats by aldose reductase inhibitors. Diabetes. 1989; 38: 1258–1270 [DOI] [PubMed] [Google Scholar]
- 14. Kur J, Newman EA, Chan-Ling T. Cellular and physiological mechanisms underlying blood flow regulation in the retina and choroid in health and disease. Prog Retin Eye Res. 2012; 31: 377–406 [DOI] [PMC free article] [PubMed] [Google Scholar]
- 15. Wang L, Fortune B, Cull G, et al. Microspheres method for ocular blood flow measurement in rats: size and dose optimization. Exp Eye Res. 2007; 84: 108–117 [DOI] [PubMed] [Google Scholar]
- 16. Wang L, Grant C, Fortune B, et al. Retinal and choroidal vasoreactivity to altered PaCO2 in rat measured with a modified microsphere technique. Exp Eye Res. 2008; 86: 908–913 [DOI] [PubMed] [Google Scholar]
- 17. Bulpitt CJ, Dollery CT. Estimation of retinal blood flow by measurement of the mean circulation time. Cardiovasc Res. 1971; 5: 406–412 [DOI] [PubMed] [Google Scholar]
- 18. Meier P, Zierler KL. On the theory of the indicator-dilution method for measurement of blood flow and volume. J Appl Physiol. 1954; 6: 731–744 [DOI] [PubMed] [Google Scholar]
- 19. Lee S, Harris NR. Losartan and ozagrel reverse retinal arteriolar constriction in nonobese diabetic mice. Microcirculation. 2008; 15: 379–387 [DOI] [PMC free article] [PubMed] [Google Scholar]
- 20. Pouliot M, Hetu S, Lahjouji K, et al. Modulation of retinal blood flow by kinin B(1) receptor in Streptozotocin-diabetic rats. Exp Eye Res. 2011; 92: 482–489 [DOI] [PubMed] [Google Scholar]
- 21. Higashi S, Clermont AC, Dhir V, et al. Reversibility of retinal flow abnormalities is disease-duration dependent in diabetic rats. Diabetes. 1998; 47: 653–659 [DOI] [PubMed] [Google Scholar]
- 22. De La Cruz JP, Jebrouni N, Lopez-Villodres JA, et al. Effects of terutroban, a thromboxane/prostaglandin endoperoxide receptor antagonist, on retinal vascularity in diabetic rats. Diabetes Metab Res Rev. 2012; 28: 132–138 [DOI] [PubMed] [Google Scholar]
- 23. De la Cruz JP, Moreno A, Munoz M, et al. Effect of aspirin plus dipyridamole on the retinal vascular pattern in experimental diabetes mellitus. J Pharmacol Exp Ther. 1997; 280: 454–459 [PubMed] [Google Scholar]
- 24. De La Cruz JP, Moreno A, Ruiz-Ruiz MI, et al. Effect of DT-TX 30, a combined thromboxane synthase inhibitor and thromboxane receptor antagonist, on retinal vascularity in experimental diabetes mellitus. Thromb Res. 2000; 97: 125–131 [DOI] [PubMed] [Google Scholar]
- 25. De La Cruz P, Arrebola M, Gonzalez-Correa A, et al. Effects of clopidogrel and ticlopidine on experimental diabetic ischemic retinopathy in rats. Naunyn Schmiedebergs Arch Pharmacol. 2003; 367: 204–210 [DOI] [PubMed] [Google Scholar]
- 26. Wright WS, McElhatten RM, Messina JE, et al. Hypoxia and the expression of HIF-1alpha and HIF-2alpha in the retina of streptozotocin-injected mice and rats. Exp Eye Res. 2010; 90: 405–412 [DOI] [PMC free article] [PubMed] [Google Scholar]
- 27. Small KW, Stefansson E, Hatchell DL. Retinal blood flow in normal and diabetic dogs. Invest Ophthalmol Vis Sci. 1987; 28: 672–675 [PubMed] [Google Scholar]
- 28. Rimmer T, Linsenmeier RA. Resistance of diabetic rat electroretinogram to hypoxemia. Invest Ophthalmol Vis Sci. 1993; 34: 3246–3252 [PubMed] [Google Scholar]
- 29. Kumar S, Zhuo L. Quantitative analysis of pupillary light reflex by real-time autofluorescent imaging in a diabetic mouse model. Exp Eye Res. 2011; 92: 164–172 [DOI] [PubMed] [Google Scholar]
- 30. Han Z, Guo J, Conley SM, et al. Retinal angiogenesis in the Ins2Akita mouse model of diabetic retinopathy. Invest Ophthalmol Vis Sci. 2013; 54: 574–584 [DOI] [PMC free article] [PubMed] [Google Scholar]
- 31. Robinson F, Riva CE, Grunwald JE, et al. Retinal blood flow autoregulation in response to an acute increase in blood pressure. Invest Ophthalmol Vis Sci. 1986; 27: 722–726 [PubMed] [Google Scholar]
- 32. Muir ER, Renteria RC, Duong TQ. Reduced ocular blood flow as an early indicator of diabetic retinopathy in a mouse model of diabetes. Invest Ophthalmol Vis Sci. 2012; 53: 6488–6494 [DOI] [PMC free article] [PubMed] [Google Scholar]