

Abstract
The mitochondrial ATP synthase from yeast S. cerevisiae has been genetically modified, purified in a functional form, and characterized with regard to lipid requirement, compatibility with a variety of detergents, and the steric limit with rotation of the central stalk has been assessed. The ATP synthase has been modified on the N-terminus of the β-subunit to include a His6 tag for Ni-chelate affinity purification. The enzyme is purified by a two-step procedure from submitochondrial particles and the resulting enzyme demonstrates lipid dependent oligomycin sensitive ATPase activity of 50 units/mg. The yeast ATP synthase shows a strong lipid selectivity, with cardiolipin (CL) being the most effective activating lipid and there are 30 moles CL bound per mole enzyme at saturation. Green Fluorescent Protein (GFP) has also been fused to the C-terminus of the ε-subunit to create a steric block for rotation of the central stalk. The ε-GFP fusion peptide is imported into the mitochondrion, assembled with the ATP synthase, and inhibits ATP synthetic and hydrolytic activity of the enzyme. F1Fo ATP synthase with ε-GFP was purified to homogeneity and serves as an excellent enzyme for two- and three-dimensional crystallization studies.
Keywords: ATP synthase, F1Fo ATPase, Mitochondrion, Oxidative phosphorylation
Introduction
The mitochondrial ATP synthase is composed of at least 28 polypeptides with an overall molecular weight of about 650 kDa. The enzyme is composed of the catalytic portion of the enzyme, F1, the integral membrane proton pore, Fo, and the stator. F1 is comprised of subunits α3β3γδε, with the active site formed at the interface of the α/β pair. Fo is a proton turbine comprised minimally of subunits abc10 in yeast (Stock et al. 1999; Watt et al. 2010) and abc8 in bovine (Watt et al. 2010) and it drives the rotation of the central stalk (γδε), effecting ATP synthesis. F1 is held in position by the stator, or peripheral stalk, comprised minimally of subunits b, d, 5, and F6 (Kane Dickson et al. 2006). During ATP synthesis or hydrolysis, the central stalk rotates within the core of F1 sweeping past the peripheral stalk every 360°. Rotation of the central stalk has been observed directly with single particle studies during the hydrolysis of ATP (Noji et al. 1997; Yasuda et al. 1998). These studies demonstrate that rotation occurs in major steps of 120° driven by hydrolysis of ATP. The position of the γδε-subunits within the core of F1 determines the conformational state of each of the three catalytic sites. As such, at any one time, there are three different possible conformational rotomers, with regard to the position of the central stalk relative to the stator.
Fo is embedded in the membrane and associated with the central stalk of F1. The association of Fo with the central stalk, couples the movement of protons with the synthesis of ATP. Thus, the mitochondrial ATP synthase acts as a molecular motor that converts the energy of the proton gradient into the phosphorylation of ADP forming ATP (Rondelez et al. 2005).
The yeast mitochondrial ATP synthase is highly homologous to the mammalian enzyme in subunit composition, structure, and activity. While the crystal structure has not been determined for the entire mitochondrial ATP synthase from bovine or yeast, the structure of subunits that are known indicates structural and functional homology. The crystal structure of F1 has been solved for the bovine (Abrahams et al. 1994), rat liver (Bianchet et al. 1998) and yeast (Kabaleeswaran et al. 2006) mitochondrial enzymes and the differences in the α-carbon positions are less than 1 Å for the individual α- and β-subunits and 1.2Å for the α3β3 subcomplex (Kabaleeswaran et al. 2006). While there are 10 subunits c in yeast and 8 in bovine, the structure of the c-subunits are apparently similar and sequence homology clearly indicates that the functional role is conserved (Stock et al. 1999; Watt et al. 2010). The homologies of the primary structures of the stator subunits are not high, but their functions are likely conserved as, for example, expression of the rat and bovine stator subunits complement the corresponding yeast deletion mutations (Prescott et al. 1995; Velours et al. 2001). Thus, the information on the structure and function of the yeast enzyme is directly applicable to the mammalian enzyme.
The crystal structure of bovine F1 ATPase provided a number of insights and allowed extensive studies, which provided a much greater understanding on the mechanism of the catalytic reaction. However, the lack of a high-resolution structure of the entire ATP synthase complex has slowed the progress into the understanding of the molecular details involving the proton translocation coupled to rotation of the central stalk. The purification, stability, lipid requirements, and full activity of the enzyme are critical in the biochemical, biophysical, and structural studies of the enzyme.
Yeast S. cerevisiae offers a well-developed genetic system that allows the modification of protein for purification and to enhance crystallization. This study uses yeast genetics to modify the mitochondrial ATP synthase to aid in the purification and crystallization. This study systematically investigates the lipid requirements and the stability when associated with a variety of detergents commonly used for crystallization of membrane proteins. The results of this study also provide an estimate on the clearance between the central stalk and the stator.
Materials and methods
Yeast S. cerevisiae W303-1B (Mat α, ade2-1, his3-1, leu2-3, 112, trp1-1, ura3-1) (a gift from Dr. B. Trumpower, Dartmouth University) was the parent strain of the yeast strains generated in this study. W303-1B was the parent to DMY301, Mat α, ade2-1, his3-1, leu2-3, 112, trp1-1, ura3-1, atp2−∷LEU2 with the atp2 null mutation made as described (Mueller 1988). DMY301 was a parent for strain VJY001, which was deleted of the gene encoding ATP15 (atp15Δ∷KAN). VJY001 was a parent for strains VJY002, VJY004, and VJY006, which included ATP2 integrated at the TRP1 locus and ε-cytochrome b562, ε-GFP, and ε-cytochrome c-peroxidase integrated at the URA3 locus, respectively. Yeast-E. coli shuttle plasmids pRS304 and pRS306 (Sikorski and Hieter 1989) were used in this study for generation of the fusion constructs and expression. E. coli strain XL1-Blue (Agilent Technologies, Santa Clara, CA) was used for the bacterial recombinant studies.
Growth medium
Standard media for yeast growth were: YPAD (1% yeast extract, 2% peptone, 2% glucose, 30 mg/L adenine), YPD (1% yeast extract, 2% peptone, 2% glucose), YPG (1% yeast extract, 2% peptone, 3% glycerol), synthetic media (SD) (0.67% yeast nitrogen base, 2% glucose supplemented with amino acids at 20 mg/L) or semi-synthetic media (Yaffe 1991). Geneticin (G418) was used at concentration of 200 μg/ml when indicated.
Generation of the ATP15 fusion genes and the expression yeast strains
The ATP15 open reading frame (ORF) (encodes the ε-subunit) was deleted from yeast DMY301 as described previously (Lai-Zhang et al. 1999) generating strain, VJY001. The modified ATP15 genes coding for proteins of various sizes were constructed by fusing the ATP15 ORF with the ORF of cytochrome b562, green fluorescence protein (GFP) or cytochrome-c-peroxidase-1 (CCP1) using polymerase chain reaction (PCR). In the first round of PCR, the ORFs of ATP15 and the fusion partners were amplified. In the second round, the amplified ORFs were amplified together forming the fusion products. The resulting PCR products were transformed into yeast with linear form of pRS314ATP2/Kan (Lai-Zhang and Mueller 2000). Homologous recombination across the gap resulted in the ORF of the fusion protein behind the transcriptional promoter and leader peptide and of the ATP2 gene, as well as in front of the transcriptional termination site (Lai-Zhang and Mueller 2000). DNAwas isolated from yeast, amplified in E. coli, purified, and sequenced to ensure the correct construct. Fusion constructs were subcloned into pRS306 for integration into the chromosome. Fusion clones, along with a plasmid containing ATP2 with the His6 tag (Mueller et al. 2004), were transformed into yeast strains with null mutations in ATP2 and ATP15.
Yeast transformation was performed as described (Gietz et al. 1992). The plasmid with ATP2 in pRS304 digested with Bsu36I or the plasmid containing ATP15 in pRS306 digested with NcoI, was transformed into yeast and the transformants were selected by growth of cells on minimal media devoid of tryptophan or uracil, respectively.
The percentage of cytoplasmic petite cells was determined as described (Xiao et al. 2000) and with 2, 3, 5-triphenyl tetrazolium chloride (Ogur et al. 1957).
Purification of F1 ATPase enzyme
Yeast strains expressing the genetically modified β-subunit with His6 tag at the amino terminus (Mueller et al. 2004) were grown in a Bioflo 5000 fermentor (New Brunswick Scientific, Piscataway, NJ) at 30 °C, pH controlled to 5.5, and using a YSI 2700 glucose monitor (Yellow Springs, OH) and software to control the glucose concentration to about 0.2%. Submitochondrial particles (SMP) were prepared from the yeast strain as described (Mueller et al. 2004). F1 ATPase was released from SMP with chloroform. The chloroform-extracted enzyme was bound on to the Ni-Superflow (Qiagene, Valencia, CA) column (15 ml) and washed with buffer A (50 mM phosphate pH 7.5, 0.3 M NaCl, 10% methanol v/v, 10% glycerol w/v, 15 mM imidazole) and eluted with buffer A with 300 mM imidazole. The eluted protein containing fractions were pooled and concentrated using the 100 KDa cutoff spin concentrator to a volume of less than 1 ml. The concentrated enzyme was purified on a Superdex 200 size exclusion column (150 ml, equilibrated with 0.25 M sucrose, 0.2 M NaCl, 0.05 M Tris-Cl, 1 mM EDTA, 1 mM ATP, pH 8.0). The enzyme containing fractions eluted off the column were analyzed for purity and homogeneity by SDS polyacrylamide electrophoresis (Laemmli 1970) followed by staining with Coomassie Blue. All buffers contained 5 mM each of ε-amino-caproic acid (EACA) and benzamidine and 1 mM phenylmethylsulfonyl fluoride (PMSF).
Purification of F1Fo ATP synthase
Submitochondrial particles (SMP) (protein concentration at 9 mg/ml) were suspended in buffer containing 50 mM phosphate pH 7.8, 0.3 M NaCl, 10% glycerol, 1 mM ATP and 1% w/v n-dodecyl-β-D-maltoside (DDM) and mixed on ice for 30 min. The solution was centrifuged at 40,000 g for 30 min, the pH was adjusted to 7.5, and imidazole was added to a final concentration of 40 mM. The enzyme was purified further on a Ni-Sepharose (GE Healthcare, Piscataway, NJ) column equilibrated with buffer containing 50 mM phosphate pH 7.5, 0.3 M NaCl, 10% glycerol, 50 mM imidazole, 0.05% DDM (A10) at 1 ml/min and washed with 10 column volumes of buffer A10. The ATP synthase eluted with buffer B10 (50 mM phosphate pH 7.5, 0.3 M NaCl, 10% glycerol, 0.4 M imidazole and 0.05% DDM). Buffers A10 and B10 also contained 5 mM EACA and 5 mM benzamidine HCl, and 1 mM PMSF. The protein containing fractions were pooled and concentrated using a 100 KDa cutoff spin concentrator. The concentrated enzyme was purified on a Superose-6 (GE Healthcare, Piscataway, NJ) size exclusion column equilibrated with buffer containing 50 mM sucrose, 20 mM Tris pH 8.0, 10% glycerol, 2 mM MgSO4, 1 mM EDTA, 0.1 M NaCl and 0.05% DDM. Fractions (300 μl) were collected and were analyzed by SDS-PAGE (Laemmli 1970) after staining with Coomassie Blue.
ATPase activity was measured as described with minor modification (Mueller 1988). The ATPase assay buffer contained 50 mM HEPES-KOH, pH 8.0, 0.25 M sucrose, 1 mM MgCl2, 0.05% DDM and with indicated amounts of phospholipids bovine heart cardiolipin (BH CL), synthetic tetramyristoyl cardiolipin (TM CL), phosphatidyl choline (PC), synthetic di-oleylphosphatidyl choline (DOPC), lyso-phosphatidyl choline (LPC) and soy lecithin (SL). The purified enzyme was incubated (5 min) in assay buffer at 30 °C and ATP hydrolysis was started by addition of ATP (4.4 mM). ATP hydrolysis was inhibited by addition of oligomycin (5 μg) or efrapeptin. Phospholipids were purchased from Avanti lipids.
Western blot analysis was performed as described (Towbin et al. 1979).
Detergent exchange
F1Fo in presence of 0.05% DDM in A10 buffer was bound on a Ni2+-Sepharose column (1 ml) (GE Healthcare, Piscataway, NJ) column. Buffer A10 (30 ml) without DDM but containing the test detergent was flowed through the column at 0.05 ml/min at 4 °C. The following detergents were tested at the indicated concentrations. 1% octyl-β-D-glucoside (OG), 0.05% n-dodecyl-β-D-maltoside (DDM), 0.2% n-decyl-β-D-maltoside (DM), 0.06% n-undecyl-β-D-thiomaltoside (UTM), 0.1% n-nonyl-β-D-thioglucoside (NTG), 0.03% Sucrose monododecaonate (SMD), 0.1% n-dodecyl-N,N-dimethylamine-N-oxide (DDAO), 0.03% ANAPOE-C12E8 (C12E8) and n-dodecyl-β-D-glucoside saturated at 4 °C (<0.008%, >0.004%) (DDG).
F1Fo eluted in buffer B10 containing the indicated detergents at the indicated concentrations. Detergents were purchased from Anatrace (Maumee, OH).
Cardiolipin dependent ATPase activity
To determine the ATPase activity and oligomycin sensitivity in presence of increasing amount of cardiolipin (TM CL) in the assay buffer, purified F1Fo (100 μg) was incubated for one hour with varying amounts of TM CL (0.17 to 34 μg) in 40 μl at 0.1% DDM. The enzyme to lipid molar ratios range used were: 1:0.62, 1:3.1, 1:6.2, 1:15.6, 1:31.2, 1:46.9, 1:62.5, 1:125 and 1:187.5. Avolume (2 μl) of the incubated sample was used for measuring ATP hydrolysis in buffer containing a low concentration of DDM (0.005%).
Cardiolipin (BH CL) was bound to purified F1Fo (5 mg) after binding to a Ni2+-Sepharose column (1 ml). The column bound enzyme was washed with buffer A10 containing 0.0075% cardiolipin (10 ml), which is 100 times molar excess of cardiolipin over F1Fo. F1Fo was eluted with Buffer B10. ATPase specific activity was measured in ATPase assay buffer containing DDM (0.05%) and BH CL (0.01%) or DDM (0.006%) alone, as indicated.
Proteoliposome preparation and proton pumping assay
A-solectin liposomes were prepared by reverse phase as described (Knowles and Penefsky 1997). Proteoliposomes were prepared by reconstituting the purified F1Fo protein in to the liposomes. Briefly, F1Fo (0.6 mg) was mixed with liposomes (0.3 ml), 20 mM Tris-SO4, 50 mM KCl, 0.2 mM EDTA (0.1 ml, REV buffer), 10% Triton-X 100 (0.06 ml) to a final volume of 0.6 ml and incubated, with mixing, for 10 min at 20 °C. Biobeads (200 mg) (BioRad, Hercules, CA) were hydrated with REV buffer, added to the mixture, mixed for 60 min at room temperature and then removed from the solution. Reconstituted proteo-liposomes (0.1 ml) were used to measure proton pumping in 1 ml final reaction volume in buffer containing 20 mM Tricine, 40 mM KH2SO4, pH 8.0, 5 mM 2-mercaptoethanol, 4.4 mM ATP, 1 mM MgSO4, and 2 μM 9-amino-6-chloro-2-methoxy acridine (ACMA). Fluorescence quenching was measured at excitation wavelength of 410 nm and emission of 475 nm. Quenching of fluorescence was initiated by addition of ATP/Mg2+ and ATP hydrolysis was inhibited by addition of oligomycin (5 μg) or 5 μl of a crude extract of efrapeptin.
Organic phosphate determination
Organic phosphate was determined as described (Ekman and Jager 1993; Van Veldhoven and Mannaerts 1987). Briefly, the sample was oxidized with 70% perchloric acid (0.2 ml) at 180 °C for 2 h and then neutralized by addition of 50% NaOH (0.1 ml). Reagent containing ammonium molybdate and malachite green was used to determine the concentration of inorganic phosphate.
Data collection and processing
The diffraction data was collected at 100 K at the APS beamline 23ID-C. The crystal-to-detector distance was 300 mm, oscillation angle 0.5°. Three wedges of 180° were collected on a large crystal, which was translated and re-centered to a new position for each wedge. The diffraction images were integrated and scaled in HKL2000 (Otwinowski and Minor 1997). The data was indexed in monoclinic unit cell with a=128.48Å, b=173.88Å, c=133.35Å, β=96.26° and the systematic absences were consistent with the space group P21. Assuming one complex of F1Fo (550 kDa) per asymmetric unit, the solvent content in the crystal is 54%. For the resolution range 50–4Å, the merging R factor for all (including symmetry-related) observations was 14.5%, average intensity over sigma<I/σI>=8.5, completeness 98.6%, average redundancy 5.3. Molecular replacement was performed in MOLREP (Vagin and Teplyakov 2010) using one F1 complex from the structure of the yeast F1 ATPase (PDB code 2HLD) and the above diffraction data. The solution was readily obtained and used for starting phases for the electron density modification in SOLOMON (Abrahams and Leslie 1996). The new electron density map revealed rather fragmented alpha helices of the C10 region and no additional electron density that could be interpreted as another subunit of the Fo subassembly. Because of the limited resolution, no further attempts were made to build a reliable model for the C10 region.
Results
The β-subunit F1-ATPase was engineered to include a His6 tag on the N-terminus of the mature β-subunit (Mueller et al. 2004). The His6 tag allowed affinity purification of the entire complex in a buffer containing appropriate detergent. Figure 1a shows the Coomassie Blue staining of the preparation from the Ni-affinity column and from fractions from the subsequent purification step using size exclusion chromatography. F1Fo was extracted in a solution of 1% DDM and purified on a Ni- affinity column and a Superose 6 column with buffers containing 0.05% DDM. The enzyme eluted from the Superose 6 column as a symmetrical single peak consistent as a monomer of the ATP synthase. The homogeneous preparation apparently contained all of the known subunits of the ATP synthase except for subunits e, g, IF1, and SFT1. Subunits e, and g are involved in dimerization of F1Fo ATP synthase and are associated only under conditions with mild detergents (Arnold et al. 1998). Consistent with the absence of these subunits, the ATP synthase elutes as a single complex on the Superose 6 column at a size that is consistent with a monomer. The purified complex has also been separated using Blue Native gels (Schägger and von Jagow 1987) and the migration was also consistent with a monomer of the ATP synthase (data not shown). Subunits IF1 and SFT1 are the natural inhibitory peptides that are associated with F1 under defined conditions. Similar to the preparations of the yeast F1 ATPase, these inhibitor peptides are lost during the purification of F1Fo (Mueller et al. 2004).
Fig. 1.

Mono-disperse preparation of coupled yeast ATP synthase. a The elution profile as analyzed by SDS PAGE from a Superose 6 size exclusion column in the presence of 0.05% DDM. The first lane shows the peptides from the enzyme purified from the Ni-Sepharose column. The fractions peak of at 42 min (0.3 ml/min) is consistent with a molecular weight of 650,000 Da. b The peptide profile as analyzed by SDS PAGE of the enzyme purified in the absence and presence of 0.03% lecithin. c The enzyme purified in the absence and presence of lecithin were incorporated into liposomes and tested for proton pumping coupled to ATP hydrolysis as described in Materials and Methods. The acidification of the internal liposome space was monitored by the fluorescence quenching of 9ACMA. The error bars show 1 standard error in this and all of the figures
As will be shown, the yeast ATP synthase shows a strict lipid requirement for activity and coupling. In order to determine if lipids were required for stability of F1Fo, the purification of the ATP synthase was performed in the presence and absence of lipid (0.03% lecithin). The Coomassie Blue staining of the peptides separated after SDS polyacrylamide gel electrophoresis indicated that the peptide compositions of the two preparations were identical (Fig. 1b). Both enzyme preparations were reconstituted into liposomes and proton pumping driven by ATP hydrolysis was measured using the pH responsive probe, 9-amino-6-chloro-methoxy acridine (9ACMA) (Fig. 1c). Based on these results, the characteristics of the enzyme were independent on the presence or absence of added lipids in the buffers during the purification.
The ATP synthase purified in the absence of added lipids and 0.05% DDM lost nearly all bound lipids based on analysis of the total organic phosphate of the enzyme after the Ni-affinity column. ATP synthase purified in the absence of lipids demonstrated lipid dependence for ATPase activity (Fig. 2). The ATPase activity is stimulated 6 fold in the presence of cardiolipin or phosphatidyl choline. Thus although the composition of the enzyme preparation is independent of lipid, there is a strict requirement for lipid for ATPase activity. Cardiolipin is the most effective lipid, on a molar basis, while lyso-phosphatidyl choline was the least effective. Cardiolipin stimulated the oligomycin sensitive ATPase to the highest level (50 units/mg). The oligomycin insensitive ATPase activity was lowest when assayed in the presence of cardiolipin and greatest when assayed in the presence of lyso-phosphatidyl choline. By these accounts, cardiolipin was the most effective phospholipid in activating the oligomycin sensitive ATPase activity of the yeast ATP synthase. Thus, these results suggest that in addition to a lipid requirement for activity, there is a preference for the lipid.
Fig. 2.

Effectiveness of lipids on the oligomycin sensitive ATPase activity with purified yeast ATP synthase. The oligomycin sensitive ATPase activity was measured in buffer containing 0.05% DDM an in the presence of specified lipids at the indicated concentrations. The circles represent the values of the ATPase (μmoles/min/mg protein) in the absence of oligomycin and the squares in the presence of 5 mg oligomycin. The error bars represent 1 standard error
The experiments shown in Fig. 3 were performed in the presence of 0.05% DDM and in the presence or absence of oligomycin. Oligomycin specifically binds to Fo and inhibits ATP hydrolysis if the enzyme is properly coupled. As such, oligomycin sensitive ATPase activity can be used as an indicator of the coupling of the ATP hydrolysis with proton pumping without reconstitution into liposomes. Lipids bound to the ATP synthase are removed during the purification of the enzyme in the presence of 0.05% DDM, and thus, DDM competes with lipid binding sites on the enzyme. The next goal was to obtain a more quantitative titration on the binding of cardiolipin to the enzyme and the relationship to ATPase activity. To perform this study, the amount of DDM was carefully titrated to determine the minimal concentration that could be used and afford an active and coupled enzyme. Titration of the DDM concentration in the assay buffer indicated that just 0.006% DDM was sufficient for full activity in the presence of added lipids (data not shown). Figure 3a shows that the enzyme bound with exogenous CL after purification had nearly the same activity (92%) and oligomycin sensitivity when assayed in the absence of additional cardiolipin and 0.006% DDM in the reaction buffer as compared to the lipid depleted enzyme assayed in the presence of excess CL and 0.05% DDM in the reaction buffer. Thus at low concentration (0.006%) of DDM, the enzyme retains CL. Figure 3b shows a titration of the yeast ATP synthase, isolated in the absence of lipids, with externally added cardiolipin at a low concentration of DDM (0.005%) and assessed by analysis of oligomycin sensitive ATPase activity. Full ATPase activity was observed at around 100 moles of exogenously added CL per mole of ATP synthase. The oligomycin sensitivity showed a slightly different profile with maximal sensitivity observed at about 75 moles of cardiolipin per mole of ATP synthase. This provides an estimate for the amount of cardiolipin bound to the ATP synthase to achieve oligomycin sensitive ATPase activity.
Fig. 3.
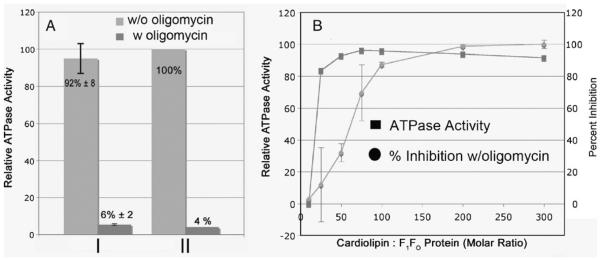
Cardiolipin dependence by the ATP synthase for oligomycin sensitive ATPase activity. a The ATP synthase was purified in the absence of lipids, cardiolipin (BH CL) was bound (200 molar excess) and assayed in buffer containing 0.006% DDM (I) in the absence of additional added lipid and in buffer containing 0.05% DDM and 0.03% lecithin (II). b The ATP synthase was purified in the absence of lipids and assayed in the presence and absence of oligomycin (5 μg) in buffer containing 0.005% DDM with the indicated amount (molar excess) of TM CL
The amount of cardiolipin binding to the ATP synthase was also measured directly. In this experiment, the ATP synthase was bound to a Ni-affinity column and subse-quently washed with buffer containing CL and 0.05% DDM. The bound enzyme was briefly washed with the same buffer without cardiolipin and eluted using buffer containing 0.4 M imidazole. This enzyme had nearly maximal activity based on ATP hydrolysis, which was inhibited 95% by oligomycin. Total organic phosphate was determined as described in Materials and Methods, which indicated that about 60 moles of phosphate or 30 moles of cardiolipin were bound per mole of enzyme.
The stability of the ATP synthase is dependent, in part, on the detergent in the buffer. By exchanging the detergent and determining the ATPase activity of the resulting enzyme we were able to measure the efficacy of a number of detergents. The ATP synthase was purified in 0.05% DDM and the DDM was exchanged by binding the enzyme to a Ni-Sepharose column and slowly flowing buffer (30 ml) containing the test detergent at concentrations as indicated in Materials and Methods. The ATP synthase was eluted in buffer containing 0.4 M imidazole and desalted on a centrifuge column (Penefsky 1979). The activity measurements were performed as described in Materials and Methods in buffer containing 0.05% DDM. Table 1 and Fig. 4. show the ATPase activity in the presence and absence of oligomycin and the proton pumping after reconstitution into liposomes as assessed by 9ACMA fluorescence quenching. The detergents varied in effectiveness over a very broad range with DDM, UTM, and NTG being the best based on all the assays, and DDG, DDAO and OG were the poorest. Analysis of the samples by SDS PAGE (data not shown) indicated a strong correlation between the total ATPase activity and the amount of protein eluted from the column indicating that in the cases where the activity was low, the ATP synthase complex was not stable and dissociated (with DDAO) or precipitated (with OG) during the course of the detergent exchange. Surprisingly, DM was an effective detergent based on ATPase activity but ineffective based on oligomycin sensitive ATPase. The ATPase activity was only inhibited by 35% by oligomycin and the resulting enzyme was unable to support proton pumping based on the 9ACMA fluorescence quenching. These results provide a clear differential on the stability of the ATP synthase in a variety of detergents.
Table 1.
Effectiveness of detergents in retaining enzymatic activity. (The enzyme precipitated with DDG and OG and was inactive)
| Detergent | Percent fluorescence quenching of 9ACMA | ATPase μmoles/min/mg | Percent oligomycin sensitivity |
|---|---|---|---|
| DDM | 48.3±1.5 | 45.3±1.5 | 95.0±2.6 |
| UTM | 45.3±1.5 | 39.3±1.2 | 88.0±2.6 |
| DDAO | 0 | 15.0±2.6 | 0 |
| C12E8 | 41.0±1.0 | 44.3±1.2 | 67.3±5.0 |
| SMD | 14.0±1.0 | 31.3±6.5 | 32.3±2.5 |
| DM | 13.7±2.1 | 32.7±3.1 | 35.3±5.0 |
| NTG | 43.5±2.1 | 39.5±0.7 | 82.5±10.6 |
Fig. 4.

Effectiveness of detergents on the coupling capacity of the ATP synthase. The ATP synthase was purified and the detergents were exchanged as described in Material and Methods. The resulting preparations were reconstituted into liposomes and proton pumping was measured by fluorescence decrease of 9ACMA coupled to ATP hydrolysis. Oligomycin (5 μg) was added as indicated. The bottom panel shows a tabular form of the data with the detergent and percentage fluorescence quenching coupled to ATP hydrolysis
Steric blocks within the central stalk
The rotation of the central stalk within the ATP synthase creates an inherent asymmetry within the enzyme. At any one time, the central stalk can be in any one of three orientations relative to the peripheral stalk, which comprises the stator of the enzyme. Crystallization occurs most readily with homogeneous preparations of the protein. The inherent asymmetry of the position of the central stalk provides for a mixture of three rotomers. A steric block was added to the central stalk in order to enrich the population to a single rotomer conformation. The rationale is that by increasing the size of either the δ- or ε-subunits with rotation, there will be a steric clash between the fusion protein in the central stalk with the peripheral stalk. Steric hindrance is predicted to slow or stop rotation of the central stalk at a single point thereby enriching for a single rotomer conformation of the central stalk.
The fusion constructs were made based on the crystal structure of the yeast F1 ATPase (Kabaleeswaran et al. 2006). The C-terminus of the ε-subunit is positioned in a nearly perfect position extending away from the central stalk and thus it does not appear that a protein fused onto the C-terminus of ε-subunit would alter the interaction of the ε-subunit with the γ- or δ-subunits of F1. A priori, it was not clear how large the fusion needed to be to prevent the rotation of the central stalk, so three different variants were made: ε-cytochrome b562, ε-GFP (Green Fluorescent Protein), and ε-CCP1 (cytochrome c peroxidase 1). These fusions increased the molecular mass of the ε-subunit by 12 KDa, 27 KDa, and 33 KDa, respectively. Figure 5 shows the effect of these fusions when introduced into yeast ATP15 deletion strain (ATP15 is the gene encoding the ε-subunit), on the ability of the cells to grow on glycerol, a nonfermentable carbon source. The ε-fusion constructs, along with the gene encoding the β-subunit, were integrated into the genome of a yeast strain that was deleted of the genes encoding the β- and ε-subunits (ATP2 and ATP15, respectively). The mutation in ATP2 was necessary because it prevents cytoplasmic petite formation in strains with a null mutation in ATP15 (Lai-Zhang et al. 1999). Figure 5 shows that the cells expressing ε-cytochrome b562 were able to grown on a nonfermentable carbon source indicating that the cells were competent for oxidative phosphorylation. However, neither the cells expressing ε-GFP or ε-CCP1 were able to grow on the nonfermentable carbon source indicating that the ATP synthase was unable to provide sufficient ATP for growth.
Fig. 5.
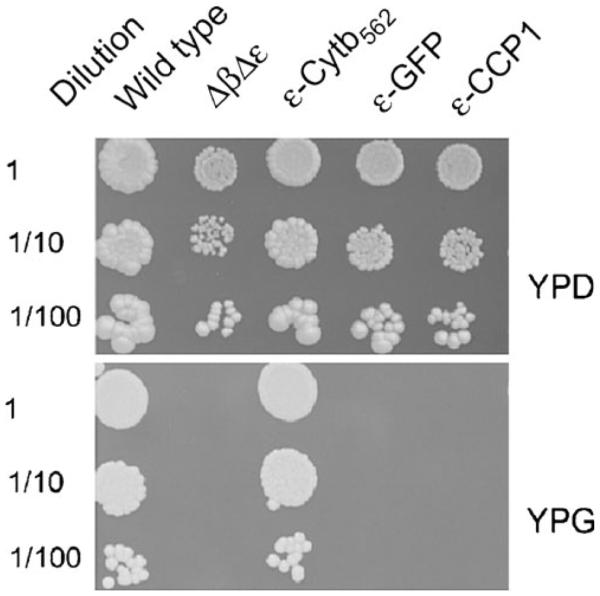
Growth phenotype of yeast with the ε-fusion constructs. The yeast strain containing null mutations in ATP2 and ATP15 (encodes the β- and ε-subunits, respectively) were transformed with vectors that contained the ATP2 gene and the ε-fusion construct. The cells were grown on rich medium containing glucose (YPD) or glycerol (YPG) in 3 dilutions, at 30 °C
The biochemical effect of blocking rotation of the rotor would be impairment of the ATPase activity of F1Fo but not that of F1. Table 2 shows the ATPase activity, in the presence and absence of oligomycin, of mitochondria isolated from the wild type and the three strains with the ε-fusion constructs and the ATPase activity after release of F1 from the membrane with chloroform. The activities of the wild type and that with the ε-cytochrome b562 fusion were nearly identical suggesting little effect due to the fusion of the cytochrome-b562 on the end of the ε-subunit. However, the ATPase activity of F1Fo with ε-GFP fusion dropped to about 25% of the wild type while the activity was nearly normal after F1 was removed from the membrane with chloroform. Fusion of CCP1 to the ε-subunit (ε-CCP1) resulted in a lower membrane bound ATPase, but release with chloroform increased the ATPase activity less than that observed with ε-GFP. Indeed, the percentage stimulation of ATPase activity after the release of F1 from the membrane was only 2.5 fold as compared to 3.3 fold for the ε-GFP fusion. Thus, while ε-CCP1 is a larger fusion protein than ε-GFP, there was not a significant increase in the inhibition of rotation as measured by ATPase activity.
Table 2.
Stimulation of ATPase activity after release of F1 from the membrane
| Enzyme | Membrane bound ATPase μmoles/min/mg (B) | Membrane released ATP ase μmoles/min/mg extracted protein (R) | Percent oligomycin sensitivity of membrane bound enzyme | Percent stimulation R vs. B |
|---|---|---|---|---|
| Wild Type | 1.1±0.2 | 1.16 | 95±3 | 5.4 |
| ε-Cytb562 | 1.30±0.1 | 1.37 | 83±9 | 5.4 |
| ε-GFP | 0.26±0.1 | 1.12 | 45±5 | 330 |
| ε-CCP1 | 0.15±0.05 | 0.52 | 26±6 | 247 |
As predicted, the presence of the ε-GFP fusion protein decreased the level of the ATPase activity, but the cause for the remaining activity was not clear. The first possibility tested was that there was proteolysis between ε and GFP releasing wild type ε-subunit. To test this hypothesis, the ATP synthase was purified from the strain containing the ε-GFP fusion and analyzed by Western blot using an antibody reactive against the ε-subunit (and also reactive against the γ-subunit). Figure 6 shows that there is no wild type ε-subunit as it is present only as the GFP fusion.
Fig. 6.
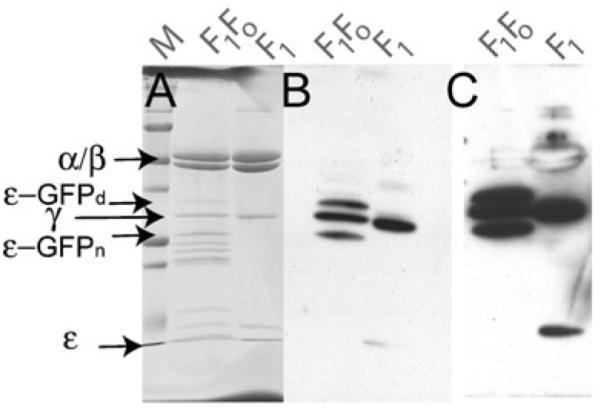
Analysis of ε-GFP fusion integrity. F1Fo ATP synthase from the strain containing the ε-GFP fusion (20 μg) was separated by SDS PAGE and analyzed by Western blot analysis with antibodies directed against the ε- and γ-subunits. For comparison, F1 ATPase from a wild type strain is shown (F1). a Coomassie Blue stain of the peptides. b Western blot analysis c Same as b, but at a longer exposure. The pertinent peptides are indicated: ε-GFPd is the ε-GFP with GFP in a denatured form, ε-GFPn is the fusion protein with GFP in more folded form. (Mass spectrometric analysis of these bands confirmed their identity: ε-GFPn is green while ε-GFPd is colorless)
Another explanation for the basal ATPase activity is that possibly there is free F1 or subcomplexes of F1Fo and the ATPase is not inhibited by the steric block or by oligomycin. The lower percentage of oligomycin sensitive ATPase of the mitochondria isolated from the strain containing the ε-GFP fusion supports this conclusion (45% for ε-GFP vs. 95% for the wild type, Table 2), but additional experiments were performed to test this hypothesis. If this hypothesis were correct, then it is predicted that purification of the ATP synthase followed by reconstitution into liposomes would result in an enzyme preparation that is more highly inhibited by both the steric block and by oligomycin and this proved correct. Table 3 shows that the specific ATPase activity of the F1Fo containing ε-cytochrome b562 fusion had activity comparable to that of the wild type enzyme, while the ATPase activity of F1Fo with ε-GFP fusion was inhibited by more than 90% with a parallel increase in sensitivity to oligomycin. Thus, the purification of the ATP synthase and reconstitution into liposomes decreased the apparent heterogeneity resulting in a more inhibited enzyme, though with still a low basal activity. These results indicate that the ε-GFP fusion affords a strong, but not complete steric block.
Table 3.
Steric block inhibits ATP hydrolysis in reconstituted proteoliposomes
| Proteoliposomes | ATPase μmoles/min/mg | Percent oligomycin sensitivity | Relative activity |
|---|---|---|---|
| Wild type | 42 | 98% | 100 |
| ε-Cytb562 | 39±2.2 | 96% | 93 |
| ε-GFP | 3.4±0.6 | 70% | 8 |
The remaining low basal ATPase activity for the ε-GFP containing enzyme was still significant and the cause was not explained. To address this question, the reconstituted enzymes were tested for ATP driven proton pumping as measured by 9ACMA fluorescence quenching. The results in Fig. 7 show that the enzyme containing ε-GFP showed a reduced, but significant ability to pump protons with the hydrolysis of ATP as compared to the wild type and the ε-Cytb562 enzymes. These results indicate that while ε-GFP fusion impairs the rotation of the central stalk, it does not eliminate proper rotation as the enzyme is still able to pump protons. Thus, the conclusion is that the mitochondria contain a significant amount of subcomplexes of the ATP synthase, that is active for ATPase and insensitive to oligomycin, but there is also a basal rate of ATP hydrolysis by the intact ATP synthase containing ε-GFP, which is coupled and able to pump protons across the membrane. This conclusion implies that GFP is able to pass the stator in the space located between the stator and the central stalk, albeit at a low rate.
Fig. 7.

Proton pumping of F1Fo with ε-GFP fusion. The ATP synthase was purified from the strains expressing wild type, ε-cytochrome b562, and the ε-GFP enzymes and reconstituted into liposomes. Proton pumping was monitored by fluorescence quenching of 9ACMA coupled with ATP hydrolysis. Oligomycin (5 μg) was added as indicated by the arrow
Crystallization of the ATP synthase F1-c10 Subcomplex containing ε-GFP
The ε-GFP enzyme was purified as F1 and F1Fo complex and subjected to crystallization trials. For F1, the crystals were obtained under conditions that were similar to that described earlier, with the enzyme was stripped of nucleotide (Kabaleeswaran et al. 2009). The crystals showed strong fluorescence but diffracted only to about 7Å (data not shown). In comparison, the crystals obtained from the apo form of the wild type enzyme diffracted to about 3.8Å, though this was the best diffraction out of many crystals tested (Kabaleeswaran et al. 2009).
F1Fo was also subjected to crystallization trials and a number of conditions were identified that produced crystals. The fluorescence could be used to differentiate protein crystals from salt crystals. Figure 8a shows a single crystal obtained from F1Fo preparations mounted in a nylon loop. The crystal diffracted to about 4Å (Fig. 8b and c) and indexed as P21 with unit cell dimensions similar to that described for the crystallization of F1c10 (Stock et al. 1999). The data set was integrated, scaled, and the phases were solved by molecular replacement using the structure of yeast F1. The resulting electron density (Fig. 8d) indicated clearly that the crystals were that of F1c10 and not of the entire complex. This was supported by analysis of the subunit composition as determined by SDS PAGE of the crystals (not shown).
Fig. 8.

a The crystal of putative F1Fo with approximate dimensions (0.6×0.2×0.05 mm). b, c Typical diffraction image of the crystal as recorded at APS beamline 23-ID-C. The resolution is indicated by the rings. d Electron density (gold) in c10 region after solvent flipping and phase combination. The Cα model of Stock et al., (in magenta) is overlaid on the electron density map (Stock et al. 1999). A mask of F1Fo generated from electron microscopy data (Rubinstein et al. 2003) was manually aligned with the molecular replacement solution, which indicated that only C10 could be accommodated without serious overlaps in the crystal packing. Thus the crystal likely consists of F1C10 and not an intact F1Fo. The crystallization was done at 21 °C at 4 mg/ml F1Fo, in 12.25% PEG 400, 60 mM NaF, 25 mM HEPES, pH 7.3, 150 mM NaCl, 1 mM EDTA, 2 mM MgCl2, 2.5 mM paminobenzamidine, 2.5 mM ε-aminoacaproic acid, 0.05 mM thymol, and 100 molar excess of cardiolipin (0.67 mM)
Discussion
The impetus of this study was to form a basis for the crystallization of the mitochondrial ATP synthase. However, in the process, this study has provided a number of new and important understandings on the biochemical properties of the yeast ATP synthase. This study provides new and important information on the lipid dependence of the enzyme activity and structural information on the clearance between the rotor and the stator of ATP synthase. The study has also developed a rapid system for the expression and purification of the yeast mitochondrial ATP synthase and a genetically modified ATP synthase that will aid in the crystallization of the ATP synthase in a form that reveals all of the asymmetric features of the enzyme.
The expression of the yeast ATP synthase is under the control of catabolite repression (Mueller and Getz 1986) where transcription of the genes encoding the ATP synthase is repressed when the cells are grown in the presence of glucose, or another fermentable carbon source, at concentrations higher than about 0.2% (Ibrahim et al. 1973; Kim and Beattie 1973). Since ε-GFP fusion inhibits the ATP synthase, the cells must be grown in glucose. To prevent catabolite repression, the glucose concentration is maintained at a concentration at or about 0.2% as described in Materials and Methods. The process is highly effective—2 kg of yeast are obtained from a 60 l culture with 4 kg of glucose consumed in 12 h at 30 °C.
The yeast mitochondrial ATP synthase was purified from isolated mitochondria in a two-step procedure, which included Ni-chelate affinity chromatography. Contrary to a prior report (Bateson et al. 1996), this results in a fully active enzyme preparation. By all accounts, the enzyme is a monomer and devoid of subunits e and g, which are associated with the dimer form of the enzyme (Arnold et al. 1998).
The purification of the ATP synthase in the presence of 0.05% DDM strips the enzyme of bound lipids. DDM appears to compete for the lipid binding sites on the enzyme. Lipids are not needed for the purification of an intact and functional enzyme, but they must be added back to restore activity. Both total ATPase activity and sensitivity to oligomycin is dependent on added lipids to the purified preparation. Presumably, the proton pumping activity is also dependent on added lipids but this activity is measured in liposomes and thus we are unable to decipher this requirement.
The lipid dependence of the ATP synthase shows specificity with cardiolipin being the most effective and lyso-phosphatidyl choline being the poorest. There was not an apparent difference on the degree of stimulation of the ATPase activity caused by addition of cardiolipin isolated from bovine heart as compared to synthetic cardiolipin. Both cardiolipin and phosphatidyl choline are present in the mitochondrial membrane but cardiolipin is essential for mitochondrial function (Joshi et al. 2009; Mileykovskaya and Dowhan 2009) and has been found bound tightly to some mitochondrial enzymes and essential for their activity (Lange et al. 2001; Robinson 1993; Robinson et al. 1990; Sedlak et al. 2006).
The lipid dependence has been studied in the bovine ATP synthase with similar results (Laird et al. 1986; Swanljung et al. 1973). Lyso-lecithin was shown to activate the ATPase activity by 17 fold, while cardiolipin activated it by just 2.6 fold (Swanljung et al. 1973). The study went on to demonstrate that lyso-lecithin competed for binding of cardiolipin to bovine ATP synthase. In another study, it was shown that asolecithin activated bovine ATPase by about 13 fold with lesser activation by phosphatidyl choline, phos phatidyl ethanolamine, and cardiolipin (Laird et al. 1986). The primary weakness of these studies was that the ATPase activity of the purified enzyme was either not highly sensitive to oligomycin or not demonstrated to be sensitive to oligomycin, and thus the enzyme may not represent a coupled or intact enzyme.
The results on the yeast enzyme differed in a number of ways in comparison to reported values for the bovine enzyme (Swanljung et al. 1973). The specific ATPase activity of the yeast enzyme was greater by as much as 5 fold (50 vs 9) in the presence of lipid, the oligomycin sensitive ATPase was 96% as compared to just 60%, and unlike the bovine enzyme, CL was most effective in stimulation of oligomycin sensitive ATPase activity of the yeast enzyme.
For the yeast enzyme, the effect of phospholipids on the oligomycin sensitive ATPase activity of the enzyme was insightful. The percentage of oligomycin sensitive ATPase activity increased from less than 20% to 96%. Further, there was a rough correlation between the percentage stimulation of ATPase activity and the percentage sensitivity to oligomycin. The sensitivity to oligomycin is thought to be related to the coupling of proton translocation with hydrolysis or synthesis of ATP and thus these results suggest a critical role of lipids in the coupling of the enzyme.
With one exception, the general rule observed for the effect of the lipids and detergents was that the effectiveness based on stimulation of the specific ATPase activity paralleled the stimulation of coupling based on percentage ATPase activity sensitive to oligomycin. Coupling could also be assessed by proton pumping after reconstitution into liposomes in the analysis of the effectiveness of various detergents and this analysis was consistent with the effect on oligomycin sensitivity. The one exception to the general rule was the effect of DM, which while it was effective based on specific ATPase activity (33 units/mg), it was not effective based on both oligomycin sensitivity and proton pumping. This was a rather surprising result since DDM was very effective and this differs from DM by just 2 carbons in the alkyl chain.
Lipids are known to be essential components for membrane proteins and have been proposed to act in facilitating structural and functional integrity, as suggested for the cytochrome bc1 complex where cardiolipin is tightly bound in the crystal structure (Lange et al. 2001). Cardiolipin was also found bound to the crystal form of cytochrome oxidase (Tsukihara et al. 2003) and it is required for its function or folding (Robinson 1993; Sedlak et al. 2006). Cardiolipin is tightly bound to the bovine ATP synthase (Eble et al. 1990). In the case of the yeast ATP synthase, while cardiolipin is not essential for coupling and activity, based on a molar ratio, it is the best lipid tested that activates and couples the ATPase.
There appears to be a correlation between the number of side alkyl groups of the lipid and the effectiveness of the lipid. Cardiolipin with 4 acyl chains is most effective, followed by those with 2, such as phosphatidyl choline, and with lyso-phosphatidyl choline being the weakest having only 1 acyl chain. Consistent with these observations is that detergents compete with the acyl binding sites of the lipids, but don't provide the structural support necessary for coupling ATP hydrolysis with proton pumping. Of course, the loss in coupling can have a direct effect on the rotation of the rotor and thus ATPase activity. As is discussed later, an attractive hypothesis is that the lipids are necessary for the stable association between subunits a and c and thus are required for an oligomycin sensitive (coupled) complex.
We also investigated blocking the rotation of the central stalk by creating a steric block—in this case by creating a fusion protein between the ε-subunit and the partner proteins, cytochrome b562, GFP, and cytochrome c peroxidase 1. The crystal structure of yeast F1 served as the initial guide for creating the fusion constructs. The structure of yeast F1 indicated that the C-terminus of ε is exposed to the bulk solvent. The C-terminus of the bacterial homolog of δ has been implicated in regulatory role of the bacterial ATPase and thus may have functional importance in the bacterial (Suzuki et al. 2003; Tsunoda et al. 2001) but apparently not the mitochondrial enzyme. The results indicated that the ε-cytochrome b562 fusion was able to proceed apparently unimpeded past the stator, while with ε-GFP fusion rotation was severely, but not completely impeded. The results give a rough estimate of the space between the rotor and stator equivalent to the size of GFP (pdb, 1EMA), or an average diameter of about 47Å.
The results of this study are similar to those done in a similar manner with F1 from E. coli, however, in the latter case, the fusion was made to the N- and C-terminus of the bacterial homolog of δ (Cipriano et al. 2002; Cipriano and Dunn 2006) however, our interpretation of the results differ significantly. The C-terminal fusions were made with cytochrome b562, flavodoxin, and flavodoxin reductase with corresponding molecular weights of, 12 KDa, 20 KDa, and 28 KDa. Based on growth on succinate medium, only the fusion of ε-subunit with the smallest protein, cytochrome b562, was functional. The biochemical studies also gave additional support for a defect in the larger fusions and little effect with the smaller and the clearance between the stalk and stator was estimated at 37Å. However, the fusion proteins did not greatly inhibit ATP hydrolysis and there was significant, but partial, DCCD sensitive ATP hydrolysis activity. Further, the membranes could not generate a proton gradient with ATP hydrolysis despite the DCCD sensitivity. These results were interpreted to mean that the ATPase could ratchet back and fourth, from one end of the stator to the other, in a DCCD sensitive manner thereby explaining DCCD sensitive ATP hydrolysis without proton pumping. A similar hypothesis was used to explain the mild uncoupling caused by fusion of flavodoxin to the N-terminus of the bacterial homolog of δ (Cipriano and Dunn 2006). The results with the yeast enzyme provide a different explanation. Like the study with the bacterial enzyme, membranes from the ε-GFP fusion had high ATPase activity, some of which is sensitive to oligomycin. However, this changed dramatically when the enzyme was purified and reconstituted into liposomes where specific ATPase dropped to just 8% as compared to the wild type enzyme and which was inhibited 70% by oligomycin. Thus, there was an initial heterogeneous population of F1, or subcomplexes of F1Fo in the mitochondria. Fluorescence quenching of ACMA effected by ATP hydrolysis of proteoliposome with the purified enzyme indicated that there was low, but significant, proton pumping activity of the ATP synthase containing the ε-GFP fusion (Fig. 7). We conclude that the central stalk can rotate, albeit at a greatly reduced rate. In the studies with the bacterial enzyme (Cipriano et al. 2002; Cipriano and Dunn 2006), the results can also be interpreted to indicate the presence of a heterogeneous population of ATP synthases, some of which are altered in either their subunit composition or conformation, which cause partial or complete uncoupling of the enzyme. Evidence in yeast indicates that the ATP synthase can assemble in the absence of the γ-, δ-, or ε-subunits resulting in an uncoupled enzyme and further, that these enzymes can be present in a heterogeneous population with the holo-enzyme (Duvezin-Caubet et al. 2003; Lai-Zhang et al. 1999; Mueller 2000; Xiao et al. 2000). The studies on the bacterial enzyme were all done with membrane preparations rather than purified enzyme and it is possible that subcomplexes were formed without the bacterial fusion protein thereby giving conflicting results. The presence of a heterogeneous population of enzymes is consistent with the results in the bacterial study without invoking the back-and-fourth mechanism proposed which is intrinsically a problematic mechanism.
The heterogeneous population of ATP synthase opens up the possible studies on the assembly pathway of the ATP synthase. Further studies on the composition of the subcomplexes may provide details into which subcomplexes are possible and thus may provide insight into their assembly.
The ε-subunit is composed of just 61 residues yet the subunit is stably associated with F1 even with the 27 KDa GFP molecule fused to the C-terminus. The stable association is demonstrated by our ability to purify both F1 and F1Fo with ε-GFP, in apparent stoichiometric amounts and further, by our ability to obtain crystals of both F1 and F1c10 containing ε-GFP. Thus, this provides a good substrate for crystallization studies as the GFP can serve both as an indicator for protein crystals and as a steric block. The steric block can aid in crystallization as it may confer a favored rotomer conformation as determined by the position of the rotor, especially in the presence of ATP:Mg.
Despite our best efforts using knowledge gained on detergents and lipids, the crystallization of F1Fo with ε-GFP resulted in a subcomplex consisting of F1 and the c10 ring. This complex has been crystallized before from yeast (Dautant et al. 2010; Stock et al. 1999) and bovine (Watt et al. 2010) and it appears to be a common subcomplex. The results from an electron microscopy study on the intact Thermus thermophilus V-ATPase suggest an explanation for the labile nature of the stator (Lau and Rubinstein 2010). This study showed that there was a remarkably small contact between subunit I and the ring of subunits L (I is analogous to subunit a and L is analogous to subunit c of the F1 ATP synthase). This minimal contact may be the Achilles' heel and responsible for the dissociation of the stator during crystallization conditions. However, it is clear that this interaction is stable in the lipid bilayer. This suggests that the lipids provide structural support for the link between subunit a and the c-ring. This insight provides an avenue for stabilization and successful crystallization of the entire F1Fo complex such as with lipidic cubic phase protocol (Cherezov et al. 2004).
Acknowledgements
We thank Dr. Stanley Dunn of the University of Western Ontario, Canada, for the plasmid containing the gene for cytochrome b562 and Dr. Jean Velours of Université Bordeaux, CNRS, Institut de Biochimie et Génétique Cellulaires, France for the antibody directed against the ε-subunit. Data were collected at GM/CA Collaborative Access Team (GM/CA-CAT) 23-ID beam line at the Advanced Photon Source, Argonne National Laboratory. Use of the Advanced Photon Source was supported by the U.S. Dept. of Energy, Office of Science, Office of Basic Energy Sciences, under Contract Number W-31-109-Eng-38.
This work was supported, in whole or in part, by National Institutes of Health Grant NIH R01GM66223 (to D.M.M.). V.P. was supported by a pre-doctoral fellowship award from American Heart Association, 0616667Z.
Abbreviations
- 9ACMA
9-amino-6-chloro-methoxy acridine
- CMC
critical micelle concentration
- DDM
n-dodecyl-β-D-maltoside
- OG
octyl-β-D-glucoside
- DM
n-decyl-β-D-maltoside
- UTM
n-undecyl-β-D-thiomaltoside
- NTG
n-nonyl-β-D-thioglucoside
- SMD
Sucrose monododecaonate
- DDAO
n-dodecyl-N,N-dimethylamine-N-oxide
- C12E8
ANAPOE-C12E8
- DDG
n-dodecyl-β-D-glucoside
- LPC
lyso-phosphatidyl choline
- DOPC
di-oleylphosphatidyl choline
- SL
soy lecithin
- PC
phosphatidyl choline
- TM CL
synthetic tetramyristoyl cardiolipin
- BH CL
phospholipids bovine heart cardiolipin
- CL
cardiolipin
- SMP
submitochondrial particles
- PMSF
phenylmethylsulfonyl fluoride
- EACA
ε-amino-caproic acid
- GFP
green fluorescence protein
- CCP1
cytochrome-c-peroxidase-1
- ORF
open reading frame
- YPAD
1% yeast extract, 2% peptone, 2% glucose, 30 mg/L adenine
- YPD
1% yeast extract, 2% peptone, 2% glucose
- YPG
1% yeast extract, 2% peptone, 3% glycerol
- SD
synthetic media (0.67% yeast nitrogen base, 2% glucose supplemented with amino acids at 20 mg/L
References
- Abrahams JP, Leslie AGW. Acta Crystallogr D. 1996;52:30–42. doi: 10.1107/S0907444995008754. [DOI] [PubMed] [Google Scholar]
- Abrahams JP, Leslie AGW, Lutter R, Walker JE. Nature. 1994;370:621–628. doi: 10.1038/370621a0. [DOI] [PubMed] [Google Scholar]
- Arnold I, Pfeiffer K, Neupert W, Stuart RA, Schägger H. EMBO J. 1998;17:7170–7178. doi: 10.1093/emboj/17.24.7170. [DOI] [PMC free article] [PubMed] [Google Scholar]
- Bateson M, Devenish RJ, Nagley P, Prescott M. Anal Biochem. 1996;238(1):14–18. doi: 10.1006/abio.1996.0242. [DOI] [PubMed] [Google Scholar]
- Bianchet MA, Hullihen J, Pedersen PL, Amzel LM. Proc Natl Acad Sci USA. 1998;95:11065–11070. doi: 10.1073/pnas.95.19.11065. [DOI] [PMC free article] [PubMed] [Google Scholar]
- Cherezov V, Peddi A, Muthusubramaniam L, Zheng YF, Caffrey M. Acta Crystallogr D Biol Crystallogr. 2004;60(Pt 10):1795–1807. doi: 10.1107/S0907444904019109. [DOI] [PubMed] [Google Scholar]
- Cipriano DJ, Bi Y, Dunn SD. J Biol Chem. 2002;277(19):16782–16790. doi: 10.1074/jbc.M201349200. [DOI] [PubMed] [Google Scholar]
- Cipriano DJ, Dunn SD. J Biol Chem. 2006;281(1):501–507. doi: 10.1074/jbc.M509986200. [DOI] [PubMed] [Google Scholar]
- Dautant A, Velours J, Giraud MF. J Biol Chem. 2010;285(38):29502–29510. doi: 10.1074/jbc.M110.124529. [DOI] [PMC free article] [PubMed] [Google Scholar]
- Duvezin-Caubet S, Caron M, Giraud MF, Velours J, di Rago JP. Proc Natl Acad Sci U S A. 2003;100(23):13235–13240. doi: 10.1073/pnas.2135169100. [DOI] [PMC free article] [PubMed] [Google Scholar]
- Eble KS, Coleman WB, Hantgan RR, Cunningham CC. J Biol Chem. 1990;265(32):19434–19440. [PubMed] [Google Scholar]
- Ekman P, Jager O. Anal Biochem. 1993;214(1):138–141. doi: 10.1006/abio.1993.1468. [DOI] [PubMed] [Google Scholar]
- Gietz D, St. Jean A, Woods RA, Schiestl RH. Nucleic Acids Res. 1992;20:1425. doi: 10.1093/nar/20.6.1425. [DOI] [PMC free article] [PubMed] [Google Scholar]
- Ibrahim NG, Stuchell RN, Beattie DS. Eur J Biochem. 1973;36(2):519–527. doi: 10.1111/j.1432-1033.1973.tb02938.x. [DOI] [PubMed] [Google Scholar]
- Joshi AS, Zhou J, Gohil VM, Chen S, Greenberg ML. Biochim Biophys Acta. 2009;1793(1):212–218. doi: 10.1016/j.bbamcr.2008.07.024. [DOI] [PMC free article] [PubMed] [Google Scholar]
- Kabaleeswaran V, Puri N, Walker JE, Leslie AG, Mueller DM. EMBO J. 2006;25:5433–5442. doi: 10.1038/sj.emboj.7601410. [DOI] [PMC free article] [PubMed] [Google Scholar]
- Kabaleeswaran V, Shen H, Symersky J, Walker JE, Leslie AG, Mueller DM. J Biol Chem. 2009;284:10546–10551. doi: 10.1074/jbc.M900544200. [DOI] [PMC free article] [PubMed] [Google Scholar]
- Kane Dickson V, Silvester JA, Fearnley IM, Leslie AG, Walker JE. EMBO J. 2006;25(12):2911–2918. doi: 10.1038/sj.emboj.7601177. [DOI] [PMC free article] [PubMed] [Google Scholar]
- Kim IC, Beattie DS. Eur J Biochem. 1973;36(2):509–518. doi: 10.1111/j.1432-1033.1973.tb02937.x. [DOI] [PubMed] [Google Scholar]
- Knowles AF, Penefsky HS. Biochim Biophys Acta Bio-Membr. 1997;1329:311–320. doi: 10.1016/s0005-2736(97)00123-5. [DOI] [PubMed] [Google Scholar]
- Laemmli UK. Nature. 1970;227:680–685. doi: 10.1038/227680a0. [DOI] [PubMed] [Google Scholar]
- Lai-Zhang J, Mueller DM. Eur J Biochem. 2000;267(8):2409–2418. doi: 10.1046/j.1432-1327.2000.01253.x. [DOI] [PubMed] [Google Scholar]
- Lai-Zhang J, Xiao Y, Mueller DM. EMBO J. 1999;18(1):58–64. doi: 10.1093/emboj/18.1.58. [DOI] [PMC free article] [PubMed] [Google Scholar]
- Laird DM, Parce JW, Montgomery RI, Cunningham CC. J Biol Chem. 1986;261(31):14851–14856. [PubMed] [Google Scholar]
- Lange C, Nett JH, Trumpower BL, Hunte C. EMBO J. 2001;20(23):6591–6600. doi: 10.1093/emboj/20.23.6591. [DOI] [PMC free article] [PubMed] [Google Scholar]
- Lau WC, Rubinstein JL. Proc Natl Acad Sci U S A. 2010;107(4):1367–1372. doi: 10.1073/pnas.0911085107. [DOI] [PMC free article] [PubMed] [Google Scholar]
- Mileykovskaya E, Dowhan W. Biochim Biophys Acta. 2009;1788(10):2084–2091. doi: 10.1016/j.bbamem.2009.04.003. [DOI] [PMC free article] [PubMed] [Google Scholar]
- Mueller DM. J Biol Chem. 1988;263:5634–5639. [PubMed] [Google Scholar]
- Mueller DM. J Bioener Biomem. 2000;32(4):391–400. doi: 10.1023/a:1005532104617. [DOI] [PubMed] [Google Scholar]
- Mueller DM, Getz GS. J Biol Chem. 1986;261(25):11816–11822. [PubMed] [Google Scholar]
- Mueller DM, Puri N, Kabaleeswaran V, Terry C, Leslie AGW, Walker JE. Protein Expr Purif. 2004;37(2):479–485. doi: 10.1016/j.pep.2004.06.035. [DOI] [PubMed] [Google Scholar]
- Noji H, Yasuda R, Yoshida M, Kinosita K., Jr Nature. 1997;386:299–302. doi: 10.1038/386299a0. [DOI] [PubMed] [Google Scholar]
- Ogur M, St. John R, Nagai S. Science. 1957;125(3254):928–929. doi: 10.1126/science.125.3254.928. [DOI] [PubMed] [Google Scholar]
- Otwinowski Z, Minor W. Methods Enzymol. 1997;276:307–326. doi: 10.1016/S0076-6879(97)76066-X. [DOI] [PubMed] [Google Scholar]
- Penefsky HS. Methods Enzymol. 1979;56:527–530. doi: 10.1016/0076-6879(79)56050-9. [DOI] [PubMed] [Google Scholar]
- Prescott M, Higuti T, Nagley P, Devenish RJ. BiochemBiophysResCommun. 1995;207:943–949. doi: 10.1006/bbrc.1995.1276. [DOI] [PubMed] [Google Scholar]
- Robinson NC. J Bioenerg Biomembr. 1993;25(2):153–163. doi: 10.1007/BF00762857. [DOI] [PubMed] [Google Scholar]
- Robinson NC, Zborowski J, Talbert LH. Biochemistry. 1990;29(38):8962–8969. doi: 10.1021/bi00490a012. [DOI] [PubMed] [Google Scholar]
- Rondelez Y, Tresset G, Nakashima T, Kato-Yamada Y, Fujita H, Takeuchi S, Noji H. Nature. 2005;433(7027):773–777. doi: 10.1038/nature03277. [DOI] [PubMed] [Google Scholar]
- Rubinstein JL, Walker JE, Henderson R. EMBO J. 2003;22(23):6182–6192. doi: 10.1093/emboj/cdg608. [DOI] [PMC free article] [PubMed] [Google Scholar]
- Schägger H, von Jagow G. Anal Biochem. 1987;166:368–379. doi: 10.1016/0003-2697(87)90587-2. [DOI] [PubMed] [Google Scholar]
- Sedlak E, Panda M, Dale MP, Weintraub ST, Robinson NC. Biochemistry. 2006;45(3):746–754. doi: 10.1021/bi050870z. [DOI] [PMC free article] [PubMed] [Google Scholar]
- Sikorski RS, Hieter P. Genetics. 1989;122:19–27. doi: 10.1093/genetics/122.1.19. [DOI] [PMC free article] [PubMed] [Google Scholar]
- Stock D, Leslie AGW, Walker JE. Science. 1999;286(5445):1700–1705. doi: 10.1126/science.286.5445.1700. [DOI] [PubMed] [Google Scholar]
- Suzuki T, Murakami T, Iino R, Suzuki J, Ono S, Shirakihara Y, Yoshida M. J Biol Chem. 2003;278(47):46840–46846. doi: 10.1074/jbc.M307165200. [DOI] [PubMed] [Google Scholar]
- Swanljung P, Frigeri L, Ohlson K, Ernster L. Biochim Biophys Acta. 1973;305(3):519–533. doi: 10.1016/0005-2728(73)90073-x. [DOI] [PubMed] [Google Scholar]
- Towbin H, Staehelin T, Gordin J. Proc Natl Acad Sci U S A. 1979;76:4350–4354. doi: 10.1073/pnas.76.9.4350. [DOI] [PMC free article] [PubMed] [Google Scholar]
- Tsukihara T, Shimokata K, Katayama Y, Shimada H, Muramoto K, Aoyama H, Mochizuki M, Shinzawa-Itoh K, Yamashita E, Yao M, Ishimura Y, Yoshikawa S. Proc Natl Acad Sci U S A. 2003;100(26):15304–15309. doi: 10.1073/pnas.2635097100. [DOI] [PMC free article] [PubMed] [Google Scholar]
- Tsunoda SP, Rodgers AJ, Aggeler R, Wilce MC, Yoshida M, Capaldi RA. Proc Natl Acad Sci U S A. 2001;98(12):6560–6564. doi: 10.1073/pnas.111128098. [DOI] [PMC free article] [PubMed] [Google Scholar]
- Vagin A, Teplyakov A. Acta Crystallogr D Biol Crystallogr. 2010;66(Pt 1):22–25. doi: 10.1107/S0907444909042589. [DOI] [PubMed] [Google Scholar]
- Van Veldhoven PP, Mannaerts GP. Anal Biochem. 1987;161(1):45–48. doi: 10.1016/0003-2697(87)90649-x. [DOI] [PubMed] [Google Scholar]
- Velours J, Vailler J, Paumard P, Soubannier V, Lai-Zhang J, Mueller DM. J Biol Chem. 2001;276:8602–8607. doi: 10.1074/jbc.M008123200. [DOI] [PubMed] [Google Scholar]
- Watt IN, Montgomery MG, Runswick MJ, Leslie AG, Walker JE. Proc Natl Acad Sci U S A. 2010;107(39):16823–16827. doi: 10.1073/pnas.1011099107. [DOI] [PMC free article] [PubMed] [Google Scholar]
- Xiao Y, Metzl M, Mueller DM. J Biol Chem. 2000;275(10):6963–6968. doi: 10.1074/jbc.275.10.6963. [DOI] [PubMed] [Google Scholar]
- Yaffe MP. Methods Enzymol. 1991;194:627–643. doi: 10.1016/0076-6879(91)94046-f. [DOI] [PubMed] [Google Scholar]
- Yasuda R, Noji H, Kinosita K, Jr, Yoshida M. Cell. 1998;93:1117–1124. doi: 10.1016/s0092-8674(00)81456-7. [DOI] [PubMed] [Google Scholar]