

Abstract
Objective
The aim of the current study is to test the ability to label and detect murine embryonic stem cell-derived cardiovascular progenitor cells (ES-CPCs) with Magnetic Resonance Imaging (MRI) using the novel contrast agent Gadofluorine M-Cy3 (GdFM-Cy3).
Background
Cell therapy shows great promise for the treatment of cardiovascular disease. An important limitation to previous clinical studies is the inability to accurately identify transplanted cells. GdFM-Cy3 is a lipophilic paramagnetic contrast agent that contains a perfluorinated side chain and an amphiphilic character that allows for micelle formation in an aqueous solution. Previous studies reported that it is easily taken up and stored within the cytosol of mesenchymal stem cells, thereby allowing for paramagnetic cell labeling. Investigators in our laboratory have recently developed techniques for the robust generation of ES-CPCs. We reasoned that GdFM-Cy3 would be a promising agent for the in vivo detection of these cells after cardiac cell transplantation.
Methods
ES-CPCs were labeled with GdFM-Cy3 by incubation. In vitro studies were performed to assess the impact of GdFM-Cy3 on cell function and survival. 500,000 GdFM-Cy3-labeled ES-CPCs or control ES-CPCs were injected into the myocardium of mice with and without myocardial infarction. Mice were imaged (9.4T) before and over a two-week time interval after stem cell transplantation. Mice were then euthanized and their hearts were sectioned for fluorescence microscopy.
Results
In vitro studies demonstrated that GdFM-Cy3 was easily transfectable, non-toxic, stayed within cells after labeling and could be visualized using MRI and fluorescence microscopy. In vivo studies confirmed the efficacy of the agent for the detection of cells transplanted into the hearts of mice after myocardial infarction. A correspondence between MRI and histology was observed.
Conclusions
The results of the current study suggest that it is possible to identify and potentially track GdFM-Cy3-labeled ES-CPCs in murine infarct models via MRI.
Keywords: Cells, Magnetic Resonance Imaging, Myocardial Infarction
Introduction
Replacement of injured tissue using transplanted exogenous cells has shown therapeutic promise in a wide array of conditions, including spinal cord injury (1), diabetes mellitus (2, 3), stroke (4), and cardiovascular disease (5, 6). An important limitation to previous clinical studies is the inability to accurately identify transplanted cells. Recent work by our laboratory has resulted in the identification of embryonic stem cell-derived cardiovascular progenitor cells (ES-CPCs) (7), which we speculate would be promising agents for cell therapy. Given that the mechanism and efficacy of cardiac cell therapy remains uncertain, developing techniques for tracking transplanted cells within the myocardium would be particularly useful.
Thus far, Magnetic Resonance Imaging (MRI) has been a principal diagnostic modality for cell identification post-transplantation (8, 9). Cell identification has been facilitated largely through the use of MR contrast agents that are sensitive, non-toxic, and remain within cells after transplant (10). The two classes of MR contrast agents most widely used are iron oxides and gadolinium chelates. Superparamagnetic iron oxide nanoparticles (SPION) have been used across a broad spectrum of cell labeling applications (11–15). Although iron-labeled cells are highly effective in generating MR signal loss, it is often difficult to differentiate the signal loss generated by iron-laden cells from endogenous sources of signal attenuation (13–16). Gadolinium chelates differ from SPION in their ability to generate increased MR signal intensity when T1-weighted sequences are employed. Most agents are hydrophilic and have difficulty traversing cell membranes. The most widely used is gadopentate dimeglumine (Gd-DTPA), which can be used for non-invasive angiography and to identify areas of perfusion deficit in the myocardium post-infarct (17–19).
Unlike Gd-DTPA, Gadofluorine M (GdFM) contains a perfluorinated side chain and an amphiphilic character, resulting in micelle formation in an aqueous solution. Its' longitudinal relaxivity (r1) is approximately six times greater than that of Gd-DTPA chelates and more than twice that of other reported micelle and liposomal formulations (20). In preliminary studies, Mesenchymal Stem Cells (MSCs) labeled by GdFM were identified after injection into the brain of rats using MRI (21). GdFM has also been used in pre-clinical imaging studies of lymphatic tumor metastasis (22), characterization of atherosclerotic plaques (23, 24), characterization of mammary tumors (25), assessment of nerve degeneration (26), and labeling human monocytes in vitro (27).
In the present study, we demonstrate the ability to identify transplanted cells in the murine heart using GdFM with a perfluorinated Cy3 side chain (GdFM-Cy3). In vitro studies demonstrated that GdFM-Cy3 was easily transfectable, non-toxic, stayed within cells after labeling and could be visualized using MRI and fluorescence microscopy. In vivo studies confirmed the efficacy of the agent for the detection of cells transplanted into the hearts of mice with or without myocardial infarction. These findings indicate that GdFM-Cy3 is a promising agent for MRI-based cell tracking studies.
Methods
For details please see supplementary materials
Generation and in Vitro Analysis of Embryonic Stem Cell Cardiovascular Progenitor Cells Labeled with GdFM-Cy3
Murine ES cells from a CCE ES line (28) constitutively expressing Green Fluorescence Protein (CCE-GFP) were maintained in serum-free media supplemented with 1% LIF, Glutamine and BMP4 were expanded on gelatinized culture plates until confluent and then differentiated in the presence of serum. Flk+ cells were isolated using fluorescence activated cell sorting (FACS) four days after differentiation and cultured in SP-34 serum-free media supplemented with the cytokines DKK, VEGF and FGF. 5 mM of GdFM-Cy3 (Schering, Berlin, Germany), prepared as previously published (19), was added to the culture on the sixth day of differentiation. Twelve hours after adding GdFM-Cy3, cells were washed and placed back in serum-free media in the absence of GdFM-Cy3.
ES-CPCs were kept in culture over a 14-day period and periodically harvested. Inductively Coupled Plasma Mass Spectrometry (ICP-MS) was performed and the concentration of GdFM-Cy3 per cell was calculated. To determine whether GdFM-Cy3 caused cell death, a colorimetric assay was performed as originally described by Mosmann (29). To further assess for apoptosis after extended exposure to GdFM-Cy3, cells were analyzed using a commercially available kit for the apoptosis-specific phospholipid binding protein Annexin V (BD Pharmingen, Franklin Lakes, New Jersey).
To evaluate whether GdFM-Cy3 can travel from labeled cells into neighboring unlabeled cells, a population of cells labeled with GdFM-Cy3 were combined with an equal number of ES-CPCs from a line that constitutively expressed GFP. Flow cytometry was performed 48 hours later to assess for the presence of GFP-positive Cy3-positive cells, indicating the spread of GdFM-Cy3 into unlabeled cells.
Cell Transplantation
Cell injection was performed in Severe Combined Immune Deficiency (SCID) beige mice, deficient in B, T and NK cells. The hearts of four-month-old female SCID beige mice (Jackson Laboratories) were injected with either ES-CPCs labeled with GdFM-Cy3 (n=4) or unlabeled ES-CPCs (n=4). Cells were injected directly into the myocardium in a volume of 7.5 micro liters. 500,000 cells were used per injection, and one injection was performed per mouse. No mortality was observed as a result of cell transplant. These experiments were then repeated in mice with myocardial infarction using a coronary ligation model. After coronary ligation, intramyocardial injection was performed using labeled ES-CPCs (n=5) or unlabeled cells (n=6). Three mice died within one week of the postoperative period. Two died immediately after surgery (one from cell treatment group and one from unlabeled cell group) and one was found dead 24 hours after surgery (from unlabeled cell group). This mortality rate is consistent with the mortality rate of this surgery in our laboratory’s experience. This resulted in a total of four infarcted mice from each group surviving.
In Vitro MRI
To test the ability of MRI to detect GdFM-Cy3 labeled ES-CPCs, agarose gels containing labeled or unlabeled cells were imaged on a 9.4 T dedicated mouse MRI scanner (Bruker Instruments, Billerica, MA) equipped with a 89 mm bore system operating at a proton frequency of 400 MHz. All samples were prepared by adding 0.2 ml of warm agarose gel to 1ml tubes containing 500,000, 300,000, 100,000 and 50,000 labeled ES-CPCs.
In vivo Imaging of Infarcted Mice
The in vivo detection of GdFM-Cy3-labeled ES-CPCs was performed using a 9.4 Tesla dedicated mouse MRI scanner (Bruker Instruments, Billerica, MA) equipped with a 89 mm bore system operating at a proton frequency of 400 MHz. To identify and track the labeled cells over time, mice were imaged prior to transplantation, as well as one, seven and 14 days post transplant. The longitudinal and short axis cine views of the heart were localized using scout scans in different planes. Multiple images (n=10) throughout the cardiac cycle resulted in the formation of a movie that allowed for the identification of GdFM-Cy3-labeled cells moving within the myocardial wall. The ability to follow the signal within the moving myocardium allowed for the identification of the labeled cells relative to coronary vessels that may also generate a positive signal on the T1-weighted sequence used.
MR images were analyzed by calculating the contrast-to-noise ratios (CNR) of hyper-intense regions (containing the GdFM-Cy3 ES-CPCs) and areas of normal myocardium (relative to the standard deviation of the noise). CNR analysis was performed using four mice from each group. Analysis was performed in control mice (unlabeled ES-CPCs) two weeks after injection, and in labeled mice (GdFM-Cy3 labeled cells) one, seven and 14-days post injection. Analysis was performed on both infarcted and non-infarcted animals and the CNR between GdFM-Cy3-positive areas versus areas of the surrounding myocardium were determined. The CNR for each group is presented as mean ± standard deviation. The ROI size was kept constant at 0.06 mm2 for each group. The statistical significance of comparisons between all groups was determined using ANOVA analysis with a Tukey-Kramer Multiple comparison’s post-test.
Histology
Fluorescent immunohistochemistry was used for the detection and characterization of the transplanted GdFM-Cy3-labeled cells. Myocytes were identified using anti-mouse cTnT (Chemicon, Temicula, CA) and anti-alpha-actinin (Sigma-Aldrich) was used to identify myocytes in conjunction with the goat anti-mouse IgG alexa fluor 488 antibody (Invitrogen). DAPI (Vectasheild) was used to stain all cell nuclei (blue).
Results
Isolation of ES-CPC and Incubation with GdFM-Cy3
Five days after plating the Flk+ population, synchronous waves of contracting cells could be identified across the entire plate and remained beating throughout the study period. FACS analysis demonstrated that over 60% of cells expressed cardiac-specific Troponin T (see supplemental Figure 1). Twelve hours after labeling of GdFM-Cy3, red fluorescent cells were seen using a fluorescence microscope (see Figure 1c and supplemental movie 1). ICP-MS revealed that 91% of the GdFM-Cy3 added to the ES-CPCs was taken up by the cells.
Figure 1. In Vitro Analysis of Cells Labeled with GdFM-Cy3.

A. Agarose gels containing 500,000 unlabeled, or 50,000. 100,000, 300,000 or 500,000 GdFM-Cy3-labeled cells were imaged with 9.4 Tesla MRI. B. A linear relationship between SNR and cell number was observed. C. Cells labeled with GdFM-Cy3 imaged using fluorescence microscopy. D–E. GdFM-Cy3-labeled cells co-plated with ES cells constitutively expressing GFP. Fluorescence Microscopy demonstrated that Cy3 cells were not GFP positive (D). Flow cytometry performed 48 hours after co-plating the cells demonstrated two major populations, a GdFM-Cy3 positive population and a GFP positive population (E).
MRI was performed on cell agarose gel phantoms containing 500,000, 300,000, 100,000 and 50,000 cells. The SNR values reflect the MR signal obtained for the number of cells homogeneously distributed into a 0.2 ml volume. Given that the inner diameter of the tubes used to construct the phantoms was 5mm and since each slice was 0.5 mm thick then the total number of cells in any given 0.5mm slice is: 1250, 750, 250, and 125 for 500,000, 300,000, 100,000 and 50,000 cells, respectively (assumes homogeneous distribution of cells). The results indicate a linear increase in SNR with increasing cell number, as shown in Figure 1a. A total of 125 cells within a slice could be easily identified by this method.
Cells labeled with GdFM-Cy3 were then co-cultured with ES-CPCs from a line constitutively expressing GFP. After 48 hours of co-incubation, the majority of cells were labeled with either Cy3 or GFP, with only 4% of cells expressing both markers (Figures 1d and 1e).
GdFM-Cy3 toxicity was assessed using MTT and Annexin assays. After 12 hours of exposure, the MTT assay demonstrated that the viable cell number between treated (4549±388) and untreated (4771±447) populations was similar (p>0.05), in comparison to H2O2 treated cells (50±68) (p<0.001) (figure 2a). 14 days after labeling apoptosis assays were done using Annexin V. No difference in Annexin V was detected between labeled and unlabeled groups (Figure 2b). In addition, GdFM-Cy3-labeled cells continued to spontaneously contract and were easily identified by fluorescent microscopy (supplemental video 1). Thus we conclude that GdFM-Cy3 does not affect cell survival or function in vitro.
Figure 2. GdFM-Cy3 Toxicity Assays.

A. MTT assay. After 24 hours, there was no difference in the number of live cells in both GdFM-Cy3-labeled and unlabeled populations of CPCs. B. Annexin V expression measured using flow cytometry. There was no difference in the expression of Annexin V in labeled and unlabeled populations, whereas 16% of cells exposed to H2O2 for two hours expressed Annexin V.
In Vivo Studies
Positive MR signal enhancement was clearly observed on both long and short axis images of the injected hearts. GdFM-Cy3 ES-CPCs were identified in mice with and without myocardial infarction, as shown in representative images in Figures 3 and 4. Positive MR signal was noted in 3–4 contiguous short axis images in each animal injected. Signal was detected up to one week after transplantation in non-infarcted mice and up to 14 days in infarcted mice, but not in regions containing unlabeled ES-CPCs. (Figures 4B and 4D). Figure 5 shows images in a mouse with an infarction obtained 24 hours and 14 days after transplantation of GdFM-Cy3-lableled ES-CPCs. Signal is clearly seen at both time points, though much more diffuse at the later time point.
Figure 3. Evaluation of Non-Infarcted Mice.

T1-weighted high resolution MRI scan of non-infarcted mouse one day after injection A. Longitudinal image indicating position of axial slice (red line) in top frame. B. Corresponding histology shows GdFM-Cy3 (red) within the myocardial wall, cardiac Troponin T stain (green) and DAPI (blue), 5x. C. Frames 1–10 depict different frames within cardiac cycle. Red “*” indicates the right ventricle and “**” indicates the left ventricle. Arrows show volume containing GdFM-Cy3 cells.
Figure 4. Evaluation of Infarcted Mice.

A–D. 9.4 Tesla MRI was performed one day post-transplantation on mice injected with ES-CPCs labeled with GdFM-Cy3 (panel A long axis and panel C short axis; red line corresponds to location of short axis image) or unlabeled ES-CPCs (panel B long axis and panel D short axis). An area of increased signal intensity was seen in short axis (yellow box panel C). E. Fluorescent microscopy on frozen cardiac sections. Areas of Cy3-positive cells could be seen corresponding to blue and yellow boxes seen in panels A and C, respectively.
Figure 5. Serial Imaging of GdFM-Cy3 Labeled Cells Over Time.

A. 9.4 tesla MRI performed 24 hours after the injection of GdFM-Cy3 labeled ES-CPCs into a mouse with surgically induced myocardial infarction. B. 9.4 tesla MRI performed in the same mouse 14 days after the injection of GdFM-Cy3 ES-CPCs. Significant Enhancement of the MR signal in the anterior wall of the left ventricle could be visualized.
To quantify signal enhancement, CNR values were calculated. In mice with myocardial infarctions, CNR values of 0.21±0.01, 1.62±0.51, and 2.81±0.55 were observed in mice injected with unlabeled cells, GdFM-Cy3 labeled cells one day post-transplant, and GdFM-Cy3 labeled cells 14 days post-transplant, respectively. Additionally, the CNR values in non-infarcted mice were 0.27±0.09, 1.67±0.33, 1.06±0.17 in mice injected with unlabeled cells, mice with GdFM-Cy3-labeled cells after 1 day, and mice with GDFM-Cy3 labeled cells after 14 days, respectively. The CNR values obtained for all GdFM-Cy3 transplant groups were significantly greater than the values obtained for the unlabeled control groups (p<0.001) at one day and 14 days post cell transplant. For the infarcted group, the CNR values increased from day one to day 14 by 73% (p<0.001). In non-infarcted mice, no significant increases in CNR values were observed from day 1 to day 14. Instead, a significant decrease in CNR values (36%, p<0.001) was observed. The CNR values obtained 14 days-post transplant for the infarcted mice were 165% greater than that observed for the non-infarcted group (p<0.001).
Microscopy revealed the presence of GdFM-Cy3-positive cells in sections matching MR signal enhancement, as shown in Figures 3 and 4. Cy3-positive cells stained positive for alpha actinin and GFP, thereby indicating that GdFM-Cy3 was present in the donor ES-CPC cell population (Figure 7). Cells were found in areas both proximal and within infarcted tissue.
Figure 7. Frozen sections of heart imaged using fluorescence microscopy.
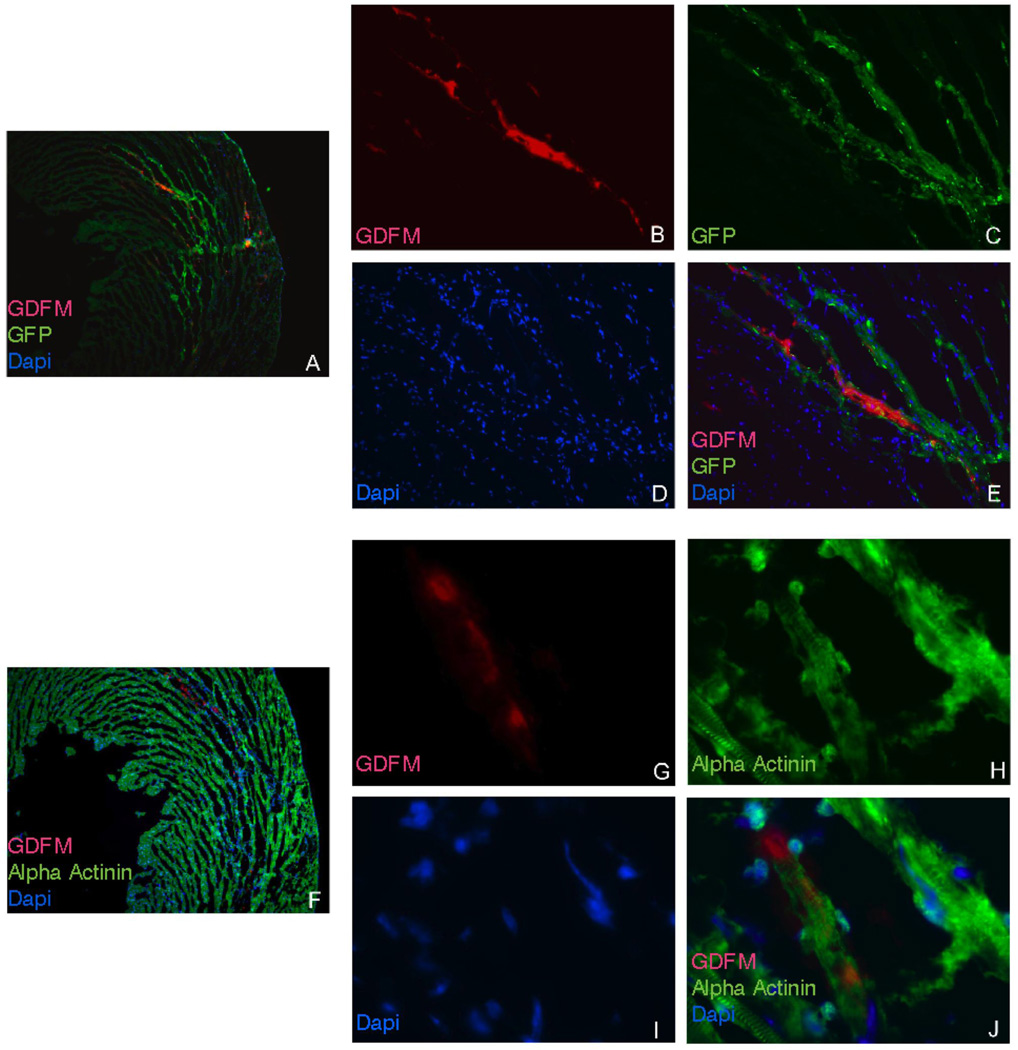
A. 5x view of section with red (GdFM-Cy3), green (GFP) and blue (DAPI) channels. B. Red channel 20x view demonstrating GdFM-Cy3 positive cells. C. Green channel 20x view demonstrating GFP positive cells. D. Blue Channel 20x view demonstrates DAPI-positive cells. E. Overlap of all three channels confirming that GdFM-Cy-3 was within GFP positive cells. F. 5x view of section stained with alpha actinin and alexa 488 secondary antibody (green). F. Red channel 20x view demonstrating GdFM-Cy3 positive cells. G. Green Channel 20x view demonstrating alpha actinin positive cells D. Blue Channel 20x view demonstrates DAPI-positive cells. E. Overlap of all three channels confirming that GdFM-Cy-3 was within alpha-actinin-positive cells.
Discussion
The current study demonstrates the potential of GdFM-Cy3 for the detection of transplanted ES-CPCs in the mouse myocardium. Phantom imaging using cells in agarose gels demonstrated that it is possible to detect as little as 125 cells per 0.005 mm3 (Figures 1a and 1b). The cellular uptake of GdFM-Cy3 was effective (Figures 1c–e), and unlike ferromagnetic agents, did not require the use of transfection agents or other methods to promote labeling. Minimal migration of the MR label was observed between the GdFM-Cy3 labeled cells (in vitro) and GFP expressing control cells. These results indicate limited cellular excretion and subsequent uptake by neighboring cells within the time period tested. This is critical for cell labels intended for tracking, since cellular excretion/metabolism may dilute the MR signal observed. Previous work has shown that the gadolinium label remains primarily within the cytomplasmic compartment (without uptake into lysosomes and/or endosomes), thereby limiting metabolism and enabling effective MR signal enhancement (as observed both in vitro and in vivo) (22). In vitro work also suggests that ES-CPCs may be safely labeled with GdFM-Cy3 without affecting viability as shown in Figure 2, or contractile function as shown in supplemental Movie 1.
GdFM-Cy3 ES-CPCs were clearly visualized in the myocardium of mice after injection (Figure 3). A correspondence between the in vivo MR images and ex vivo fluorescence images (for Cy3) was observed in all mice. Given that most cell therapy will be performed in injured hearts, we included a cohort of mice with surgically induced myocardial infarction (Figures 4 and 5). 14 days after injection no cells were noted by MRI or histology in the non-infarct group. However, in the infarcted mice, MR signal enhancement was observed over the entire two-week time interval. Fluorescent immunolabeling confirmed that post-transplant, the GdFM-Cy3 remained within transplanted cells (Figure 7). These findings suggest that the milieu post-infarction may actually be more supportive of cells in the long term than the non-infarcted heart.
Quantitative evaluation of the MR data revealed that the CNR values increase from 24 hours to 14 days post-transplant. The reduced CNR at early time points is most likely related to T2* effects that may modulate and reduce the MR signal observed. As the cells diffuse or migrate as a function of time, the concentration of the MR label within a given volume is reduced, thereby reducing T2* effects and increasing the MR signal observed.
In conclusion, GdFM-Cy3 is a novel MRI contrast agent that is easily taken up by ES-CPCs in vitro, is retained by these cells, and does not affect cell function or survival. Transplanted cells labeled with GdFM-Cy3 can be identified in vivo and tracked using T1-weighted gradient echo MRI sequences. Although the current work is focused on the myocardium, we believe GdFM-Cy3 may allow for labeling of other cell types, as well as for transplantation into other organs and organ systems. Future studies will evaluate the ability of the technology to work in larger animals at clinically relevant field strengths and with longer follow up periods.
Supplementary Material
Figure 6. Contrast to Noise Ratios.

Contrast to Noise Ratios (CNR) calculated from infarcted and non-infarcted mice injected with control (unlabeled cells) scanned at day 14 after injection or injected with GdFM-Cy3-labeled cells and scanned at day 1 and day 14. All comparisons are statistically significant and have a p<0.001 except for infarct day 1 vs. non-infarct day 14 (p<0.01) and infarct and non-infarcted day 1 and control (p>0.05).
Acknowledgments
Funding: Partial support was provided by: NIH/NHLBI RO1 HL71021, NIH/ NHLBI HL78667 (ZAF)
Abbreviations
- CPC
Cardiovascular Progenitor Cells
- CHESS
Chemical Shift Selective Suppression
- CNR
Contrast to Noise Ratio
- ESC
Embryonic Stem Cell
- GdFM-Cy3 (GdFM)
Gadofluorine-Cy3
- Gd-DTPA
Gadopentate Dimeglumine
- ICP-MS
Inductively Coupled Plasma Mass Spectrometry
- SNR
Signal to Noise Ratio
- TE
Time of Excitation
- TR
Time of Relaxation
Footnotes
Publisher's Disclaimer: This is a PDF file of an unedited manuscript that has been accepted for publication. As a service to our customers we are providing this early version of the manuscript. The manuscript will undergo copyediting, typesetting, and review of the resulting proof before it is published in its final citable form. Please note that during the production process errors may be discovered which could affect the content, and all legal disclaimers that apply to the journal pertain.
Conflicts of interest: Dr. Weinmann works for Schering AG. No other conflicts of interest exist.
References
- 1.Liu S, Qu Y, Stewart TJ, Howard MJ, Chakrabortty S, Holekamp TF, McDonald JW. Embryonic stem cells differentiate into oligodendrocytes and myelinate in culture and after spinal cord transplantation. Proc Natl Acad Sci U S A. 2000;97(11):6126–6131. doi: 10.1073/pnas.97.11.6126. [DOI] [PMC free article] [PubMed] [Google Scholar]
- 2.Chen LB, Jiang XB, Yang L. Differentiation of rat marrow mesenchymal stem cells into pancreatic islet beta-cells. World J Gastroenterol. 2004;10(20):3016–3020. doi: 10.3748/wjg.v10.i20.3016. [DOI] [PMC free article] [PubMed] [Google Scholar]
- 3.Lumelsky N, Blondel O, Laeng P, Velasco I, Ravin R, McKay R. Differentiation of embryonic stem cells to insulin-secreting structures similar to pancreatic islets. Science. 2001;292(5520):1389–1394. doi: 10.1126/science.1058866. [DOI] [PubMed] [Google Scholar]
- 4.Shen LH, Li Y, Chen J, Zhang J, Vanguri P, Borneman J, Chopp M. Intracarotid transplantation of bone marrow stromal cells increases axon-myelin remodeling after stroke. Neuroscience. 2006;137(2):393–399. doi: 10.1016/j.neuroscience.2005.08.092. [DOI] [PubMed] [Google Scholar]
- 5.Kolossov E, Bostani T, Roell W, Breitbach M, Pillekamp F, Nygren JM, Sasse P, Rubenchik O, Fries JW, Wenzel D, Geisen C, Xia Y, Lu Z, Duan Y, Kettenhofen R, Jovinge S, Bloch W, Bohlen H, Welz A, Hescheler J, Jacobsen SE, Fleischmann BK. Engraftment of engineered ES cell-derived cardiomyocytes but not BM cells restores contractile function to the infarcted myocardium. J Exp Med. 2006;203(10):2315–2327. doi: 10.1084/jem.20061469. [DOI] [PMC free article] [PubMed] [Google Scholar]
- 6.Herreros J, Prosper F, Perez A, Gavira JJ, Garcia-Velloso MJ, Barba J, Sanchez PL, Canizo C, Rabago G, Marti-Climent JM, Hernandez M, Lopez-Holgado N, Gonzalez-Santos JM, Martin-Luengo C, Alegria E. Autologous intramyocardial injection of cultured skeletal muscle-derived stem cells in patients with non-acute myocardial infarction. Eur Heart J. 2003;24(22):2012–2020. doi: 10.1016/j.ehj.2003.09.012. [DOI] [PubMed] [Google Scholar]
- 7.Kattman SJ, Huber TL, Keller GM. Multipotent flk-1+ cardiovascular progenitor cells give rise to the cardiomyocyte, endothelial, and vascular smooth muscle lineages. Dev Cell. 2006;11(5):723–732. doi: 10.1016/j.devcel.2006.10.002. [DOI] [PubMed] [Google Scholar]
- 8.Beeres SL, Bengel FM, Bartunek J, Atsma DE, Hill JM, Vanderheyden M, Penicka M, Schalij MJ, Wijns W, Bax JJ. Role of imaging in cardiac stem cell therapy. J Am Coll Cardiol. 2007;49(11):1137–1148. doi: 10.1016/j.jacc.2006.10.072. [DOI] [PubMed] [Google Scholar]
- 9.Zhou R, Acton PD, Ferrari VA. Imaging stem cells implanted in infarcted myocardium. J Am Coll Cardiol. 2006;48(10):2094–2106. doi: 10.1016/j.jacc.2006.08.026. [DOI] [PMC free article] [PubMed] [Google Scholar]
- 10.Frangioni JV, Hajjar RJ. In vivo tracking of stem cells for clinical trials in cardiovascular disease. Circulation. 2004;110(21):3378–3383. doi: 10.1161/01.CIR.0000149840.46523.FC. [DOI] [PubMed] [Google Scholar]
- 11.Weber R, Wegener S, Ramos-Cabrer P, Wiedermann D, Hoehn M. MRI detection of macrophage activity after experimental stroke in rats: new indicators for late appearance of vascular degradation? Magn Reson Med. 2005;54(1):59–66. doi: 10.1002/mrm.20532. [DOI] [PubMed] [Google Scholar]
- 12.Kustermann E, Roell W, Breitbach M, Wecker S, Wiedermann D, Buehrle C, Welz A, Hescheler J, Fleischmann BK, Hoehn M. Stem cell implantation in ischemic mouse heart: a high-resolution magnetic resonance imaging investigation. NMR in biomedicine. 2005;18(6):362–370. doi: 10.1002/nbm.967. [DOI] [PubMed] [Google Scholar]
- 13.Mani V, Adler E, Briley-Saebo KC, Bystrup A, Fuster V, Keller G, Fayad ZA. Serial in vivo positive contrast MRI of iron oxide-labeled embryonic stem cell-derived cardiac precursor cells in a mouse model of myocardial infarction. Magn Reson Med. 2008;60:73–81. doi: 10.1002/mrm.21642. [DOI] [PubMed] [Google Scholar]
- 14.Wu YL, Ye Q, Foley LM, Hitchens TK, Sato K, Williams JB, Ho C. In situ labeling of immune cells with iron oxide particles: an approach to detect organ rejection by cellular MRI. Proc Natl Acad Sci U S A. 2006;103(6):1852–1857. doi: 10.1073/pnas.0507198103. [DOI] [PMC free article] [PubMed] [Google Scholar]
- 15.Tallheden T, Nannmark U, Lorentzon M, Rakotonirainy O, Soussi B, Waagstein F, Jeppsson A, Sjogren-Jansson E, Lindahl A, Omerovic E. In vivo MR imaging of magnetically labeled human embryonic stem cells. Life sciences. 2006;79(10):999–1006. doi: 10.1016/j.lfs.2006.05.021. [DOI] [PubMed] [Google Scholar]
- 16.Wegener S, Weber R, Ramos-Cabrer P, Uhlenkueken U, Sprenger C, Wiedermann D, Villringer A, Hoehn M. Temporal profile of T2-weighted MRI distinguishes between pannecrosis and selective neuronal death after transient focal cerebral ischemia in the rat. J Cereb Blood Flow Metab. 2006;26(1):38–47. doi: 10.1038/sj.jcbfm.9600166. [DOI] [PubMed] [Google Scholar]
- 17.Rajagopalan S, Prince M. Magnetic resonance angiographic techniques for the diagnosis of arterial disease. Cardiology clinics. 2002;20(4):501–512. v. doi: 10.1016/s0733-8651(02)00088-7. [DOI] [PubMed] [Google Scholar]
- 18.Nagel E, Klein C, Paetsch I, Hettwer S, Schnackenburg B, Wegscheider K, Fleck E. Magnetic resonance perfusion measurements for the noninvasive detection of coronary artery disease. Circulation. 2003;108(4):432–437. doi: 10.1161/01.CIR.0000080915.35024.A9. [DOI] [PubMed] [Google Scholar]
- 19.Kim RJ, Fieno DS, Parrish TB, Harris K, Chen EL, Simonetti O, Bundy J, Finn JP, Klocke FJ, Judd RM. Relationship of MRI delayed contrast enhancement to irreversible injury, infarct age, contractile function. Circulation. 1999;100(19):1992–2002. doi: 10.1161/01.cir.100.19.1992. [DOI] [PubMed] [Google Scholar]
- 20.Meding J, Urich M, Licha K, Reinhardt M, Misselwitz B, Fayad ZA, Weinmann HJ. Magnetic resonance imaging of atherosclerosis by targeting extracellular matrix deposition with Gadofluorine M. Contrast media & molecular imaging. 2007;2(3):120–129. doi: 10.1002/cmmi.137. [DOI] [PubMed] [Google Scholar]
- 21.Giesel FL, Stroick M, Griebe M, Troster H, von der Lieth CW, Requardt M, Rius M, Essig M, Kauczor HU, Hennerici MG, Fatar M. Gadofluorine m uptake in stem cells as a new magnetic resonance imaging tracking method: an in vitro and in vivo study. Investigative radiology. 2006;41(12):868–873. doi: 10.1097/01.rli.0000246147.44835.4c. [DOI] [PubMed] [Google Scholar]
- 22.Misselwitz B, Platzek J, Weinmann HJ. Early MR lymphography with gadofluorine M in rabbits. Radiology. 2004;231(3):682–688. doi: 10.1148/radiol.2313021000. [DOI] [PubMed] [Google Scholar]
- 23.Barkhausen J, Ebert W, Heyer C, Debatin JF, Weinmann HJ. Detection of atherosclerotic plaque with Gadofluorine-enhanced magnetic resonance imaging. Circulation. 2003;108(5):605–609. doi: 10.1161/01.CIR.0000079099.36306.10. [DOI] [PubMed] [Google Scholar]
- 24.Sirol M, Itskovich VV, Mani V, Aguinaldo JG, Fallon JT, Misselwitz B, Weinmann HJ, Fuster V, Toussaint JF, Fayad ZA. Lipid-rich atherosclerotic plaques detected by gadofluorine-enhanced in vivo magnetic resonance imaging. Circulation. 2004;109(23):2890–2896. doi: 10.1161/01.CIR.0000129310.17277.E7. [DOI] [PubMed] [Google Scholar]
- 25.Raatschen HJ, Swain R, Shames DM, Fu Y, Boyd Z, Zierhut ML, Wendland MF, Misselwitz B, Weinmann HJ, Wolf KJ, Brasch RC. MRI tumor characterization using Gd-GlyMe-DOTA-perfluorooctyl-mannose-conjugate (Gadofluorine M), a protein-avid contrast agent. Contrast media & molecular imaging. 2006;1(3):113–120. doi: 10.1002/cmmi.97. [DOI] [PubMed] [Google Scholar]
- 26.Bendszus M, Wessig C, Schutz A, Horn T, Kleinschnitz C, Sommer C, Misselwitz B, Stoll G. Assessment of nerve degeneration by gadofluorine M-enhanced magnetic resonance imaging. Annals of neurology. 2005;57(3):388–395. doi: 10.1002/ana.20404. [DOI] [PubMed] [Google Scholar]
- 27.Henning TD, Saborowski O, Golovko D, Boddington S, Bauer JS, Fu Y, Meier R, Pietsch H, Sennino B, McDonald DM, Daldrup-Link HE. Cell labeling with the positive MR contrast agent Gadofluorine M. European radiology. 2007;17(5):1226–1234. doi: 10.1007/s00330-006-0522-9. [DOI] [PubMed] [Google Scholar]
- 28.Keller G, Kennedy M, Papayannopoulou T, Wiles MV. Hematopoietic commitment duringembryonic stem cells differentiation in culture. Mol. Cell. Biol. 1993;13:473–486. doi: 10.1128/mcb.13.1.473. [DOI] [PMC free article] [PubMed] [Google Scholar]
- 29.Mosmann T. Rapid colorimetric assay for cellular growth and survival: application to proliferation and cytotoxicity assays. Journal of immunological methods. 1983;65(1–2):55–63. doi: 10.1016/0022-1759(83)90303-4. [DOI] [PubMed] [Google Scholar]
Associated Data
This section collects any data citations, data availability statements, or supplementary materials included in this article.