Abstract
This work describes the synthesis of chlorapatite single crystals using the molten salt method with CaCl2 as a flux. By manipulating the processing conditions (amount of flux, firing time and temperature, and cooling rates) it is possible to manipulate the crystal morphology from microscopic fibres to large crystals (up to few millimetre long and ~100 μm thick). The crystal roughness can be controlled to achieve very flat surfaces by changing the melt composition “in situ” at high temperature. The Young modulus and hardness of the crystals are 110 ± 15 and 6.6 ± 1.5 GPa respectively as measured by nanoindentation. Crystal dissolution in Hanks solution starts around the defects. Several in vitro assays were performed; ClAp crystals with different size and shape are biocompatible. Cell apoptosis was very low at 5, 10, and 15 days (Caspase-3) for all the samples. Proliferation (MTT) showed to be influenced by surface roughness and size of the crystals.
1 Introduction
There is an increasing interest in the synthesis of calcium phosphate single crystals and fibres for their use as reinforcement in composite bioceramics or to perform basic chemical, biological and mechanical analyses [1–3]. For example, large apatite crystals can be used to determine intrinsic properties and analyse basic surface chemical and biological processes that play a critical role in the resorption and remodelling of bone and bioactive implants [4]. In this respect, apatite crystals can be used to study dissolution [5, 6], protein adsorption [7, 8], or mechanical response and their dependence with crystal orientation [9–11].
One of the possible uses of large single crystal surfaces is the study of the effects of roughness and crystal orientation on cell response in vitro. Even if the exact mechanism of how topographic cues influence osteointegration has not been completely explained, researchers are still looking for an ideal microarchitecture for engineering a cell niche where cellular adhesion, spreading and differentiation could take place [12–15]. The chemical features on the surface of an implant will also mediate on the adsorption of biomolecules, and crystalline orientation can directly affect cell adhesion, communication and differentiation, key processes to be considered when dealing with biomaterial design [16].
Apatite crystals have been fabricated following different approaches, such as molten salt synthesis or hydrothermal methods [17–19]. Hydrothermal synthesis is typically used to produce pure microscopic crystals with complex compositions such as hydroxyapatite but it usually requires long times (days) and controlled atmosphere [20, 21]. The term ‘molten salt’ or “molten flux” is commonly used to describe a process for the fabrication of inorganic crystals, in which a molten salt acts both as reagent and flux. This procedure has previously been employed by other authors to fabricate large apatite crystals for biomedical applications [22]. The solute is dissolved in the melt and then reacts with the flux to form large single-crystals at high temperature. An important aspect of the technique is the possibility of doping the crystals through the inclusion of diverse ions in the melt. Single-crystal formation is controlled by several factors, such as the thermodynamics of the reaction, melting point of the flux and phase stability [23].
Several authors have reported the molten salt synthesis of large chlorapatite (ClAp) single crystals using NaCl as a fluxes and a mixture of CaHPO4·2H2O, CaCO3 and CaCl2 as solute [17–19]. By using calcium chloride also as a flux the introduction of impurities (e.g. Na, CO32− ions) in the ClAp structure can be avoided. For example, Prener [17–19], reported the synthesis of large ClAp single-crystals (up to 4 mm) using calcium chloride as a flux and microcrystalline ClAp as solute. The process took over a month because the maximum temperature (50 °C above the liquid temperature [24]) was maintained for 10–20 h, and the cooling rates ranged between 2 and 4 °C/h.
Since the control of the crystal morphology and chemistry is crucial, the objective of this work is to systematically study the role of the processing conditions (melt composition, firing temperature and time, and cooling rates) on size, shape and surface roughness of pure ClAp crystals prepared using CaCl2–tricalcium phosphate (TCP) mixtures. This system has been selected to avoid the presence of additional ions in the flux that could result in the introduction of impurities. The mechanical properties of these ClAp single-crystals were analysed by nanoindentation and their ion release in Hanks’ solution under physiological conditions was monitored as a function of time. Selected single-crystals with different surface roughness and topographies were used in cell proliferation studies combining a MTT essay with confocal microscopy and scanning electron microscopy, SEM [25].
2 Experimental procedure
2.1 Crystal growth
CaCl2 (Merck, PA, CaCl2·2H2O CAS 10043-52-4) and β-TCP [β-Ca3(PO4)2, β-TCP, purity >99 %, Keramat®, Spain] powders were mechanically blended in different proportions in an agate mortar (Restch, RM-100, Germany) for 12 min. Prior to mixing the CaCl2 flux was dehydrated at 110 °C for 2 weeks. Thermo-gravimetric analysis (PL–STA, Polymer Laboratories, Thermal Science Division) of the dehydrated flux showed that the remaining H2O percentage was 8wt.% and water is fully eliminated at 300 °C. After milling, the mixtures were uniaxially pressed at 60 MPa into cylindrical pellets (2.54 cm diameter) using a stainless steel dye. Five pellets (~12–15 g per batch) were placed inside a Platinum crucible and the growth process took place in a rapid melting furnace (RMF, ENTECH, Sweden) at 1,100 °C for times ranging between 15 and 240 min. The heating rate was 10 °C min−1, and the cooling rates varied between 1 °C min−1 and quenching in air. The experimental conditions are summarized in Table 1. After cooling, the sample was washed, by rinsing in deionized water to dissolve the leftover flux. The crystals were vacuum-filtered and washing was repeated three times. Subsequently they were sieved trough a 63 μm mesh, and dried at 110 °C for 20 h.
Table 1.
Experimental conditions during the growth process
| Exp. | Mixture composition | Cooling rate |
|---|---|---|
| E1 | M1—stoichiometric 89.33wt.% Ca3(PO4)2 | ~10 °C min−1 |
| E2 | M2—80wt.% Ca3(PO4)2 (rich in solute) | ~10 °C min−1 |
| E3 | M3—25wt.% Ca3(PO4)2 (rich in flux) | ~10 °C min−1 |
| E4 | M3—25wt.% Ca3(PO4)2 (rich in flux) | Slow cooling (1 °C min−1) |
| E5 | M3—25wt.% Ca3(PO4)2 (rich in flux) | Quenching in air |
| E6 | Starting: M3 25wt.% Ca3(PO4)2 (rich in flux) After firing 4 h: solute was added to achieve stoichiometric mixture |
Quenching in air (after changing the composition ‘in situ’ at 1,100 °C) |
2.2 Characterisation
The samples were analysed by powder X-ray diffraction. In order to get the best peak profile and minimize orientation effects, the samples were milled in a ball mill and the powder was sieved through a 63 μm mesh. LeBail refinements of X-ray powder diffraction data were performed using the Rietica software (IUCR) [26]. To perform these analyses we used the structural parameters obtained from the refinement of single-crystal XRD data [27] (files from CSD-380442 to CSD-380449 contain the crystallographic data). The peak shape was assumed to be a pseudo-Voigt (pV) function with asymmetry. In some of the refinements the background was subtracted from the diffraction pattern by using the EVA software (BRUKER). Considering the integrated intensity of the peaks just only as a function of structure/microstructure parameters, the Marquardt least squares procedures were adopted to minimize the difference between the observed and simulated powder diffraction patterns. Minimization was carried out with the reliability index parameter Rwp (weighted-profile, R-factor), the Rexp (expected R-factor) and RB (Bragg factor). The accuracy of the fit was established by comparing Rwp with the expected error, Rexp [26].
Morphology, size and shape of the samples were analyzed by optical microscopy (NIKON OPTIPHOT2-PQL). The program ImageJ 1.43u (National Institute of Health, USA) was employed to characterize the sizes and shapes of the crystals (length, thickness and aspect ratio, AR). The crystal morphology and chemical composition were also analysed by scanning electron microscopy (SEM) on a JEOL 1640 equipped with an energy dispersive spectroscopy (EDS) microprobe (INCA Sight Oxford-instruments, UK). Vertical Scanning White Light Interferometry (VS-WLI, ZYGO NewView 200) and Atomic Force Microscopy (AFM, Ambios Technology Q-ScopeTM 250/400 NomadTM) were used to study the topography and roughness of the surface of crystals, fixed to glass-slides with a thin layer of Acrylates/t-Butylacrylamide copolymer spray.
The samples were analyzed by infrared Fourier spectroscopy (FTIR Bomem, MB-100 series, USA). The spectrum was acquired in the transmission mode, in the range of 400–4,000 cm−1, with a resolution 2 cm−1. To perform the analysis, pellets (containing 100 mg of dry KBr mixed with 1 mg of crushed single crystals) were prepared and vacuum dye pressed. Inducted coupled plasma-optical emission spectroscopy (ICP-OES, Varian model Liberty 200) was employed to evaluate the presence of impurities in the ClAp crystals. The crystals were dissolved in a nitric acid solution (5wt.%), which was used as blank prior to measure, to evaluate the presence of impurities.
2.3 ‘In vitro’ studies
2.3.1 Ion release
The ion release from ClAp single crystals under physiological conditions was monitored. To do so, 0.5 g of ClAp crystals were immersed in 50 ml Hanks’ solution in poly-ethylene bottles. The solution was maintained static (without stirring) and the bottles were stored at 37 °C for periods ranging from 1 to 32 days. After the each specified time period the samples were removed from the oven, filtered and analysed. Calcium and phosphorus concentrations in solution were measured by ICP, and chloride concentration by using a selective electrode (9617BNWP) attached to Thermo Benchtop pH/ISE Model 720A. After drying the surface morphology of the ClAp crystals was analysed using SEM.
2.3.2 Cell culture
Adult mesenchymal stem cells where isolated from human bone marrow donated from the Department of Orthopaedics, University of Santiago de Compostela. The bone marrow sample was stored in EDTA tubes to avoid clogging. Upon arrival to the laboratory, 10 ml of bone marrow were pipetted over 10 ml of Ficoll in order to perform a gradient as described by the Histopaque-1077 protocol by Sigma–Aldrich. The tubes are placed in a centrifuge at 2,000 rpm for 20 min. Immediately after the centrifugation has finished the interface rich in Mesenchymal cells is collected and sub-cultured in D-MEM (Gibco) supplemented with 10 % Foetal Bovine Serum from Sigma and Getamycin.
After cells are confluent (90 % of confluence is achieved after 2 weeks), the flask is trypsinised, cells are counted and seeded at a density of 30 × 103 cells cm−2. Three different times were chosen to proceed with the experiment. Cells were cultured on 4 ClAp substrates: microscopic-sized crystals with prism shape and flat surfaces; microscopic-sized crystals with needle and flake shape; millimetresized crystals with surface microscopic roughness; and pieces of sintered ClAp powder as reference material at 5, 10 and 15 days. Cells are cultured in 24 well plates.
2.3.3 Proliferation assay
An MTT assay was done to assess cell proliferation on the test surfaces. Samples were prepared following the CGD-1 MTT protocol by Sigma–Aldrich. Cell culture media lacks from phenol red. Plates are incubated following the manufacturers protocol. After 5 h of MTT incubation, cells are lysed and formazan crystals dissolved. Supernatant is collected and absorbance measured at 570 nm in a microplate reader (Biorad).
2.3.4 Caspase assay
Apoptosis was quantified by means of a Caspase 3 activity test (Bendermedsystems). Cell culture supernatants were taken from each sample after 5, 10 and 15 days. These aliquots were stored at −20 °C before being assayed following the ELISA protocol provided by the manufacturer. All aliquots were read on a micro-plate reader at 540 nm.
2.3.5 Confocal microscopy: live/dead staining
Special cell culture chambers from Nalgene were used for this part of the experiment. Cells were cultured in the same fashion as the other experiments. After each single control time (5, 10 and 15 days), samples were stained with (Ca2PO4Cl) calcein-AM (Sigma–Aldrich) and propidium iodide (PI) (Invitrogen). Immediately after the staining phase, the culture chambers were placed on a confocal microscope (LEICA AF-5). Alive cells present and intact membrane thus, calcein will stain them in green while dead cells allow PI to stain the inner nuclear material in red.
2.4 Nanoindentation tests
Nanoindentation (Nano Test, Micro Materials Ltd. Wrexham, UK) on the surface of the larger single crystals was performed using a standard diamond Berkovich tip with a maximum load of 25 mN and loading rate 1.25 m Ns−1. The dwell periods at maximum load and for drift correction were 30 s. To ensure stability, the millimetresized crystals were embedded in Bakelite resin. Samples were polished down 6 μm SiC, in order to obtain flat surfaces and avoid the effect of angled indentation [28]. Several nanoindentations per crystal were placed on 30 different crystals, the distances between indents was ten times the size of the residual impression shape. The hardness (H) and the reduced modulus (Er) are calculated using the data of the unloading curve by the Oliver and Pharr method [29]. The number of indentations was over 80. All the load–displacement curves were checked and also the morphology of the indents was observed with SEM, in order to identify possible sources of error such us ‘pile up’ or ‘pop in’ among others.
3 Results and discussion
Three different mixtures of CaCl2 and β-TCP (Fig. 1) were used to synthesize ClAp crystals. This system was selected to avoid the presence of additional species that could get incorporated into the ClAp structure, such as potassium or carbonates from the flux or the starting reagents [18, 19, 22, 30]. The mixtures, with CaCl2 contents ranging between 10.65 (stoichiometric) and 75wt.% were fired at 1,100 °C for times between 30 min and 4 h. At this temperature all the compositions are in the primary crystallization field of ClAp (Ca5(PO4)3Cl) with liquid content between 0 and 86wt.%. At 1,100 °C the equilibrium composition of the liquid is 87wt.% CaCl2–13wt.% β-TCP [24] and the solute (β-TCP) reacts with the melt to form ClAp:
| (r.1) |
Fig. 1.
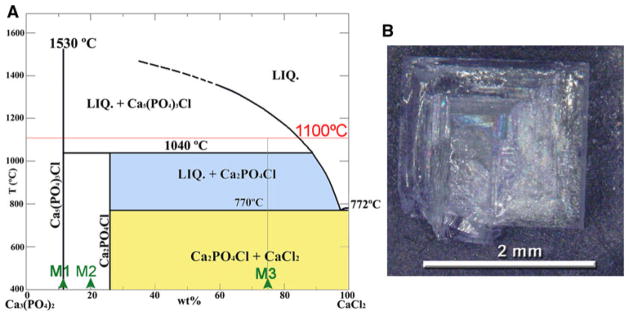
a Phase diagram of the Ca3(PO4)2–CaCl2 system [24] showing the mixtures used for the synthesis of chlorapatite single crystals (M1, M2 and M3). b Picture of a spodiosite twin obtained from a mixture rich in flux (M3 in a). The mixture was fired at 1,100 °C for 30 min, and afterwards slowly cooled at 1 °C min−1, favouring the complete transformation to spodiosite
During cooling the ClAp crystals and the liquid will undergo the peritectic reaction at 1,040 °C to produce spodiosite (Fig. 1):
| (r.2) |
Upon further cooling (below 770 °C) the compositions with CaCl2 content larger than 27wt.% (M2 and M3 mixtures, Fig. 1) will undergo the eutectic reaction:
| (r.3) |
In order to avoid the formation of spodiosite and obtain ClAp single crystals the cooling rates should be fast enough to suppress reactions r. 2 and r. 3. According to our results cooling rates faster than ~10 °C min−1 are enough to suppress (at least partially) these reactions and prepare ClAp. The size and AR of the ClAp crystals depends on the composition of the mixture (solute or flux rich) that determines the liquid amount at 1,100 °C, and the cooling rate. Less liquid (12wt.%) results in small equiaxed prisms (Fig. 2) whereas more liquid (86wt.%) is needed to obtain large crystals with high AR (Fig. 4).
Fig. 2.
SEM images showing the morphology of chlorapatite crystals obtained from a mixture rich in solute (M2) that contains 12wt.% liquid at 1,100 °C. The result is the formation of equiaxed crystals with micrometric dimensions (L = 13 ± 7 μm; D = 6 ± 4 μm) and low aspect ratio [AR (L/D) = 2.4 ± 1]
Fig. 4.
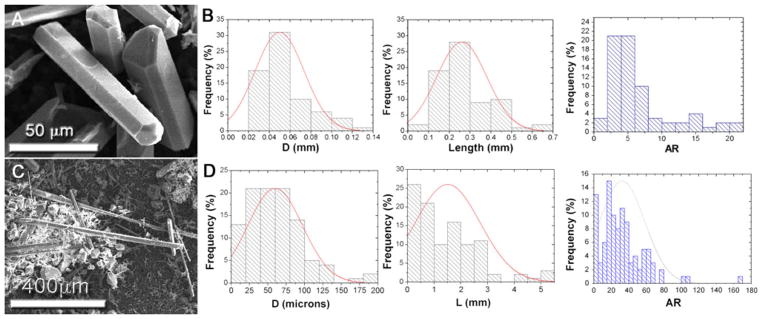
a SEM images of crystals grown from a mixture rich in flux (M3) after cooling at ~10 °C min−1 (exp. E3); b corresponding length, diameter and aspect ratio (AR) distributions. c Crystals obtained from the same composition after quenching (exp. E5). d Corresponding distributions
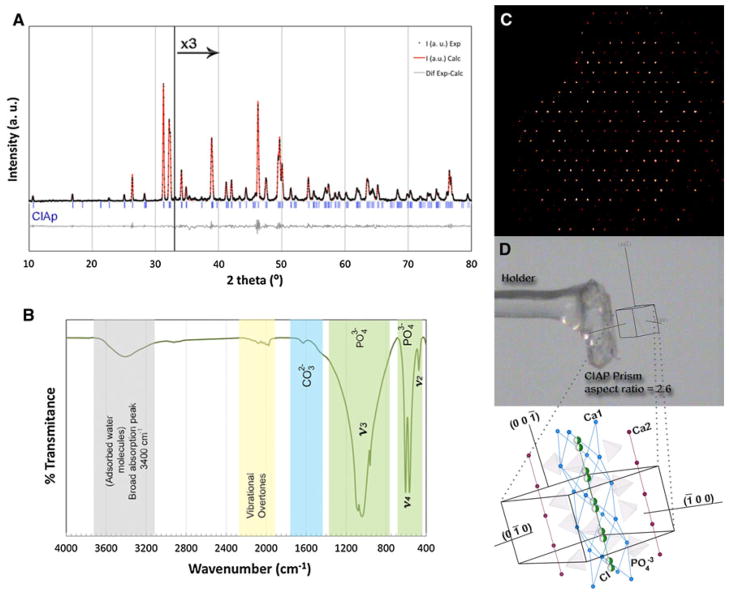
In all cases the ClAp crystals have the same diffraction pattern and IR spectrum (Fig. 3). The LeBail fit of the powder XRD pattern (Fig. 3a) shows a remarkable agreement with experimental data. Single crystal X-ray diffraction (SXRD) showed that the ClAp crystals have hexagonal symmetry and P63/m space group (Fig. 3c, d) [27], so we employed the unit cell parameters obtained after solving the structure to perform the LeBail fit. These refinements were adequate for all the samples. The precession picture of one of the SXRD collections is included in Fig. 3c, as well as the ‘in situ’ single crystal face indexing (Fig. 3d). The IR spectrum shows clear bands corresponding to phosphate [31] (Fig. 3b) and the vibration overtones as well as a broad band in the vicinity of 3,400 cm−1 due to absorption of water molecules [31]. This analysis can rule out the presence of hydroxyl groups due to the absence of its characteristic vibration bands (3,572, 631 and 342 cm−1; vibration characteristics modes of OH bonds, [31]). A small band with a wave number corresponding to carbonate groups (1,600 cm−1) can also be observed [31]. However, the inclusion of carbonates has been ruled out from single crystal diffraction data and this band may be due to the carbonation of a small amount of leftover flux. Moreover, the presence of other impurities, which could be incorporated in the apatite structure such as Al, Si, Ti, Na, K, Mn, Cr, Mg, Fe, Cu, Ni, and Zn, coming from the starting materials has been discarded by ICP analyses.
Fig. 3.
a Le Bail refinement of powder X-ray diffraction data (for 2θ >33° data were multiplied by 3 to facilitate the visualization of the fit): Rp (%) = 6.91, Rwp (%) = 4.13, lattice parameters a = 9.64490(9) Å and c = 6.7578(11) Å. b FT-IR spectra for ClAp crystals. c Precession picture obtained from the SXRD data collection. d SXFI results obtained from one ClAp single crystal. The atomic model inserted is oriented to match the results of the indexing analysis. The tetrahedrons represent PO43− (P centre, and O in 4 vertex), the Ca2+ that coordinates with chloride (in green half spheres) and 7 O2− are shown in blue; the Ca2+ that coordinates with 9 O2− are shown in red and the unit cell is indicated with a black line (Color figure online)
Chlorapatite (ClAp) crystals with macroscopic dimensions were obtained when the liquid content is high. Their size (from 30 to 50 μm up to several mm) and shape (flake, needle and prism) depend significantly on the cooling rate (Fig. 4) as has been observed in other systems [19]. After firing for 30 min at 1,100 °C and for a cooling rate of ~10 °C min−1 the crystals have an average length of 0.3 ± 0.1 mm, and thickness of 50 ± 20 μm and AR values up to 20 (Fig. 4b). Quenching increases the length and AR values with 80 % of the crystals having an AR value above 30. The average AR is 32 ± 25, the average length 1.5 ± 1.2 mm and the average thickness 60 ± 37 μm with some crystals reaching lengths up to 5 mm and AR values up to 166 (Fig. 4d). Longer firing times (from 30 min to 8 h) result in thicker crystals (up to ~250 μm) but there is not a noticeable increase in their length. It is clear that under these experimental conditions growth along the hexagonal axis is favored. Moreover, after quenching there is a higher presence of microcrystals with needle-like or flake shapes (the amount range between 10 and 20wt.%). This may be justified by the massive precipitation of small ClAp nuclei due to the fast cooling that leads to the formation of these microcrystals.
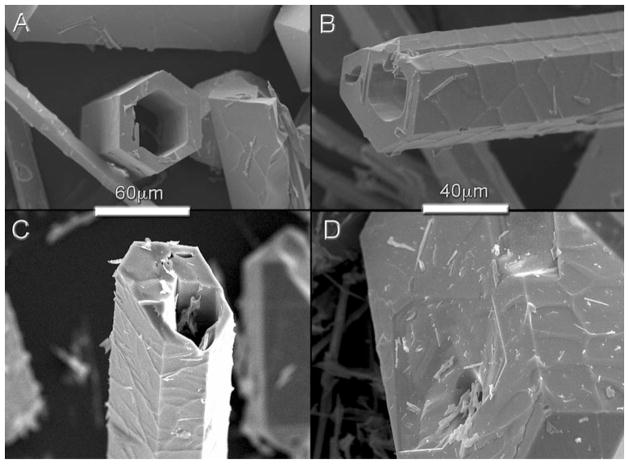
The final crystal shape is determined by the relative surface free energies and the growth kinetics. The growth in hexagonal axis direction (63) seems to be favored under faster cooling rates [32–34]. Several defects were identified during the morphological analyses of the crystals such as the ‘hollow-cores’ reported by Arends and Jongebloed (Fig. 5a, b) [35], that resulted in the formation of ‘micro-tubes’ as those previously described by Zhou et al. [36]. The crystals grow along the c-axis following a kinetic spiral arrangement of atoms, which is the responsible for the anisotropic growth and also for the preferred atomic dislocation mechanism along the 63 axes. Defects like hexagonal holes on prism planes were also observed. The point where the dislocation lines emerge in the surface is an active site and its chemical reactivity is increased. It has been reported that apatite crystals have edge dislocations, whose Burgers vectors is parallel to ‘c’-axis, are favored [35], dissolution progressing along linear defects (edge dislocations) has also been described [37]. These phenomena explain the formation of ClAp hollow-core crystals (Fig. 5) due to precipitation–dissolution–recrystallization during crystal growth in the melt [36]. First, the crystals grow along a preferred direction and several dislocations may form during this process. Afterwards, these less stable sites, where the dislocations emerge in the surface, are more easily dissolved, and then there is a recrystallization of the species in the melt. This sequence leads to the formation of crystals with hollow cores, and in some cases, the formation of ClAp microtubes.
Fig. 5.
a, b SEM pictures showing defects hollow-core formed during crystal growth (during the growing process the core was removed by precipitation–dissolution–recrystallization that leads to the formation of chlorapatite microtubes). c, d SEM pictures of the chlorapatite single-crystals after soaking in Hanks’ solution (c 24 h, d 8 days)
The ClAp crystals obtained from a mixture rich in flux (Table 1, E3, E5) have a characteristic roughness on their surfaces resulting from the peritectic reaction during cooling (Fig. 6a, b). In order to obtain large ClAp crystals with smooth surfaces we carried out an experiment in which the composition of the mixture was changed ‘in situ’ by adding additional solute (Ca3(PO4)2) at 1,100 °C after 4 h at temperature. Then, after 30 min the sample was quenched in air (Table 1, E6). In this way the overall composition was moved towards stoichiometric ClAp after big chloroapatite crystals had grown in the flux-rich melt, avoiding the peritectic reaction during cooling. The result was a mixture of macroscopic crystals accompanied by a large amount of microscopic and hexagonal ClAp prisms. All crystals have flat surfaces (Fig. 6c, d) much smoother than those of the samples whose composition was not changed ‘in situ’ (Fig. 6a, b). The average roughness, calculated using optical interferometry, of the crystals whose composition was not changed was Ra = 0.284 μm (Table 1, E5), whereas after changing the composition ‘in situ’, there are characteristic steps of the order of 32.52 nm (Fig. 6d). Considering the unit cell parameters, these steps correspond to 34 unit cells.
Fig. 6.
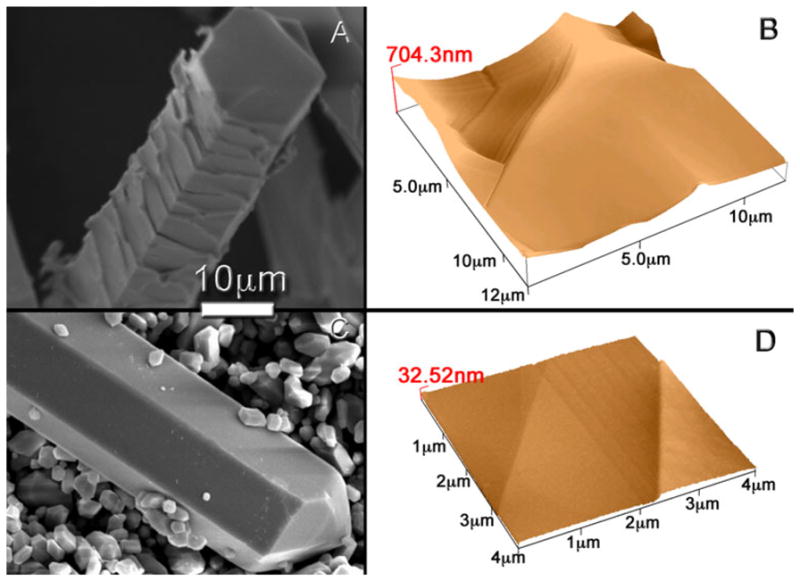
Topographic analysis: SEM pictures of ClAp crystals after a experiment E5 and b experiment E6, where the melt composition was changed ‘in situ’ at high temperature towards stoichiometric ClAp by adding TCP. The change of the composition ‘in situ’ affects notably the morphology, and surface properties of the ClAp crystals. a Shows the characteristic roughness of the surface of a crystal obtained after experiment E5, while b shows the flat surface of a crystal obtained after experiment E6. c AFM image of a chlorapatite fibre (thick: 50 μm, length: 5 mm) obtained after experiment E5; this image shows the characteristic roughness of these crystals. d AFM image of a chlorapatite crystal obtained after experiment E6
In vitro tests in Hanks’ solution allowed us to evaluate ion release from the material under conditions similar to those of the human body. Single crystals can be used to perform careful studies to reveal the dissolution mechanisms of apatite that could be involved in bone remodeling [5, 6]. The use of single crystals could offer insights on the role of defects and crystallography that cannot be obtained with polycrystalline bulk samples. It has been reported that the presence of defects in single crystals plays an important role in the dissolution process in acidic conditions [37–39]. Dislocations are active sites and first candidates of dissolution process. During the dissolution experiments in Hanks’ solutions at pH 7 saturation of Ca2+ and PO43− in the solution takes place at ~48 h (Fig. 7a). After this time, the Ca2+ and PO43− concentrations diminish due to the likely precipitation of CaPs, though no surface deposits were detected, some precipitates where observed in the liquid after filtering. The Cl− concentration keeps increasing up to 16 days (Fig. 7b). This means that ClAp crystals keep dissolving and CaPs precipitating. The initial decrease of chloride concentration in the first 5 days is probably due to salt precipitation.
Fig. 7.
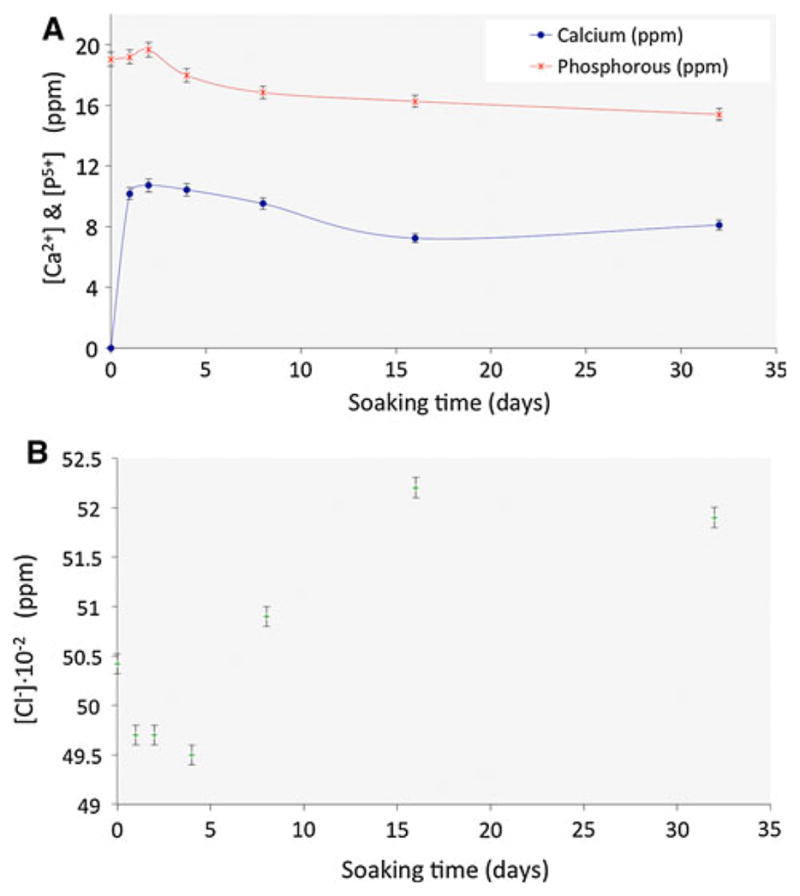
Time evolution of the ion concentrations of Hanks’ solution containing ClAp crystals under physiological conditions (37 °C) at different times (range between 1 and 32 days): a calcium and phosphorous concentrations (ICP); b chloride concentration (selective electrode)
After soaking in Hanks’ solution (Table 2), we observed the formation of etch pits as well a larger presence of hollow core crystals (Fig. 5c) formed by dissolution. In some cases it can be observed that dissolution takes place along the crystallographic planes as the soaking time increases (Fig. 5d). This is similar to what has been observed during the dissolution of hydroxyapatite crystals [5, 6]. Furthermore, the ‘peritectic’ roughness was smoother after soaking.
Table 2.
Salt concentrations in Hanks’ solution and human plasma
| HCO3− (mM) | HPO42− (mM) | Ca2+ (mM) | Mg2+ (mM) | K+ (mM) | Na+ (mM) | Cl− (mM) | D-glucose (g/l) | |
|---|---|---|---|---|---|---|---|---|
| Plasma | 13.5 | 1.0 | 2.5 | 1.5 | 5 | 142 | 103 | |
| Hanks solution | 4.2 | 0.7 | – | – | 5.8 | 141.7 | 142.2 | 1 |
The average H of the ClAp crystals is 6.6 ± 1.5 GPa and the elastic modulus (Es) is 110 ± 15 GPa (Fig. 8). These values are of the order of those typically reported for hydroxyapatite single crystals and thin films as well as those calculated using ‘abinitio’ models [9–11, 20, 28]. Neira et al. [20] have reported lower values (Es of 62 ± 7 and 68 ± 8 GPa on prism and basal-faceted respectively). However, their crystals were much smaller (errors can arise from the small size of the crystals compared to the nano-indentation depth) and fabricated using a hydrothermal method. Viswanath et al. [10] and Saber-Samandari and Gross [11] measurements on synthetic and natural single HA crystals also show that anisotropy is smaller than 10 %. However, it must also to be pointed out that due to the complex stress field generated during nanoindentation the measured values are weighted averages over several directions.
Fig. 8.
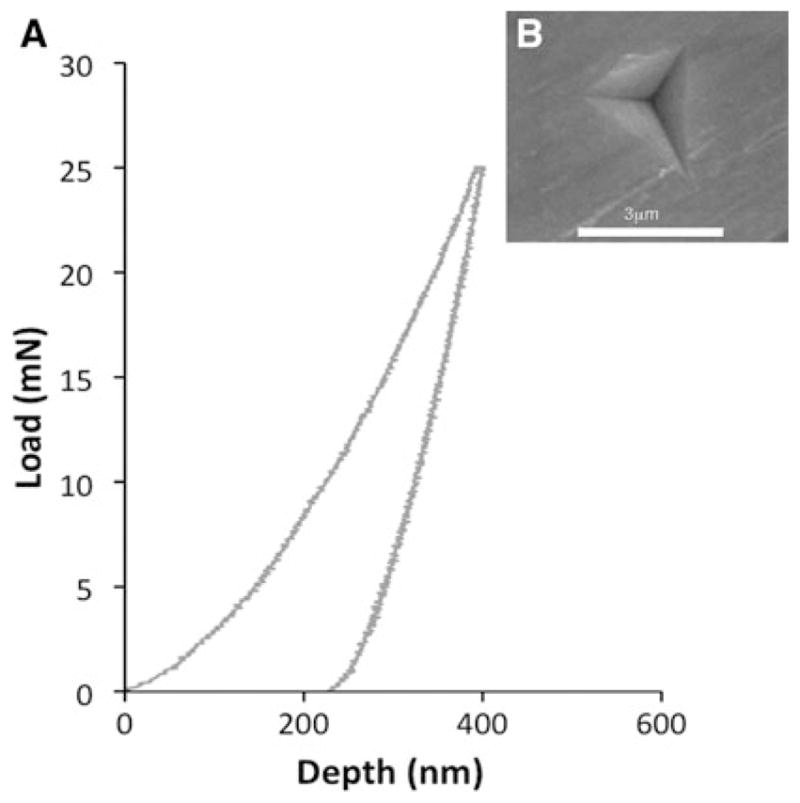
a Characteristic load–displacement curve for a nanoindentation test on the surface of a prism face of ClAp single crystal after polishing. The values of elastic modulus (Es) were calculated using the reduced modulus and Poisson’s ratios of diamond (Ei = 1141 GPa, νi = 0.07 [41]) and chlorapatite (νi = 0.27, [42, 43]); b SEM image showing the indentation print, neither pile-up nor cracks are observed
Virtually any cell cultured on a biomaterial surface will initially adhere to the surface before proceeding to spread. Cell communication will take place when several cells become confluent at a point allowing the formation of ECM and a higher concentration of cytokines such as growth factor or other recruiting molecules. Cytoskeleton dispositions are deeply tuned by topographical cues. Surface chemistry and topography are the two main influential factors on how a cell type will react to a biomaterial surface. Chemistry is an influential factor for cell attachment while topographic cues will guide cytoskeleton re-arrangement leading to a contact guidance phenomena as well as cell shape changes. Contact guidance plays a key role in vivo, where topography influences direct development, and organ regeneration [40], cell will respond to different stimuli in their surrounding cell nice based on such factors.
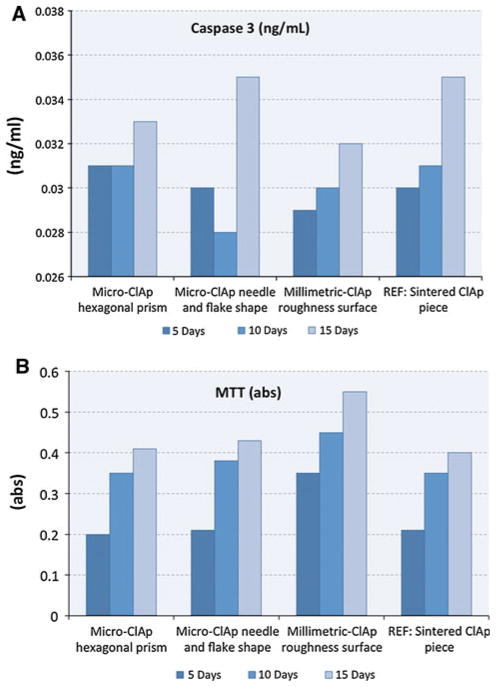
ELISA results for Caspase 3 (Fig. 9a) showed how millimetric ClAp crystals with rough surfaces are triggering less Caspase 3 expression than the other samples. Cultured stem cells are adhering and spreading on the rough surface, allowing good cell communication by providing an optimum microenvironment. As a result, cells are proliferating faster than in the micro-ClAp needle, flake and prism shaped samples, which are showing a significantly higher expression of Caspase 3. Sintered ClAp pieces used as a control are also triggering a more acute apoptosis rate than the millimetric-ClAp samples.
Fig. 9.
a Caspase 3 assay. 30 × 103 cells cm−2 Mesenchymal stem cells are cultured for 5, 10 and 15 days. Cell apoptosis is low (low concentrations of Caspase 3 <0.6 ng/ml). All samples are non-toxic. Millimetre-size ClAp samples express the lowest Caspase 3 level. b MTT performed at a 30 × 103 cells cm−2 cell density for 5, 10 and 15 days, millimetre-size ClAp crystals show the higher proliferation
Roughness plays a key part of cell-material interactions. Once adhered onto the surface, cells start spreading and proliferating. Figure 9b shows the proliferation assay obtained for the cultured mesenchymal stem cells. Millimetric-ClAp samples promote high proliferation. Due to their dimensions and surface roughness these crystals are a better cell substrate than microscopic crystals or sintered ClAp pieces. Cells interact with each other by exploiting cell–cell communications mediated by local microenvironments. It must be pointed out that all the studied samples are biocompatible. When compared to the other groups, cells cultured on the millimetric-ClAp crystals proliferate faster, reaching a clear difference by day 15 (Fig. 9). On Fig. 10b it is possible to observe a “contact guidance” phenomena. Cells are following different rough patterns, which are mimicking a molecular niche. ECM is noticeable in Fig. 10b. After 15 days most crystals are allowing cell spreading and the surface is entirely colonized.
Fig. 10.
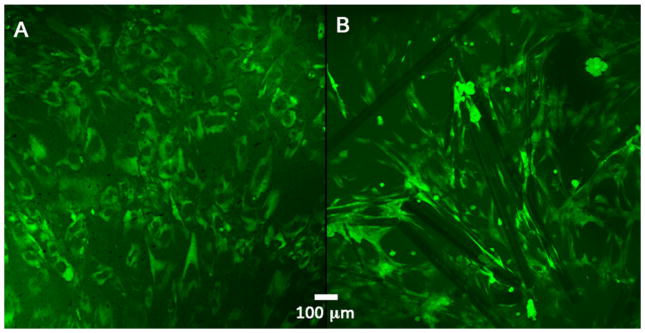
Fluorescence images: calcein-AM and propidium iodide stain. a Cells on the reference material: cells are showing no clear pattern; there is a lack of alignment or organization, which ultimately leads to a lesser ECM expression. b Millimetric ClAp crystals with microscopic surface roughness: in this case there is a clear pattern in cell disposition, filopodia are present while cells are knitting a close ECM outline while communicating with neighbouring cell aggregates. Cells are spreading and showing contact guidance characteristics after 15 days of culture
SEM pictures reveal how philopodia and lamellipodia from the stem cell cytoskeletons are exploring the surface and mediating on ECM secretion (Fig. 11). Figure 11a shows how there is a clear cell–cell communication mediated by surface properties, philopodia are connecting two different areas apart from each other, making possible a faster adhesion and proliferation. Figure 11b is interesting since it is possible to see how ECM is already present, there is also an established anchorage and a continuous seek for cell communication from nearby crystals.
Fig. 11.
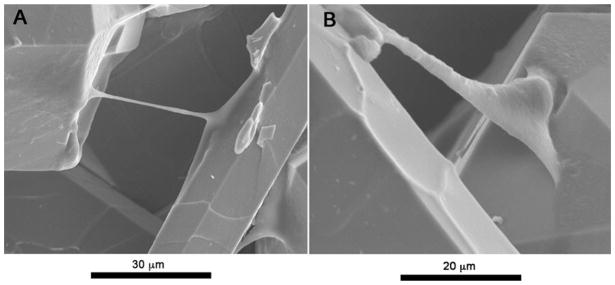
Millimetric ClAp crystals with microscopic surface roughness: cells are spreading and interacting with the surface and communicating with neighbouring mesenchymal stem cells by means of both, filopodia and lamellipodia (a). A rich ECM concentration is observed coating the crystal surface. Stem cells are showing characteristic contact guidance behaviour along the interface (b)
4 Conclusions
These results show that it is possible to use mixtures of CaCl2 and TCP to grow ClAp crystals with controlled AR using the molten salt method. The composition of the mixture, the firing temperature and the cooling rates determine crystal size and shape. Large crystals can be prepared using CaCl2/TCP mixtures rich in flux (75 wt.% CaCl2) fired at 1,100 °C and cooled faster than 10 °C min−1 to suppress/minimize the peritectic reaction that will result in the formation of spodiosite. These crystals can be as long as 5 mm, and with ARs up to 160. These crystals have a characteristic surface roughness resulting from the peritectic reaction during cooling. This roughness can be suppressed by changing “in situ” at temperature the composition of the melt (adding TCP after some time when ClAp has formed) until it moves towards that of stoichiometric ClAp. The dissolution studies in Hanks’ solution show the formation of etch pits and hollow core crystals. In vitro studies show the contact guided behaviour of cells grown on elongated and fibre-like single crystal beds. The cells tend to follow the crystal shape and the different rough patterns, which mimic a molecular niche.
Acknowledgments
This work has been partially supported by the Galician Government project number PGIDT09TMT003239PR. SXRD measurements were performed at the Unidade de Raios X. RIAIDT. University of Santiago de Compostela, Spain. ES acknowledges support from the National Institutes of Health/National Institute of Dental and Craniofacial Research (NIH/NIDCR) Grant No. 1 R01 DE015633 and 2R01DE015821. We also thank to Dr. F. Giuliani and Dr. V. Bhakhri for the collaboration to carry out the mechanical characterization.
Contributor Information
Esther García-Tuñón, Email: esther.garcia-tunon@imperial.ac.uk, Instituto de Cerámica de Galicia, Universidad Santiago de Compostela, Avda Mestre Mateo S/N, 15706 Santiago de Compostela, Spain.
Ramiro Couceiro, Instituto de Cerámica de Galicia, Universidad Santiago de Compostela, Avda Mestre Mateo S/N, 15706 Santiago de Compostela, Spain.
Jaime Franco, Keramat S. L., Polígono Novo Milladoiro, Ames, Spain.
Eduardo Saiz, Materials Department, Centre for Advanced Structural Ceramics, Imperial College London, London SW7 2AZ, UK.
Francisco Guitián, Instituto de Cerámica de Galicia, Universidad Santiago de Compostela, Avda Mestre Mateo S/N, 15706 Santiago de Compostela, Spain.
References
- 1.Roeder R, Sproul M, Turner C. Hydroxyapatite whiskers provide improved mechanical properties in reinforced polymer composites. J Biomed Mater Res Part A. 2003;67(3):801–12. doi: 10.1002/jbm.a.10140. [DOI] [PubMed] [Google Scholar]
- 2.Suchanek W, et al. Processing and mechanical properties of hydroxyapatite reinforced with hydroxyapatite whiskers. Biomaterials. 1996;17(17):1715–23. doi: 10.1016/0142-9612(96)87652-6. [DOI] [PubMed] [Google Scholar]
- 3.Suchanek W, et al. Hydroxyapatite/hydroxyapatite–whisker composites without sintering additives: mechanical properties and microstructural evolution. J Am Ceram Soc. 1997;80(11):2805–13. [Google Scholar]
- 4.Dorozhkin S. Surface reactions of apatite dissolution. J Colloid Interface Sci. 1997;191(2):489–97. doi: 10.1006/jcis.1997.4942. [DOI] [PubMed] [Google Scholar]
- 5.Kwon K, et al. Characterization of the dominant molecular step orientations on hydroxyapatite (100) surfaces. Langmuir. 2009;25(13):7205–8. doi: 10.1021/la900824n. [DOI] [PubMed] [Google Scholar]
- 6.Kwon K, et al. Defect induced asymmetric pit formation on hydroxyapatite. Langmuir. 2008;24(19):11063–6. doi: 10.1021/la801735c. [DOI] [PubMed] [Google Scholar]
- 7.Barroug A, Glimcher M. Hydroxyapatite crystals as a local delivery system for cisplatin: adsorption and release of cisplatin in vitro. J Orthop Res. 2002;20(2):274–80. doi: 10.1016/S0736-0266(01)00105-X. [DOI] [PubMed] [Google Scholar]
- 8.Capriotti L, Beebe T, Jr, Schneider J. Hydroxyapatite surface-induced peptide folding. J Am Chem Soc. 2007;129(16):5281–7. doi: 10.1021/ja070356b. [DOI] [PubMed] [Google Scholar]
- 9.Viswanath B, et al. Mechanical properties of tricalcium phosphate single crystals grown by molten salt synthesis. Acta Biomater. 2008;4(5):1448–54. doi: 10.1016/j.actbio.2008.02.031. [DOI] [PubMed] [Google Scholar]
- 10.Viswanath B, et al. Mechanical properties and anisotropy in hydroxyapatite single crystals. Scr Mater. 2007;57(4):361–4. [Google Scholar]
- 11.Saber-Samandari S, Gross K. Micromechanical properties of single crystal hydroxyapatite by nanoindentation. Acta Biomater. 2009;5:2206–12. doi: 10.1016/j.actbio.2009.02.009. [DOI] [PubMed] [Google Scholar]
- 12.Le Guehennec L, et al. Histomorphometric analysis of the osseointegration of four different implant surfaces in the femoral epiphyses of rabbits. Clin Oral Implant Res. 2008;19(11):1103–10. doi: 10.1111/j.1600-0501.2008.01547.x. [DOI] [PubMed] [Google Scholar]
- 13.de Oliva MA, et al. Treatment with a growth factor–protein mixture inhibits formation of mineralized nodules in osteogenic cell cultures grown on titanium. J Histochem Cytochem. 2009;57(3):265. doi: 10.1369/jhc.2008.952713. [DOI] [PMC free article] [PubMed] [Google Scholar]
- 14.Lamolle SF, et al. The effect of hydrofluoric acid treatment of titanium surface on nanostructural and chemical changes and the growth of MC3T3-E1 cells. Biomaterials. 2009;30(5):736–42. doi: 10.1016/j.biomaterials.2008.10.052. [DOI] [PubMed] [Google Scholar]
- 15.Roufosse A, et al. The hydrothermal crystal growth of chlorapatite. J Cryst Growth. 1973;19(3):211–2. [Google Scholar]
- 16.Boyan BD, et al. Role of material surfaces in regulating bone and cartilage cell response. Biomaterials. 1996;17(2):137–46. doi: 10.1016/0142-9612(96)85758-9. [DOI] [PubMed] [Google Scholar]
- 17.Prener J. The growth and crystallographic properties of calcium fluor and chlorapatite crystals. J Electrochem Soc. 1967;114:77. [Google Scholar]
- 18.Oishi S, Sugiura I. Growth of chlorapatite crystals from a sodium chloride flux. Bull Chem Soc Jpn. 1997;70(10):2483–7. [Google Scholar]
- 19.Teshima K, et al. Environmentally friendly growth of calcium chlorapatite whiskers from a sodium chloride flux. Cryst Growth Des. 2006;6(11):2538–42. [Google Scholar]
- 20.Neira I, et al. An effective morphology control of hydroxyapatite crystals via hydrothermal synthesis. Cryst Growth Des. 2008;9(1):466–74. [Google Scholar]
- 21.Suchanek W, et al. Biocompatible whiskers with controlled morphology and stoichiometry. J Mater Res. 1995;10(3):521–9. [Google Scholar]
- 22.Taç A. Molten salt synthesis of calcium hydroxyapatite whiskers. J Am Ceram Soc. 2001;84(2):295–300. [Google Scholar]
- 23.Brixner L, Babcock K. Inorganic single crystals from reactions in fused salts. Mater Res Bull. 1968;3(10):817–24. [Google Scholar]
- 24.Nacken R. ACerS–NIST phase equilibria diagrams database v 3.0. Zentralbl Mineral Geol Paleontol. 1912:545–59. [Google Scholar]
- 25.Okada S, et al. Control of cellular activity of fibroblasts on size-tuned fibrous hydroxyapatite nanocrystals. Acta Biomater. 2011;7(3):1290–7. doi: 10.1016/j.actbio.2010.10.010. [DOI] [PubMed] [Google Scholar]
- 26.Le Bail A. Whole powder pattern decomposition methods and applications: a retrospection. Powder Diffr. 2005;20:316. [Google Scholar]
- 27.García-Tuñón EDB, Zaragoza G, Franco J, Guitián F. Cl–OH ion-exchanging process in chlorapatite. A deep insight. Acta Crystallogr Sect B. doi: 10.1107/S0108768112019520. (accepted) [DOI] [PubMed] [Google Scholar]
- 28.Saber-Samandari S, Gross K. Effect of angled indentation on mechanical properties. J Eur Ceram Soc. 2009;29(12):2461–7. [Google Scholar]
- 29.Oliver W, Pharr G. Measurement of hardness and elastic modulus by instrumented indentation: advances in understanding and refinements to methodology. J Mater Res. 2004;19(3):3–20. [Google Scholar]
- 30.Teshima K, et al. Well-formed one-dimensional hydroxyapatite crystals grown by an environmentally friendly flux method. Cryst Growth Des. 2009;9(6):2937–40. [Google Scholar]
- 31.Koutsopoulos S. Synthesis and characterization of hydroxyapatite crystals: a review study on the analytical methods. J Biomed Mater Res. 2002;62(4):600–12. doi: 10.1002/jbm.10280. [DOI] [PubMed] [Google Scholar]
- 32.Suzuki T, et al. Experimental study for the Wulff’s relationship of ruby single crystals using contact angles of liquid droplets. J Cryst Growth. 2008;310(7–9):1398–400. [Google Scholar]
- 33.Suzuki T, Oda M. Specific surface free energy and the morphology of synthesized ruby single crystals. J Cryst Growth. 2011;318(1):76–8. [Google Scholar]
- 34.Suzuki T, Kibe T. Specific surface free energy and morphology of chlorapatite crystals studied by modified Wilhelmy method. J Cryst Growth. 2010;312(20):3025–8. [Google Scholar]
- 35.Arends J, Jongebloed W. Ultrastructural studies of synthetic apatite crystals. J Dent Res. 1979;58(2 suppl):837. doi: 10.1177/00220345790580023601. [DOI] [PubMed] [Google Scholar]
- 36.Zhou Y, et al. Single-crystal microtubes of a novel apatite-type compound (Na2.5Bi2.5)(PO4)3(F, OH), with well-faceted hexagonal cross sections. CrystEngComm. 2009;11:1863–7. [Google Scholar]
- 37.Daculsi G, LeGeros R, Mitre D. Crystal dissolution of biological and ceramic apatites. Calcif Tiss Int. 1989;45(2):95–103. doi: 10.1007/BF02561408. [DOI] [PubMed] [Google Scholar]
- 38.Jongebloed W, Van Den Berg P, Arends J. The dissolution of single crystals of hydroxyapatite in citric and lactic acids. Calcif Tiss Int. 1974;15(1):1–9. doi: 10.1007/BF02059038. [DOI] [PubMed] [Google Scholar]
- 39.Tseng W, et al. Directional/acidic dissolution kinetics of (OH, F, Cl)-bearing apatite. J Biomed Mater Res Part A. 2006;76(4):753–64. doi: 10.1002/jbm.a.30589. [DOI] [PubMed] [Google Scholar]
- 40.Clark P, et al. Cell guidance by ultrafine topography in vitro. J Cell Sci. 1991;99:73–7. doi: 10.1242/jcs.99.1.73. [DOI] [PubMed] [Google Scholar]
- 41.Simmons G, Wang H. Single crystal elastic constants and calculated aggregate properties: a handbook. Cambridge: MIT Press; 1971. [Google Scholar]
- 42.Mitchell BS. An introduction to materials engineering and science for chemical and materials engineers. John Wiley & Sons, Inc; [Google Scholar]
- 43.Pharr G. Measurement of mechanical properties by ultra-low load indentation. Mater Sci Eng A. 1998;253(1–2):151–9. [Google Scholar]


