

Abstract
Endovascular aneurysm repair (Greenhalgh, Brown et al.) techniques have revolutionized the treatment of thoracic and abdominal aortic aneurysm disease, greatly reducing the perioperative mortality and morbidity associated with open surgical repair techniques. However, EVAR is not free of important complications such as late device migration, endoleak formation and fracture of device components that may result in adverse events such as aneurysm enlargement, need for long-term imaging surveillance and secondary interventions or even death. These complications result from the device inability to withstand the hemodynamics of blood flow and to keep its originally intended post-operative position over time. Understanding the in vivo biomechanical working environment experienced by endografts is a critical factor in improving their long-term performance. To date, no study has investigated the mechanics of contact between device and aorta in a three-dimensional setting. In this work, we developed a comprehensive Computational Solid Mechanics and Computational Fluid Dynamics framework to investigate the mechanics of endograft positional stability. The main building blocks of this framework are: i) Three-dimensional non-planar aortic and stent-graft geometrical models, ii) Realistic multi-material constitutive laws for aorta, stent, and graft, iii) Physiological values for blood flow and pressure and iv) Frictional model to describe the contact between the endograft and the aorta. We introduce a new metric for numerical quantification of the positional stability of the endograft. Lastly, in the results section, we test the framework by investigating the impact of several factors that are clinically known to affect endograft stability.
Keywords: stent-graft, migration, aneurysm, friction, CSM, CFD, fixation
1. Introduction
The prevalence of abdominal aortic aneurysms (AAA) has increased 300% over the last few decades. Currently, AAA disease affects 5–7% of Americans over age 60 and the number of AAAs is expected to increase in the future as the population ages (Gillum 1995; Fleming, Whitlock et al. 2005). Similarly, the prevalence of thoracic aortic aneurysms (TAA) and dissection has increased by 60% in the last 25 years alone (Olsson, Thelin et al. 2006).
Endovascular repair (Greenhalgh, Brown et al.) techniques have revolutionized the treatment of AAA, TAA and dissection disease, greatly reducing the perioperative mortality and morbidity associated with open surgical repair (Brewster, Cronenwett et al. 2003) (Leurs, Bell et al. 2004). These techniques have experienced rapid development and widespread acceptance, and have become the primary treatment for AAA, TAA and dissections in both the United States and Europe. Initially indicated primarily for older subjects who could not tolerate invasive open repair, EVAR is now used to treat a broad range of patients and aneurysm morphologies. This has been possible due to the evolution in design and fixation characteristics of endografts through the years. Currently, there are six FDA-approved endografts for AAA repair and three devices for TAA repair. These devices are very different in design (modular versus unibody), materials (Dacron versus PTFE; nitinol versus stainless steel or cobalt-chromium), deployment mechanisms (balloon-expanded versus self-expanding) and fixation mechanisms (radial force, hooks and barbs).
Despite the significantly reduced associated morbidity and mortality, EVAR is not free of important complications such as late device migration, endoleak formation and fracture of device components that may result in complications such as aneurysm enlargement, long-term imaging surveillance, secondary interventions, or even death. These complications result from the device inability to withstand the hemodynamics of blood flow and keep its originally intended position over time. Recent data from the DREAM and EVAR randomized clinical trials show that the rate of complications after a minimum follow-up of seven years is higher in patients treated with EVAR than in those treated with open surgery (De Bruin, Baas et al. 2010; Greenhalgh, Brown et al. 2010).
There have been numerous clinical investigations of anatomical factors affecting device migration such as aortic neck diameter, length and angulation (Fulton, Farber et al. 2006; Sampaio, Panneton et al. 2006; Hobo, Kievit et al. 2007), neck calcification and thrombus, inadequate proximal and distal fixation lengths (Zarins 2003) (Heikkinen, Alsac et al. 2006), and aneurysm tortuosity (Sternbergh, Carter et al. 2002). In general, it has been found that longer, disease free aortic necks are associated with lower endoleak and migration rates. Conversely, short, calcified, tortuous necks are associated with higher complication rates. In addition to the aforementioned clinical studies, experimental in vitro, in vivo and cadaveric studies have investigated the forces required to dislodge the endograft from the aortic wall (Malina, Lindblad et al. 1998; Resch, Malina et al. 2000; Arko, Heikkinen et al. 2005; Murphy, Johnson et al. 2007). However, all these experiments considered unrealistic planar configurations for the aorta and the endograft, due in part to the difficulties in reproducing anatomically and physiologically realistic conditions in the experimental set-up.
Several analytical, computational fluid dynamics (CFD) and computational solid mechanics (CSM) studies have been used to investigate the dynamics of endografts. CFD and analytical studies have described the magnitude of the loads experienced by the endograft due to the pulsatile actions of blood flow (Li and Kleinstreuer 2005); (Morris, Delassus et al. 2004; Figueroa, Taylor et al. 2009; Figueroa, Taylor et al. 2009). However, all of these studies have assumed a perfect apposition of the device in the fixation zones and have neglected the complex contact interactions between the aortic wall and the endograft. Recent CSM studies have investigated the coefficient of friction for self-expanding endografts using optimization techniques (Vad, Eskinazi et al. 2010). To date, with the exception of simple studies in a one-dimensional setting (Amblard, Berre et al. 2009), no investigation has described the complex contact mechanics between the aortic wall and the endograft subjected to realistic hemodynamic loads in a three-dimensional setting.
In this work, we developed a comprehensive CSM-CFD framework to investigate the mechanics of endograft stability. The framework is then applied to examine the impact of several factors that are clinically known to affect endograft stability, namely: fixation length, aortic curvature, friction coefficient between aorta and device, and degree of oversizing. The main building blocks of this framework are: i) Three dimensional non-planar aortic and stent-graft geometrical models, ii) Realistic multi-material constitutive laws for aorta, stent, and graft, iii) Physiological values for blood flow and pressure and iv) Frictional model to describe the contact between the endograft and the aorta. The majority of the CSM computations were performed using Abaqus/Explicit v. 6.8 (SIMULIA, Providence RI, USA). For the CFD part of the analysis, we used the in-house stabilized finite element flow solver SimVascular ((Figueroa, 2006 #45), (2007)).
2. Methods
2.1. Geometry and constitutive models
2.1.1. Endograft
Geometry
Aortic endografts consist of a tubular metal scaffold (stent) attached to a fabric (Leurs, Bell et al.). Endografts are deployed within the aorta using a fluoroscopy-guided catheter. Once deployed, the endograft forms a new conduit for the blood, effectively excluding the weakened aneurysm wall from the direct actions of blood flow and pressure. The function of the stent is to provide the device with structural support in both longitudinal and radial directions. Radial stiffness is of particular importance since it is a determining factor of the radial force exerted by the device against the arterial wall after deployment. Abdominal endografts are usually modular bifurcated devices, whereas all thoracic endografts have tubular unibody designs. In this paper we considered an abdominal endograft with a generic tubular unibody design consisting of several Z-shaped stents tightly sewed to the inner surface of the graft. We furthermore assumed that there are no hooks or barbs in the device: This assumption simplifies the analysis of contact since no damage models (Chaboche 1988; Humphrey 2003; Calvo, Pena et al. 2007) need to be considered to describe the action of the penetrating hooks in the intima.
Figure 1 depicts the adopted computer-aided design process of stent assembly: A planar base strut (characterized by dimensions W and H) is wrapped around into a ring unit. Several ring units are then longitudinally arranged to form the stent assembly. This process can be easily customized to reproduce different strut patterns. In this study, we adopted a base strut of cross-sectional diameter d=0.3 mm, total width W=8.7 mm, and crown-to-crown length H=16.3 mm. This produces a stent ring of 22 mm outer diameter. The stent assembly was meshed with 8-noded solid hexahedral elements (C3D8R) using the general purpose finite element package Abaqus (Simulia, Providence RI, USA). The reduced-integration C3D8R elements provide a good balance between accuracy and efficiency in stent modeling. Other suitable options include the more expensive solid element C3D8RI which captures well the bending response of the stent or the less expensive one-dimensional beam element typically used to model braided stents. The graft was modeled as thin shell of thickness 0.05 mm and discretized using triangular shell element (S3). The methodology to virtually “suture” the Z-stents to the graft is described in section 2.2.
Figure 1.
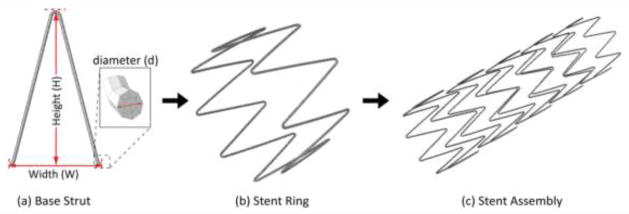
Components of stent design showing (a) planar base strut, (b) cylindrical stent ring and (c) stent assembly.
Constitutive models
Nitinol (nickel-titanium alloy) is the most popular material of choice for modern aortic stents due to its unique shape-memory and super-elastic mechanical properties (Stoeckel, Pelton et al. 2004). Other material choices for the stent include stainless steel and cobalt-chromium alloys. As for the graft, Dacron and Expanded Polytetrafluoroethylene (ePTFE) are equally utilized (Kannan, Salacinski et al. 2005; Roll, Müller-Nordhorn et al. 2008). Both materials can be reasonably characterized using a linear-elastic constitutive model. For this study we adopted nitinol and ePTFE materials for the stent and graft, respectively. Typical numerical values for the parameters of each material were gathered from the literature (Kleinstreuer, Li et al. 2008) and summarized in Table 1. The super-elastic response of nitinol was implemented in ABAQUS using the built-in user material subroutine nitinol VUMAT.
Table 1.
Stent-graft material properties for the nitinol (top) and ePTFE (bottom) components.
|
Stent: Superelastic nitinol
| |
| Austenite elasticity EA (Sampaio, Panneton et al.) | 51,700 |
| Austenite Poisson’s ratio νA | 0.3 |
| Martensite elasticity EM (Sampaio, Panneton et al.) | 47,800 |
| Martensite Poisson’s ratio νM | 0.3 |
| Transformation strain εL | 0.063 |
| Loading ∂σ/∂TL | 652.7 |
| Start of transformation loading (Sampaio, Panneton et al.) | 600 |
| End of transformation loading (Sampaio, Panneton et al.) | 670 |
| Reference temperature T0 (°C) | 37 |
| Unloading (∂σ/∂T)U | 652.7 |
| Start of transformation unloading (Sampaio, Panneton et al.) | 288 |
| End of transformation unloading (Sampaio, Panneton et al.) | 254 |
| Start of transformation stress in compression (Sampaio, Panneton et al.) | 900 |
| Volumetric transformation strain | 0.063 |
| Strain limit εmax | 12% |
| Af temperature (°C) | 20 |
|
| |
| Graft: Expanded Polytetrafluoroethylene (ePTFE) | |
|
| |
| Young’s Modulus EG(Sampaio, Panneton et al.) | 55.2 |
| Poisson’s ratio νG | 0.46 |
2.1.2. Aorta
The geometry and mechanical properties of the abdominal aorta play important roles on the positional stability of EVAR. For instance, certain anatomical features such as short aortic neck length and large neck angulation are known to have a negative impact on long-term durability of the endograft ((Zarins, 2003 #8; Hobo, 2007 #6),(Fulton, Farber et al. 2006),(Zarins 2003)). Likewise, biomechanical properties such as stiffness, aortic wall pre-stresses and roughness of the intimal layer must be carefully considered when modeling the contact between device and aorta ((Gee, 2010 #9),(Humphrey and Taylor 2008)). All these factors are incorporated in our framework as described below.
Geometry
The left panels of Figure 2 show anterior and lateral views of the baseline aortic model used in this study. The model represents an idealized 55 mm AAA and includes the main branch vessels in the abdominal region such as the celiac trunk, superior mesenteric artery (SMA), renal arteries, and external and internal iliacs. The aortic neck is a straight segment of 20 mm in diameter and 22 mm in length. This idealized geometry was adopted instead of a subject-specific aortic model because it can be easily modified to study the impact of anatomical features such as fixation length and neck angulation. The right panels of Figure 2 depict two alterations of the baseline model: a “short neck” model featuring a 5 mm-long aortic neck and a “higher curvature” model with neck angle α = 16°. While all vessel dimensions and angles are realistic, the simpler, symmetrical geometry facilitates the endograft deployment process and the interpretation of the results. The models were discretized using triangular shell elements (S3). We considered a nominal uniform thickness of 1.5 mm as reported in literature (Raghavan 2000; Raghavan, Kratzberg et al. 2006).
Figure 2.
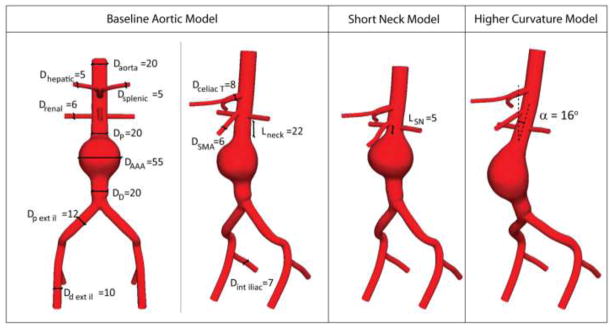
Left: Anterior and lateral views of the idealized baseline aortic model labeled including dimensions (in mm). Right: Short neck and higher curvature models adopted for the study of neck fixation length and neck angulation.
Mechanical Properties
The mechanical behavior of the diseased abdominal aorta is greatly heterogeneous due to the complex remodeling experienced by the aortic wall in the aneurysm region. Recently, Vorp, Humphrey & colleagues (Ferruzzi, Vorp et al. 2011) obtained excellent fit of biaxial data on the mechanical behavior of human abdominal aortic and abdominal aortic aneurysm samples reported by Vande Geest et al (Vande Geest, Sacks et al. 2004; Vande Geest, Sacks et al. 2006) using a constrained mixture model of an elastin-dominated amorphous matrix and four families of locally parallel collagen fibers.
In this study, however, we were motivated by the need to capture the stiffness behavior of the aortic neck in order to adequately represent the contact between the oversized device and the aortic wall. With this goal in mind, we adopted a simpler approach assuming a relatively healthy aortic neck and used an isotropic hyperelastic material response fit to uniaxial test data obtained by (Raghavan, Webster et al. 1996). Several strain energy potential models are available in Abaqus (Aruda-Boyce, Marlow, Neo-Hookean, Ogden, and others) to fit the aforementioned experimental data. In general, the functional form of these models is given as the sum of a deviatoric and a volumetric component, viz.
| (1) |
where Udev and Uvol are the deviatoric and volumetric parts of strain energy function, respectively, Ī1 and Ī2 are the first and second invariants of the deviatoric strain tensor, and Jel is the elastic volume ratio, which for thermally independent materials is equal to the volume ratio J. We adopted the simple Marlow form (Marlow 2003), (Martins, Jorge et al. 2006) in which the deviatoric part Udev is assumed to be dependent only on the first invariant Ī1. Hence Udev is defined directly by providing the test data, thus eliminating a curve-fitting procedure and therefore the need for material coefficients unlike in other models. The volumetric part Uvol on the other hand is specified by providing volumetric test data, the Poisson’s ratio, or the lateral strains. Here we have used uniaxial test data to define the deviatoric part (Raghavan, Webster et al. 1996) (see Figure 3) and a Poisson’s ratio of 0.48 to define the volumetric part. It is important to mention here that more detailed experimental test data and strain energy density functions (e.g., Ogden and Van der Waals) (Raghavan and Vorp 2000) may be required to model a more complex aortic wall response, especially for prediction of rupture potential. The simplified Marlow model employed here based on uniaxial test data can model aortic response exactly in uniaxial deformation mode and it was readily available in Abaqus.
Figure 3.
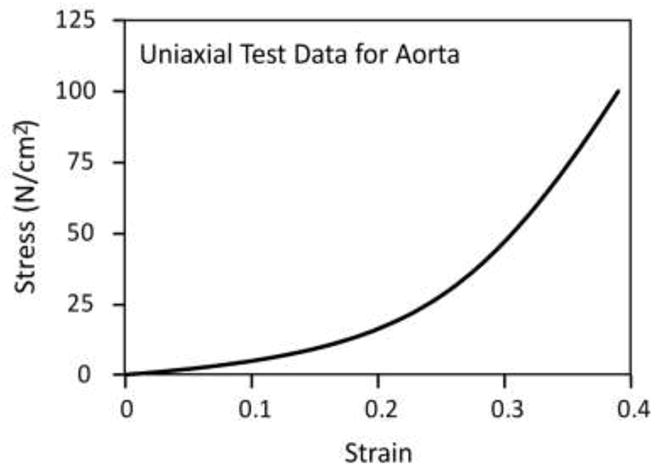
Tensile strain-stress relationship for the aortic wall tissue based on uniaxial test data (Raghavan, Webster et al. 1996).
Aortic Pre-stress
In line with patient-specific modeling where the aortic geometry is obtained from medical imaging data, we assumed that the models of Figure 2 represent a deformed spatial configuration Ωt stressed by in vivo loading conditions corresponding to mean arterial pressure (MAP). It is therefore critical to include the aortic pre-stress associated with the given spatial configuration under the known MAP loading. The importance of including pre-stress and pre-strain in the aortic structure has been recently highlighted in the literature (Speelman, Bosboom et al. 2009),(Gee, Förster et al. 2010). Indeed, the aortic pre-stress fundamentally affects the stiffness response of the aortic neck, a critical factor in determining the contact pressure between the device and the wall.
Defining a pre-stress and pre-strain state is a complex process for which uniqueness of solutions is not guaranteed for the case of finite deformations and large strains considered here. Previous modeling efforts have been based on Inverse Design approaches (Govindjee and Mihalic 1998), (Gee, Förster et al. 2010), Updated Lagrangian formulations (Speelman, Bosboom et al. 2009), (Gee, Förster et al. 2010), and backward deformation field methods (Raghavan, Ma et al. 2006). Here, considering that the emphasis of this study lies elsewhere, but recognizing the importance of including the pre-stress state in the analysis, we adopted a simpler approach to estimate this state: We assumed that under reasonably small load and unload increments ΔP=MAP/n, where n is a chosen number of increments, the nonlinear hyperelastic material response can be approximated as linear. A material configuration Ω0 can then be obtained by unloading the deformed spatial configuration Ωt in n increments. Then, we incrementally load the configuration Ω0 to define the pre-stress state at the spatial configuration Ωt. The unloading and loading stages of this approach are outlined next:
Incremental Unloading
Initialize

x

i


 ∈ Ω


i


 ≡ Ω


i


for

i=n, 0, −1

     Pressurize configuration

x

i


 ∈ Ω


i


 with Δ

p =

 MAP/

n

 to obtain
Obtain displacement field
, define a configuration

x

i


−1

 ∈ Ω


i


−1

 where
 Ω


i


 ← Ω


i


-1

.
endfor
Intermediate configurations Ωn−1, …, Ω1 are obtained during the analysis; Ω0 is obtained at the end of the process. Both Ω0 and the intermediate configurations are used in an incremental forward analysis whose aim is to transfer pre-stresses to the spatial configuration Ωt such that when subject to MAP no additional deformation is obtained. The steps of the analysis are outlined below.
Incremental Forward Loading
Initialize

x

i


 ∈ Ω


i


 ≡ Ω

0

,

p

i


 = 0, stress

σ

i


 = 0
for

i=0, n, 1

    Pressurize configuration

x

i


 ∈ Ω


i


 with

p

i


+1

 =

p

i


 + Δ

p

 to obtain

σ

i


+1

    Transfer

σ

i


+1

 to

x

i


+1

 ∈ Ω


i


+1

 obtained in the incremental unloading stage
Ω


i


 ← Ω


i


+1

, σ


i


 ← σ


i


+1

endfor
The final pre-stress state σn corresponds to a load p = MAP acting on the final spatial configuration Ωn = Ωt. The left panel of Figure 4 shows the deformed spatial and unloaded material configurations Ωt and Ω0. The right panel shows the pre-stress acting on the spatial configuration and in equilibrium with the MAP.
Figure 4.
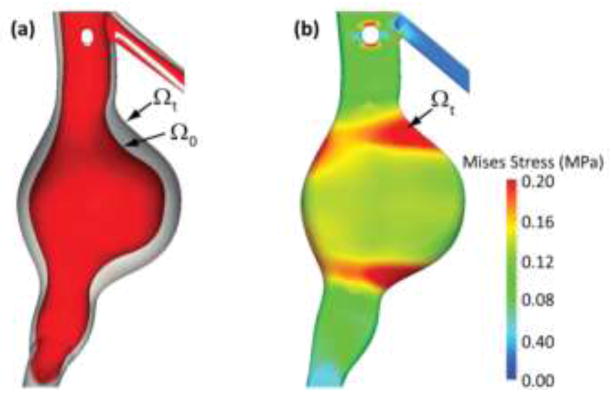
(a) Deformed spatial configuration Ωt and unloaded material configuration Ω0 obtained via incremental inverse stress analysis. (b) Pre-stress in deformed spatial configuration Ωt under mean blood pressure.
The algorithm presented here is similar to that introduced by Raghavan in that it considers forward and backward loading of the structure to obtain the unloaded material configuration. However, in Raghavan’s work, changes in the shape are considered to be independent for the loading increment, and a minimization approach is adopted to obtain an optimal scaling parameter for the displacement field that maps the unloaded configuration to the in-vivo configuration in one single loading increment.
2.2. Endograft deployment
Once geometry and constitutive laws are defined, we deal with the task of deploying the stent-graft within the aortic aneurysm model. In a clinical setting, the device is fully crimped and mounted in a delivery system that is advanced to the aneurysm region using fluoroscopy-guided catheters. After careful positioning at the proximal landing zone, the catheter is gradually pulled back and the device is released. The deployed device remains fixed to the aortic wall by virtue of the radial force resulting from oversizing and potentially by the clamping action of hooks and barbs penetrating the intima. In the present study, we focused exclusively on the mechanics of radial force. This radial force is affected by device parameters (stent design, material) and deployed environment (the degree of oversizing, the stiffness of the aortic neck, the blood pressure). Simulating the actual endograft deployment is beyond the scope of this work as we are mainly interested in the deployed configuration. Therefore, here we adopted a simpler approach whereby the three materials (stent, graft, and aortic wall) are bent, crimped, loaded and unloaded to define the deployed configuration of the stent-graft (see top panels of Figure 5) using sequential activation of contact between the different components. We describe the specific steps of the deployment process next.
Figure 5.

Schematic representation of components and steps of the deployment of the endograft within the aortic model. (a) Initial spatial configuration of pre-stressed aortic model under mean aortic pressure MAP, unloaded stent, and bent graft following the main curvature of the abdominal aorta. No contact is activated at this time. (b) The stent is crimped, bent, and expanded until contact is established with the graft. At this point, the junctions between stent and graft are enforced by tied contact constraints. (c) The proximal and distal landing zones are expanded via an incremental pressure P to make room for the stent-graft. (d) The incremental pressure P is released and contact between the aortic wall and stent-graft is established. The aneurysm wall contracts slightly in the sac region since it is no longer loaded by the MAP.
We start with the pre-stressed aortic wall under a mean blood pressure MAP = 108 mmHg, the straight stent assembly, and the graft bent following the main curvature of the abdominal aorta, see Figure 5(a). We assumed that the stent is the only contributor to the radial strength of the device. This radial strength is achieved via oversizing the stent diameter (Ds=22 mm) relative to the aortic neck diameter (Dp=20 mm). We considered an oversizing of 10%, which is within the recommended oversizing range in the instructions for use (IFUs) of various manufacturers. The graft membrane has very low bending stiffness due to its minimal thickness and low modulus. Its function is simply to hold the stent assembly together and to provide a conduit for blood flow. The stent and graft are initially not in contact. The stent is bent following the curvature of the graft and crimped slightly to lie just inside of the graft. The stent crimping and bending is done via displacement boundary constraints obtained beforehand in a separate Abaqus/Standard analysis using the rigid surface subroutine RSURFU. Then, contact between the inner surface of the graft and the outer surface of stent is activated using tied-like constraints, see Figure 5(b). Next, the proximal and distal aortic landing zones in the aortic model are expanded using an incremental pressure ΔP = 190 mmHg to make room for the oversized device. At this point, contact is activated between the stent-graft and the aortic wall, the displacement boundary constraint on the stent is removed and the incremental pressure ΔP is gradually released, see Figure 5(c). Finally, the mean blood pressure is transferred from the aortic sac to the inner surface of the stent-graft since this is now the new conduit for blood flow, see Figure 5(d). The aneurysm wall contracts slightly in the sac region since it is no longer loaded by the MAP.
2.3. CSM analysis
Explicit solution strategy
We used ABAQUS/Explicit v6.8 for the CSM analysis given the complex three-body contact interactions, the non-linearity of the material response, and the large deformations experienced by the aorta and the device. Here, the governing dynamic equilibrium is solved explicitly through time using a central difference scheme. The explicit scheme provides better handling of complex contact interactions and efficient use of system resources. However, the solution is conditionally stable and requires a small step size. We have used a mass scaling technique (Prior 1994; Hughes 2000) to increase the minimum stable time increment, thus speeding up the solution process. In order to obtain a numerically and physically meaningful solution in this explicit approach, it is important that the ratio of the kinetic energy of the system (ALLKE) to the total internal energy (ALLIE) is smaller than 10%. Otherwise, inertia forces will dominate and a true quasi-static solution will not be achieved. The ratios of ALLKE/ALLIE at the end of the simulation for the baseline, short neck, and high curvature models were 6.2%, 3.8%, and 8.6% respectively.
Analysis and post-processing
Dynamic equilibrium in the deployed endograft was reached after approximately 150,000 time steps, using a time step size of 3×10⁻⁵ sec. This translated to 5 hours of analysis time on 28 cpu-cores (Intel Harpertown), i.e. 140 hours of CPU time. Post processing of the numerical results was performed using ParaView, an open-source data analysis and visualization application (Ahrens, Geveci et al. 2005).
Mesh Parameters
The aortic wall and the graft were discretized using triangular shell elements (S3) while the stent assembly was discretized using solid brick element (C3D8R) with 10 elements on the cross-sectional area of the strut. Table 2 shows the number of elements of the finite element mesh in the different components of the baseline, short neck, and high curvature model.
Table 2.
Number of elements of the finite element mesh in the different components of the baseline, short neck, and high curvature models
| Component | Element Type | Number of Elements | ||
|---|---|---|---|---|
| Baseline | Short-Neck | High curvature | ||
| Aorta | S3 | 134,200 | 126,930 | 144,670 |
| Graft | S3 | 135,700 | 117,300 | 82,000 |
| Stent | C3D8R | 27,840 | 22,272 | 27,840 |
2.4. Iterative exchange of geometry and loads between CSM and CFD computations
Once the stent-graft is deployed under the MAP hydrostatic loading conditions, we must create a finite element mesh for the fluid domain within the stented aortic model. This task involves generating a triangulated surface mesh from the mixed triangular and quadrilateral mesh of the solid domain given by the inner surfaces of the stented aortic model. Figure 6 illustrates this process: Panel (a) depicts the mixed (triangular and quadrilateral) graft and stent surface elements mesh corresponding to the inner surface of the stented aortic model. Panel (b) shows the corresponding triangulation of the solid mesh shown in panel (a). This surface triangulation defines the boundary mesh for the fluid domain. This strategy seeks to maintain the largest node-to-node compatibility between the fluid and the solid meshes in order to facilitate the exchange of loads between the CSM and the CFD modules of the framework. Panel (c) shows the volumetric linear tetrahedral mesh of the fluid domain. The volumetric mesh was created from the triangulated surface mesh in Panel (b) using in-house software and the mesh generator MeshSim™. Typical fluid domain meshes for the baseline, short neck, and high curvature models ranged between 2 and 3 million linear tetrahedral elements.
Figure 6.
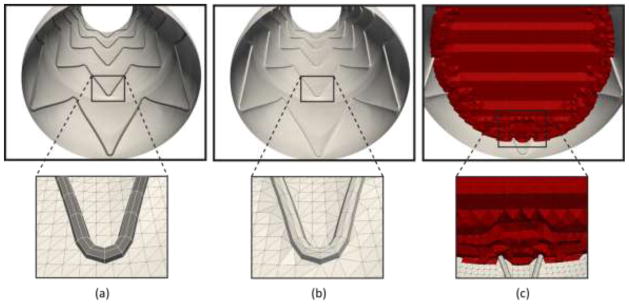
(a) mixed (triangular and quadrilateral) mesh of the solid domain. (b) Triangulated surface mesh of the fluid domain. (c) Volumetric mesh of the fluid domain.
The geometry and mesh of the deployed endograft were obtained under hydrostatic conditions. It is thus important to study the configuration and the contact between the device and the aortic wall under hydrodynamic conditions. We next perform a CFD analysis where typical suprarenal aortic flow is driven through the stented model to provide a new distribution of tractions acting on the surface of the device. These tractions consist of a normal component (pressure) featuring a gradient through the length of the graft, and a tangential component (wall shear stress) linked to the blood viscosity and the flow rate. The interactions between hemodynamics, stent-graft mechanics and device-vessel wall contact are extremely complex and time-dependent. In the most general setting, one should evaluate a dynamic fluid-structure-contact interaction problem where the configuration of the stent-graft, the hemodynamic loads, and the quality of contact between device and aortic tissue change dynamically throughout the cardiac cycle. This problem is therefore extremely coupled and currently computationally intractable. In this paper, we adopted a sequential fluid and structural coupling approach whereby geometries and loads are exchanged iteratively between the CFD and CSM modules. The CFD module is run using a fixed geometric configuration that produces a new set of tractions that is then passed on to the CSM module that evaluates the new geometric configuration and the quality of contact at the device-aortic wall interface. This iterative exchange of information is sketched in Figure 7.
Figure 7.

Sequential coupling strategy between the solid mechanics and fluid mechanics components of the framework: The CSM provides the equilibrium configuration of the deployed endograft subjected to certain hemodynamic loads. This equilibrium configuration is passed to the CFD module, where a new computation of the loads acting on the fixed CSM geometry is performed. The CSM module shows the Von Mises stress on the wall, including the concentration of stresses in the landing zone of the endograft, whereas the CFD module shows a volume render of blood velocity, pressure, and wall shear stress.
Lastly, for the sake of computational simplicity, the tractions transferred between CSM and CFD modules are the time average of the hemodynamic tractions acting on the endograft over the cardiac cycle. We are therefore not including the dynamic loading ranging between peak systole and low diastole and use a mean traction instead. We describe the details of the CFD analysis next.
2.5. CFD analysis
The Navier-Stokes equations enforcing balance of linear momentum and mass were solved for the flow of an incompressible Newtonian fluid within the domain defined by the deployed endograft. We used a stabilized finite element formulation implemented in the open-source code SimVascular (Figueroa, Vignon-Clementel et al. 2006, 2007). Blood density was ρ = 1.060 kg/m3 and blood viscosity was μblood = 0.04 P. The simulation time step size was 0.001 sec, and the typical finite element size for all models was in the range of 2 to 3 million linear tetrahedral elements. We considered a typical supra-celiac aortic flow waveform with a mean volumetric rate of 3 liters/minute. A coupled-multidomain formulation (Vignon-Clementel, Figueroa et al. 2010) was used to link Windkessel lumped-parameter models at each outlet to represent the flow and pressure demands of the distal vascular beds. Numerical values for the lumped-parameter coefficients (i.e., proximal resistance Rp, capacitance C, and distal resistance Rd) are given in Table 2. Using these parameters we obtained a physiologically realistic pressure waveform in the center of abdominal aortic aneurysm ranging between 137 mmHg at peak systole and 82 mmHg during low diastole, with an average MAP of 108 mmHg. This matches the pressure previously utilized for the loading of the endograft under hydrostatic conditions.
We assumed identical inflow and outflow boundary conditions for all the models in this paper. Furthermore, as explained earlier, for each simulation we calculated the time average of the total traction (sum of the blood pressure and wall shear stress) acting on the surface of the endograft. We utilized this time average traction as the relevant hemodyamic load acting on the device for the positional stability analysis.
2.6. Contact model and Instability Index
We next describe the contact algorithms used to characterize the two different types of contact we considered in our analysis: namely, the interactions between device and aortic wall, and also the interactions between the stent and the graft. At the end of the section we provide some details on the specific implementation of the contact models within Abaqus.
Device-aorta contact
A hard contact model (Wriggers 1995; Wriggers 1996) was used to characterize the normal contact between the aorta and the stent-graft while a basic Coulomb frictional model was used to account for the tangential contact interactions. The hard contact model defines a contact pressure (PC) as a function of the interpenetration distance or overclosure (h) (Simulia; Wriggers 1996):
| (2) |
| (3) |
The basic Coulomb friction model is based on the classical law of dry friction namely the Coulomb frictional model (Johnson 1987; Hutchings 1992) which gives the following relationship between tangential stress and contact pressure:
| (4) |
| (5) |
where and τ1 and τ2 are the two components of the tangential contact stress and μ is a macroscopic property describing the degree of roughness between the surfaces in contact, e.g., the coefficient of friction. The value of μ for the aorta-endograft contact depends on several factors such as the material of the endograft, degree of device oversizing, and the disease state of the aortic wall (i.e., atherosclerotic plaques, calcifications, etc.). Experimentally-derived values for μ range between 0.08 and 0.46 (Vad, Eskinazi et al. 2010). Here, we have adopted a value of μ = 0.30. In order to characterize the quality of the contact between device and aortic wall, we define the following Instability Index (II) as the ratio
| (6) |
This ratio provides a normalized and intuitive metric to characterize the quality of contact: an increasing value of II indicates a greater degree of positional instability in the device. In the limit, if II = 1, slippage will occur. It is important to note that the frictional contact model used here is suitable for static contact interactions and an impervious graft. To model a more porous graft where contact is lubricated, a reduced coefficient of friction should be considered. Furthermore, to model dynamic friction events such as those occurring during the cardiac cycle, a general form of the Coulomb frictional model (Oden and Martins 1985) or a fluid-structure interaction approach should be employed.
Stent-Graft contact
The geometry of the stent-graft is obtained via the series deployment steps described in Section 2.2. When the contact between stent and graft is established, we considered that the stent is tightly sutured to the graft with minimum relative sliding. This response is modeled using no separation constraints in the normal direction and a rough frictional model in the tangential direction. The rough frictional model is basically a Coulomb frictional model with μ = ∞ and it thus prevents tangential slippage regardless of the contact pressure.
Contact implementation
We have used the penalty constraint contact algorithm in Abaqus. This algorithm considers a pure master-slave contact pair to implement the different contact models of our analysis (Simulia). Here, a contact force is applied to the slave surface as a function of the interpenetration distance h, whereas an equal and opposite force is applied to the master surface at the penetration point. A penalty stiffness kp relating the contact force to the interpenetration distance is automatically chosen to minimize the burden on the explicit time stepping algorithm. Compared to other methods, the penalty constraint contact algorithm results in a weaker enforcement of hard contact, although the method can handle different types of contact (i.e., hard, Coulomb, rough, etc.) and is better suited to model contact involving shell structures.
3. Results
In this section we apply the CSM-CFD framework to investigate the mechanics of endograft stability considering a range of endograft sizes (length and degree of oversizing) and the different aortic models presented in Figure 2. The baseline model has long proximal and distal fixation zones and low curvature, and it reflects an ideal geometry for EVAR. The results corresponding to this model are presented in Section 3.1. Next, we investigate and compare the impact of several factors clinically known to affect endograft stability: namely, fixation length, aortic curvature, friction between device and aorta, and endograft oversizing (Albertini, Kalliafas et al. 2000). The impact of fixation length is investigated in Section 3.2 using the short neck model of Figure 2. The impact of aortic curvature is investigated in Section 3.3 using the higher-curvature model of Figure 2. The assembly of the stent-graft in the short-neck and higher-curvature cases was slightly modified compared to the baseline confirmation (i.e., the length of the device was adjusted to fit the AAA section), but similar meshing and identical device oversizing were considered. In Section 3.4 we investigate the impact on device stability of different friction coefficients between device and aortic wall. Two different values of aorta-endograft friction coefficient were used (μ =0.05 and μ =0.75) and results are compared with the baseline case (μ =0.30). The device geometry and degree of oversizing are identical to the baseline model. Finally, in Section 3.5 we investigate the impact of oversizing on endograft stability by comparing the performance of a 10% oversized device (baseline case) with that of a 15% oversized device. It is important to note that the hemodynamic conditions remained unchanged in all cases.
3.1. Endograft stability analysis – Baseline model
In the example presented here, we considered an endograft consisting of 5 nitinol stent units, with a total length of 90 mm, oversized by 10%, and with a friction coefficient with the aortic wall of μ =0.30. The left panel of Figure 8 illustrates the complex nature of the contact between aorta and endograft: the plots show the two components of the contact stresses at the proximal landing zone, namely the contact pressure Pc and the contact shear: τeq. The color maps are defined on the areas where the contact pressure is larger than zero: this explains the patchy nature of the plots. From these two fields, the instability index II is calculated according to equation (6) and plotted. The distribution of maximum contact pressure follows the pattern of the struts as expected due to the concentrated radial force generated by these. The distribution of instability index presents heterogeneous patterns in the space between struts.
Figure 8.
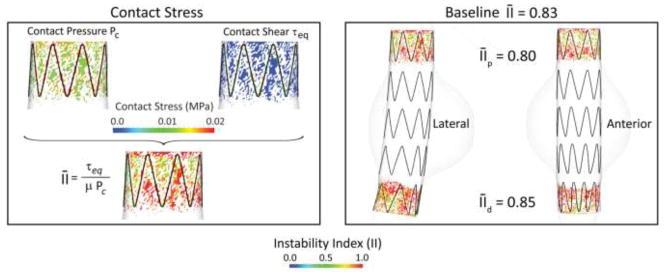
Left: Plot of contact pressure Pc, contact shear: τeq, and instability index II at proximal the proximal fixation zone for the baseline endograft. Left: Plot of instability index for the Baseline model in lateral and anterior views.
The right panel of Figure 8 shows the distribution of instability index II in the proximal and distal fixation zones of the device, and in lateral and anterior views. An average instability index was calculated by integrating the spatial distribution of the instability index field in areas with positive contact pressure. The average instability index of the device is 0.83. The proximal section shows an average instability index of while the distal section has an average instability index of , indicating that the quality of fixation is superior in the proximal part of the device. This can perhaps be explained by the higher curvature in the distal landing zone of the endograft: indeed, the proximal fixation zone shows a more homogeneous spacing of the struts in the anterior and lateral views, whereas the distal fixation zone shows more densely packed struts in the anterior part of the device. This heterogeneous circumferential distribution of the struts may negatively affect stability.
3.2. Impact of fixation length on endograft stability
In this example, we utilized an 11 % shorter device (80 mm long) to accommodate the smaller proximal landing zone of only 5 mm compared with the 22 mm of the baseline model. The device consists of 4 nitinol stent units, is oversized by 10%, and has a friction coefficient with the aorta of μ=0.30. Figure 9 depicts the average instability index in the proximal and distal fixation zones for the baseline (left) and the short-neck (right) models. The shorter fixation length results in a higher concentration of stresses and significantly larger instability index (0.94 vs 0.80, 18% larger) at the proximal fixation. The instability index is therefore dangerously close to unity, a situation that would represent unstable contact on the entire fixation zone. The distal fixation presents a similar instability index to that found in the baseline model (0.82 vs 0.85). The slightly smaller value represents better quality in the contact, and it is perhaps explained by the slightly smaller relative angulation between device and aorta due to the shorter distance between fixation zones. These findings are in agreement with clinical studies that correlated short aortic fixation lengths with poor clinical outcomes (Fulton, Farber et al. 2006), (Zarins 2003).
Figure 9.
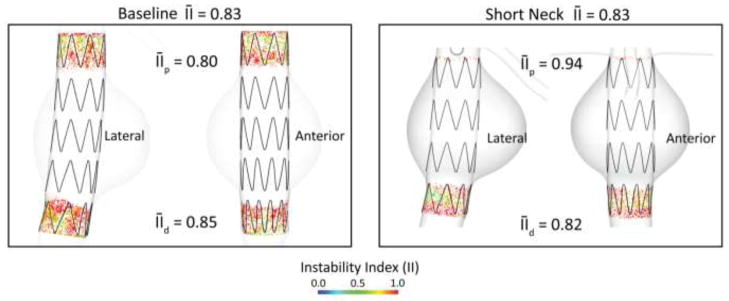
Average instability index for the baseline (left panel) and short-neck (right panel) aortic models. Significantly reduced proximal neck in the SN model leads to an 18% increase in the proximal average II.
3.3. Impact of aortic curvature on endograft stability
We investigated the impact of aortic curvature by using the higher-curvature aortic model depicted in Figure 2. This model has a modest neck angulation of 16 degrees. The endograft deployed in this model is 11 % longer than the baseline design (100 mm long) to accommodate the longer distance between proximal and distal landing zones. The device consists of 5 nitinol stent units, is oversized by 10% and has a friction coefficient with the aorta of μ=0.30. Figure 10 shows the lateral and anterior view of the instability index II maps for the baseline (left) and the higher-curvature (right) models. The average instability index increases modestly relative to the baseline model (0.85 versus 0.83), reflecting a more unstable contact. The instability index increases both at the proximal and distal locations compared to the baseline model. The largest increase in instability index is observed in the proximal fixation zone (0.83 versus 0.80). This is explained by the larger neck angulation of the higher curvature model. The increase in average instability index is more modest in the distal fixation zone (0.86 versus 0.85). Of note are the different degrees of circumferential apposition of the stents in the proximal and distal fixation zones: In the proximal fixation zone, the stents are in full contact with the aortic wall in the posterior side of the device. This is not the case in the anterior face of the device, where only the top half of the stent is in contact with the aortic wall. The situation is different in the distal fixation zone, where the apposition of the stents is more uniform circumferentially. This probably explains the small difference in compared to the baseline model despite the larger relative angulation between device and aorta. These findings correlate well with previous published data showing that hemodynamic loads on the device become larger with increased angulation and stent-graft length (Li and Kleinstreuer 2006; Figueroa, Taylor et al. 2009) and with clinical studies that correlated neck angulation with poor clinical outcomes (Sternbergh, Carter et al. 2002; Hobo, Kievit et al. 2007).
Figure 10.
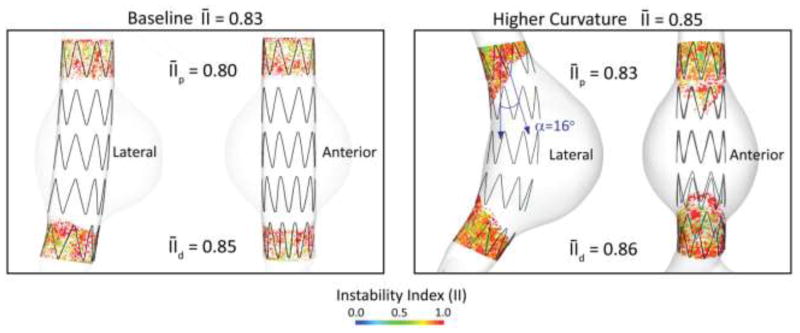
Average instability index for the baseline (left panel) and higher curvature (right panel) aortic models.
3.4. Impact of friction coefficient on endograft stability
In this example we investigated the impact of the roughness of contact between aortic wall and endograft by considering three different values for the coefficient of friction μ using the baseline aortic model and endograft geometry. Frictional interaction at the aorta-device interface plays an important role on device stability. A diseased endothelial layer due to the presence of thrombus, calcifications, and atherosclerotic plaque will significantly alter the coefficient of friction between device and aorta and potentially compromise the positional stability of the endograft. In addition to the baseline value of μ = 0.30, we considered a larger value μ = 0.75 representing a rougher contact between device and aorta, and a smaller value μ = 0.05, representing a smoother contact. Figure 11 shows the lateral and anterior views of the instability index II maps for the three values of friction coefficient. By reducing μ to 0.05, the device stability decreased considerably as indicated by an average II of 0.96 (16% increase from the baseline II of 0.83). Both the proximal and distal average II increased significantly compared to baseline values: 21% (0.97 versus 0.80) and 13% (0.96 versus 0.85), respectively. The proximal average instability index is so close to unity that it practically indicates a situation of device instability. Conversely, by increasing μ to 0.75, the device stability improved significantly as indicated by an average instability index of 0.63 (24% decrease from the baseline of 0.83). Again, both the proximal and distal average II decreased significantly: 26% (0.59 versus 0.80) and 21% (0.67 versus 0.85), respectively. It is likely that the disease state of the aortic neck alters the friction coefficient between the vessel wall and the device. The impact of aortic neck disease (calcifications, thrombus, atherosclerotic plaque, etc.) on endograft stability has been studied recently and results suggest a correlation between neck disease and poor clinical outcomes in the form of endograft migration, endoleaks, and secondary interventions (Wyss, Dick et al. 2011).
Figure 11.

Average instability index II for the baseline model under different friction coefficients between device and aortic wall (μ = 0.05, 0.30, 0.75). With the low friction coefficient μ = 0.05 the proximal and distal II increased significantly by 21% and 13% respectively compared to the baseline model, indicating lower device stability. With the high friction coefficient μ = 0.75 the proximal and distal II decreased by 26% and 21% respectively compared to the baseline model, indicating improved device stability.
3.5. Impact of oversizing on endograft stability
In this example we investigated the impact of oversizing on endograft stability. When planning an endovascular procedure, oversizing is often times the only factor the surgeon has the freedom to choose, since other parameters such as device length, fixation length, etc. are dictated by the anatomy. Oversizing the device relative to the nominal aortic diameter increases the radial force exerted by the stent-graft in the fixation zone. The larger the oversizing, the larger the radial force and the larger the fixation response of the device. The degree of oversizing in clinical practice varies significantly, ranging from as little as 5% to as large as 30%. Figure 12 shows the lateral and anterior views of the instability index for two degrees of oversizing in the baseline geometry: 10% (left panel) and 15% (right panel). The 15% oversized device shows a more stable contact: 0.78 average instability index versus 0.83, 6% improvement. This improvement in contact quality is more apparent in the proximal fixation ( versus as 0.80 in the 10% oversizing device, 9% improvement) than in the distal fixation zone (0.84 versus 0.85, 1% improvement). The contact area increased by 40% in the 15% oversized device: 1283 mm2 versus 919 mm2 in the 10% oversizing device.
Figure 12.
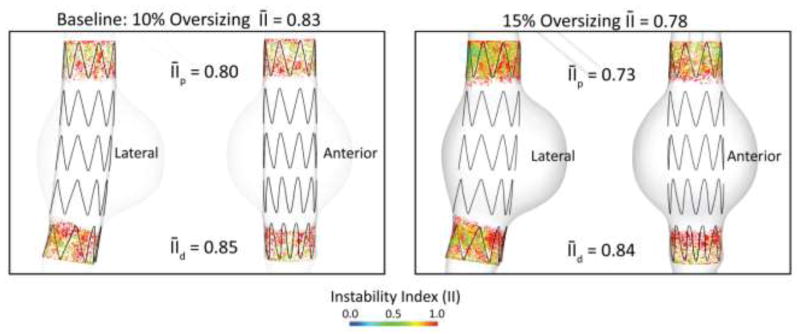
Instability index for the baseline model with a 10% oversized device (left), and a 15% oversized device (right). Device oversizing leads to a 6% improvement in device stability in the proximal zone.
While device oversizing clearly improves device stability, it is important to reflect on the impact that excessive oversizing may have on aortic wall stresses. To that end, we calculated the average intramural stresses σθθ in three different scenarios: 1) baseline aortic geometry without endograft, 2) 10% oversized endograft and 3) 15% oversized endograft, see Figure 13. In all cases, the system is subject to a mean arterial pressure MAP = 108 mmHg. The left side of the figure shows a posterior view of the baseline aortic model. The right side panels show contour plots of the maximum circumferential stress (top row) and a schematic representation of the relative magnitude and orientation of these stresses (bottom row). In the baseline configuration without a stent-graft, the average intramural circumferential stress is σθθBL = 0.09 MPa. This stress doubles due to the presence of the 10% oversized endograft, and is almost 2.5 times larger in the case of the 15% oversized device. This sudden increase in intramural stress may represent a significant alteration of the baseline biomechanical stimuli in the aortic neck and therefore trigger a growth & remodeling response (Figueroa, Baek et al. 2009) that may result in neck enlargement. Clinical studies have shown that excessive device oversizing is linked to events such as neck dilation and Type Ia endoleaks and migration (Sternbergh, Money et al. 2004) (Sampaio, Panneton et al. 2006).
Figure 13.
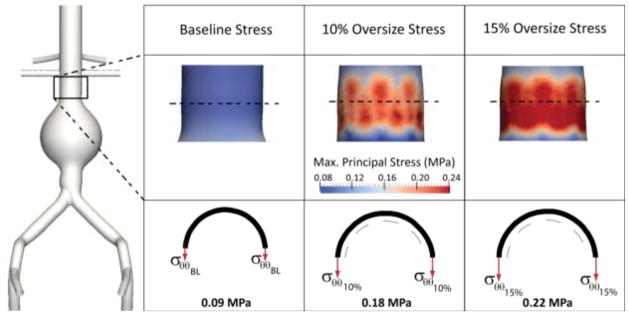
Maximum circumferential stress in the aortic neck is a function of endograft oversizing: larger degrees of oversizing increase the circumferential stress more and more and may result in adverse events such as neck dilation.
4. Discussion
Endovascular aneurysm repair (Greenhalgh, Brown et al.) has revolutionized the treatment of abdominal and thoracic aortic aneurysm disease and has experienced a rapid growth since its introduction in the mid-1990s. However, despite the widespread acceptance and significantly improved short-term outcomes compared to open repair procedures, EVAR is known to suffer from long-term complications such as late device migration, endoleaks and the need for costly long-term imaging surveillance. Understanding the factors governing the positional stability of endografts in-vivo is a key element towards improving their long-term behavior. Computational modeling techniques can provide an unprecedented insight into the in vivo working conditions experienced by abdominal and thoracic endografts. These techniques, together with recent progress in the areas of diagnostic medical imaging, image processing, linear algebra, and finally, computer hardware (Taylor and Figueroa 2009) hold the promise to provide one day solutions for procedure planning and medical device performance evaluation on a patient-specific basis. Computational modeling enables investigating alterations in the loading conditions experienced by endografts following changes in blood pressure and blood flow and to virtually modify the size of the various components of the device. The paradigm of “virtual prototyping” that has been extensively applied for quite some time in industries such as the automotive and the aeronautical is now beginning to be used in the medical device industry as well. Furthermore, computational modeling is one of the new technologies that according to the FDA’s “Critical Path” report can be used to get fundamentally better answers about how the safety and effectiveness of new products can be demonstrated, in faster time frames, with more certainty, and at lower costs.
The overall goal of this paper was to develop a comprehensive computational framework based on computational solid mechanics (CSM) and computational fluid dynamics (CFD) tools to investigate the positional stability of aortic endografts under in-vivo hemodynamic loading using realistic constitutive laws, device and aortic geometries, and contact mechanics formulations. This is, to the best of our knowledge, the first investigation that considers contact mechanics formulations to represent the interactions between the endograft and the aortic wall, rather than assuming a perfect apposition of the device in the fixation zone. Furthermore, a key feature of the proposed computational framework is the introduction of a quantitative index that can be used to assess and compare the positional stability of aortic and thoracic endografts deployed in anatomically and physiologically-realistic models. The main building blocks of this framework are:
Three-dimensional, non-planar geometries for aorta and stent-graft models. Previous studies had considered planar configurations for the aorta, and had therefore failed to represent the important transverse component of the hemodynamics actions of blood on the endograft (Figueroa, Taylor et al. 2009).
Realistic constitutive laws for the aorta, stent, and graft materials. Here, we adopted an isotropic hyperelastic model fit to uniaxial experimental data for the aorta, a super-elastic nitinol material response for the stent, and a linear elastic law for the ePTFE material of the graft. In the modeling of the aortic tissue, we included the important arterial pre-stress since it is a factor that greatly affects the stiffness of the wall.
Physiological values for blood flow and pressure, via appropriate inflow and outflow boundary conditions for the CFD problem.
A frictional contact model to represent the interactions between device and aorta at the fixation zones. We adopted a hard contact model to characterize normal contact and a Coulomb friction model to represent tangential contact. We defined a metric of positional stability, the instability index, a normalized index that ranges between 0 and 1 (the smaller the index, the more stable the contact).
We studied the positional stability of a tubular stent-graft deployed in three different aortic models, considering different degrees of oversizing and friction coefficients. Our results agree qualitatively with previous experimental and clinical data: unfavorable neck anatomy (i.e., angulation and short fixation length) results in diminished contact quality at the fixation zone, and is therefore linked to unfavorable outcomes. Furthermore, we demonstrated that a higher coefficient of friction results in improved positional stability. Finally, we showed that increasing the device oversizing results in improved contact but may increase the level of circumferential stresses in the aortic neck to a point that may trigger neck dilation.
Mesh-independence study
Assessing the dependence of the numerical results on mesh resolution is a critical component of any computational study. In this work the stability results depend closely on the complex geometry of the contact area between the surfaces of device and aorta and therefore mesh independence studies become even more critical. We assessed the mesh independence of the stability results obtained using the baseline aortic geometry and the 10% oversized endograft with friction coefficient μ = 0.30. In addition to the mesh utilized in Section 3.1 (Mesh 1) featuring approximately 300K elements and 0.9 million degrees of freedom, we considered two additional meshes: Mesh 2 refines the discretization used in the aorta while keeping the stent and graft meshes identical to those in Mesh 1 for a total of 430K elements and 1.3 million degrees of freedom. Mesh 3 refines the grids of aorta, stent, and graft for a total of 700K elements and 2.1 million degrees of freedom (see Table 4).
Table 4.
Number of degrees of freedom (in millions), and total number of elements (sum of triangular shells for the aorta and graft and hexahedral solids for the stent) for the three finite element meshes utilized in the mesh independence study.
| Mesh | DOFs (millions) | Elements | |||
|---|---|---|---|---|---|
| Aorta | Stent | Graft | TOTAL | ||
| Mesh 1 (Baseline) | 0.9 | 134,234 | 27,840 | 135,700 | 297,774 |
| Mesh 2 (Refined aorta) | 1.3 | 266,958 | 27,840 | 135,700 | 430,498 |
| Mesh 3 (Refined aorta and endograft) | 2.1 | 266,958 | 57,600 | 374,784 | 699,342 |
Table 5 shows the average instability index for the three meshes in the proximal and distal fixation zones, as well as the average for the entire device. It is clear that while the results in the proximal fixation zone are independent from the mesh resolution (average instability indices of 0.80, 0.80 and 0.79 for meshes 1, 2, and 3, respectively), the average instability index varies significantly in the distal fixation zone: from 0.85 in Mesh 1 to 0.82 in Mesh 2 (4% difference) and 0.78 in Mesh 3 (8% difference). This variation might be due to the more complex apposition of the device in the distal fixation zone. Indeed, Figure 8 illustrates that whereas the proximal fixation zone has a homogeneous spacing of the struts in the anterior and lateral views, the distal fixation shows a heterogeneous circumferential distribution of the struts. The complexity of the heterogeneous contact can therefore only be captured with a more refined grid. It is also interesting to note that while Mesh 1 produced a probably unrealistic result where the instability index is larger in the distal fixation than in the proximal fixation, Mesh 3 generated a more physical result where the two regions have almost identical values. Indeed, the distal instability index is slightly smaller than the proximal (0.78 versus 0.79) as it is expected due to the longitudinal pressure gradient.
Table 5.
Instability index results for the three finite element meshes utilized in the mesh independence study.
| Mesh | DOFs (millions) | Instability Index | ||
|---|---|---|---|---|
| Proximal | Distal | Average | ||
| Mesh 1 (Baseline) | 0.9 | 0.80 | 0.85 | 0.83 |
| Mesh 2 (Refined aorta) | 1.3 | 0.80 | 0.82 | 0.81 |
| Mesh 3 (Refined aorta and endograft) | 2.1 | 0.79 | 0.78 | 0.78 |
Limitations and Future Work
The complexity of the problem at hand made it such that several simplifications in the modeling approach were adopted. We utilized tubular unibody stent-graft geometries with passive fixation (i.e., radial force) in the proximal and distal ends of the device. In reality, all commercially available abdominal endografts are bifurcated devices. We adopted this simplification to reduce the geometric complexity of the problem since our main focus was on the development of the methodology. In a bifurcated device the complexity and extent of the contact in the iliac landing zones is expected to be significantly larger. In future work, a bigger emphasis will be placed on geometric complexity. Furthermore, most of the commercially available devices have active fixation mechanisms consisting of hooks and barbs that penetrate the intimal and medial layers to clamp the device to the aortic wall. Future studies will incorporate these bifurcated geometries, as well as damage models to simulate the clamping of the hooks on the wall (Chaboche 1988; Humphrey 2003; Calvo, Pena et al. 2007). While the active fixation devices have undoubtedly improved short-term fixation responses, it remains unclear what the long-term adaptation of the arterial wall in response to the injury introduced the hooks and barbs will be like.
In the pre-stress calculation, our incremental inverse stress analysis assumes a linear response under reasonably small load and unload increments. This therefore is an approximation for the nonlinear hyperelastic aortic wall response. More comprehensive prestress-prestrain approaches (Raghavan, Ma et al. 2006; Speelman, Bosboom et al. 2009; Gee, Förster et al. 2010) can be incorporated in future work. In the endograft deployment stage of the CSM analysis, we did not simulate the processing history and crimping stresses in the nitinol stent which can have an important impact on the mechanical properties of the stent (Stoeckel, Pelton et al. 2004). We also modeled the aortic wall as a homogeneous isotropic hyperelastic material with constant wall thickness and assumed a healthy aortic neck. In reality, the mechanical behavior of the abdominal and thoracic aortic wall is greatly heterogeneous and disease is often found in the aortic neck region. Hence, more complex constitutive models are needed. Similarly, the thickness of the aortic wall varies along the length of the aorta and within the aneurysm section (Raghavan, Kratzberg et al. 2006). Incorporating patient-specific variable wall thickness can improve the predictive capabilities of the computational model (Xiong, Figueroa et al. 2010).
In the CFD analysis we did not consider the effect of the compliance of the aortic wall and the endograft. Instead, solutions were computed using the fixed endograft configuration obtained from the deployment process under hydrostatic conditions. In reality, the deformability of both the aorta and the device probably play an important role on the radial forces exerted by the device against the aortic wall. These forces are undoubtedly dynamic in nature since the degree of oversizing may experience dramatic changes through the cardiac cycle due to the distensibility of the aortic neck (Liffman, Sutalo et al. 2006; Corbett, Molony et al. 2011). Lastly, in the contact stability stage of the CSM analysis we considered a static coefficient of friction and time-averaged hemodynamic loads. Future work will extend this approach to include dynamic loads experienced by the endograft due to the pulsatile nature of blood flow and will consider a dynamic frictional model.
To conclude, it is important to emphasize the need to perform validation studies of the proposed methodology against bench top or in vivo data. These data have typically consisted on measurements of the “pull-out” force required to dislodge the endograft. We could therefore validate our methodology by reproducing these pull-out test experiments numerically, with the purpose of verifying that a global Instability Index of one is reached when the pull-out force starts dislodging the endograft from the arterial sample. Furthermore, these tests would have the additional benefit of informing the choice of numerical values for the friction coefficient between device and aorta.
5. Conclusion
We have developed a comprehensive computational solid mechanics and computational fluid dynamics framework to investigate the positional stability of abdominal and thoracic endografts under in-vivo loading conditions using realistic three-dimensional geometries and material models. This is, to the best of our knowledge, the first computational investigation that models the complex contact interactions between the aorta and the endograft rather than assuming a perfect apposition of the device and the aorta. We introduced a metric, the instability index, to evaluate the stability of contact from a quantitative standpoint. We then applied the framework to several situations featuring different abdominal aneurysm geometries, degrees of oversizing, and friction coefficients. The results agreed from a quantitative standpoint with clinical and experimental findings. This framework, once validated against experimental and clinical data, and once future critical modeling improvements are incorporated, may be used someday to improve our ability to identify both long-term and short-term endograft failure modes and to ultimately assist in the development of future endograft designs and treatment planning.
Table 3.
Windkessel lumped parameters (proximal resistance Rp, capacitance C, and distal resistance Rd) utilized on each of the outlet faces of the aortic model. Units given in [mm,gr,s].
| Hepatic | Splenic | SMA | R Renal | L Renal | R Ext Iliac | R Int Iliac | L Ext Iliac | L Int Iliac | |
|---|---|---|---|---|---|---|---|---|---|
| Rp | 0.143 | 0.143 | 0.105 | 0.565 | 0.565 | 0.128 | 0.299 | 0.128 | 0.299 |
| C | 0.433 | 0.433 | 0.586 | 0.586 | 0.586 | 0.482 | 0.207 | 0.482 | 0.207 |
| Rd | 2.406 | 2.406 | 1.778 | 1.318 | 1.318 | 2.161 | 5.043 | 2.161 | 5.043 |
Acknowledgments
The authors gratefully acknowledge the support of the NIH ARRA Grant No RC1 EB011443. We also wish to acknowledge the support provided by Simulia®, the use of the mesh generator MeshSim™ (http://www.simmetrix.com) and the linear algebra package AcuSolve™ (http://www.acusim.com).
References
- Ahrens J, Geveci B, et al. ParaView: An end-user tool for large data visualization. 2005. [Google Scholar]
- Albertini JN, Kalliafas S, et al. Anatomical risk factors for proximal perigraft endoleak and graft migration following endovascular repair of abdominal aortic aneurysms. European Journal of Vascular and Endovascular Surgery. 2000;19(3):308–312. doi: 10.1053/ejvs.1999.1045. [DOI] [PubMed] [Google Scholar]
- Amblard A, Berre HWL, et al. Analysis of type I endoleaks in a stented abdominal aortic aneurysm. Medical Engineering & Physics. 2009;31(1):27–33. doi: 10.1016/j.medengphy.2008.03.005. [DOI] [PubMed] [Google Scholar]
- Arko FR, Heikkinen M, et al. Iliac fixation length and resistance to in-vivo stent-graft displacement. Journal of Vascular Surgery. 2005;41(4):664–670. doi: 10.1016/j.jvs.2004.12.050. [DOI] [PubMed] [Google Scholar]
- Brewster DC, Cronenwett JL, et al. Guidelines for the treatment of abdominal aortic aneurysms: Report of a subcommittee of the Joint Council of the American Association for Vascular Surgery and Society for Vascular Surgery. Journal of Vascular Surgery. 2003;37(5):1106–1117. doi: 10.1067/mva.2003.363. [DOI] [PubMed] [Google Scholar]
- Calvo B, Pena E, et al. An uncoupled directional damage model for fibred biological soft tissues. Formulation and computational aspects. International Journal for Numerical Methods in Engineering. 2007;69(10):2036–2057. [Google Scholar]
- Chaboche JL. Continuum Damage Mechanics: Part I---General Concepts. Journal of Applied Mechanics. 1988;55(1):59–64. [Google Scholar]
- Corbett TJ, Molony DS, et al. The effect of vessel material properties and pulsatile wall motion on the fixation of a proximal stent of an endovascular graft. Medical Engineering & Physics. 2011;33(1):106–111. doi: 10.1016/j.medengphy.2010.09.013. [DOI] [PubMed] [Google Scholar]
- De Bruin JL, Baas AF, et al. Long-Term Outcome of Open or Endovascular Repair of Abdominal Aortic Aneurysm. New England Journal of Medicine. 2010;362(20):1881–1889. doi: 10.1056/NEJMoa0909499. [DOI] [PubMed] [Google Scholar]
- Ferruzzi J, Vorp DA, et al. On constitutive descriptors of the biaxial mechanical behaviour of human abdominal aorta and aneurysms. Journal of the Royal Society Interface. 2011;8(56):435–450. doi: 10.1098/rsif.2010.0299. [DOI] [PMC free article] [PubMed] [Google Scholar]
- Figueroa CA, Baek S, et al. A computational framework for fluid-solid-growth modeling in cardiovascular simulations. Computer Methods in Applied Mechanics and Engineering. 2009;198(45–46):3583–3602. doi: 10.1016/j.cma.2008.09.013. [DOI] [PMC free article] [PubMed] [Google Scholar]
- Figueroa CA, Taylor CA, et al. Magnitude and Direction of Pulsatile Displacement Forces Acting on Thoracic Aortic Endografts. Journal of Endovascular Therapy. 2009;16(3):350–358. doi: 10.1583/09-2738.1. [DOI] [PMC free article] [PubMed] [Google Scholar]
- Figueroa CA, Taylor CA, et al. Effect of Curvature on Displacement Forces Acting on Aortic Endografts: A 3-Dimensional Computational Analysis. Journal of Endovascular Therapy. 2009;16(3):284–294. doi: 10.1583/08-2667.1. [DOI] [PMC free article] [PubMed] [Google Scholar]
- Figueroa CA, I, Vignon-Clementel E, et al. A coupled momentum method for modeling blood flow in three-dimensional deformable arteries. Computer Methods in Applied Mechanics and Engineering. 2006;195(41–43):5685–5706. [Google Scholar]
- Fleming C, Whitlock EP, et al. Screening for Abdominal Aortic Aneurysm: A Best-Evidence Systematic Review for the U.S. Preventive Services Task Force. Annals of Internal Medicine. 2005;142(3):203–211. doi: 10.7326/0003-4819-142-3-200502010-00012. [DOI] [PubMed] [Google Scholar]
- Fulton JJ, Farber MA, et al. Effect of challenging neck anatomy on mid-term migration rates in AneuRx endografts. Journal of vascular surgery. 2006;44(5):932–937. doi: 10.1016/j.jvs.2006.06.034. [DOI] [PubMed] [Google Scholar]
- Gee MW, Förster C, et al. A computational strategy for prestressing patient-specific biomechanical problems under finite deformation. International Journal for Numerical Methods in Biomedical Engineering. 2010;26(1):52–72. [Google Scholar]
- Gillum RF. Epidemiology of aortic aneurysm in the United States. Journal of Clinical Epidemiology. 1995;48(11):1289–1298. doi: 10.1016/0895-4356(95)00045-3. [DOI] [PubMed] [Google Scholar]
- Govindjee S, Mihalic PA. Computational methods for inverse deformations in quasi incompressible finite elasticity. International journal for numerical methods in engineering. 1998;43(5):821–838. [Google Scholar]
- Greenhalgh RM, Brown LC, et al. Endovascular versus Open Repair of Abdominal Aortic Aneurysm. New England Journal of Medicine. 2010;362(20):1863–1871. doi: 10.1056/NEJMoa0909305. [DOI] [PubMed] [Google Scholar]
- Heikkinen MA, Alsac JM, et al. The importance of iliac fixation in prevention of stent graft migration. Journal of Vascular Surgery. 2006;43(6):1130–1137. doi: 10.1016/j.jvs.2006.01.031. [DOI] [PubMed] [Google Scholar]
- Hobo R, Kievit J, et al. Influence of severe infrarenal aortic neck angulation on complications at the proximal neck following endovascular AAA repair: a EUROSTAR study. Journal of Endovascular Therapy. 2007;14(1):1–11. doi: 10.1583/06-1914.1. [DOI] [PubMed] [Google Scholar]
- Hughes TJR. The Finite Element Method: Linear Static and Dynamic Finite Element Analysis. Dover; 2000. [Google Scholar]
- Humphrey JD. Continuum biomechanics of soft biological tissues. Proceedings of the Royal Society a-Mathematical Physical and Engineering Sciences. 2003;459(2029):3–46. [Google Scholar]
- Humphrey JD, Taylor CA. Intracranial and Abdominal Aortic Aneurysms: Similarities, Differences, and Need for a New Class of Computational Models. Annual Review of Biomedical Engineering. 2008;10(1):221–246. doi: 10.1146/annurev.bioeng.10.061807.160439. [DOI] [PMC free article] [PubMed] [Google Scholar]
- Hutchings IM. Tribology: Frition and Wear of Engineering Materials. London: Elsevier Limited; 1992. [Google Scholar]
- Johnson KL. Contact Mechanics. Cambridge University Press; 1987. [Google Scholar]
- Kannan RY, Salacinski HJ, et al. Current status of prosthetic bypass grafts: a review. Journal of Biomedical Materials Research Part B: Applied Biomaterials. 2005;74(1):570–581. doi: 10.1002/jbm.b.30247. [DOI] [PubMed] [Google Scholar]
- Kleinstreuer C, Li Z, et al. Computational mechanics of nitinol stent grafts. Journal of Biomechanics. 2008;41(11):2370–2378. doi: 10.1016/j.jbiomech.2008.05.032. [DOI] [PubMed] [Google Scholar]
- Leurs LJ, Bell R, et al. Endovascular treatment of thoracic aortic diseases: Combined experience from the EUROSTAR and United Kingdom Thoracic Endograft Registries. Journal of Vascular Surgery. 2004;40(4):670–679. doi: 10.1016/j.jvs.2004.07.008. [DOI] [PubMed] [Google Scholar]
- Li Z, Kleinstreuer C. Analysis of biomechanical factors affecting stent-graft migration in an abdominal aortic aneurysm model. Journal of Biomechanics. 2006;39(12):2264–2273. doi: 10.1016/j.jbiomech.2005.07.010. [DOI] [PubMed] [Google Scholar]
- Li ZH, Kleinstreuer C. Blood flow and structure interactions in a stented abdominal aortic aneurysm model. Medical Engineering & Physics. 2005;27(5):369–382. doi: 10.1016/j.medengphy.2004.12.003. [DOI] [PubMed] [Google Scholar]
- Liffman K, I, Sutalo D, et al. Movement and dislocation of modular stent-grafts due to pulsatile flow and the pressure difference between the stent-graft and the aneurysm sac. Journal of Endovascular Therapy. 2006;13(1):51–61. doi: 10.1583/05-1699.1. [DOI] [PubMed] [Google Scholar]
- Malina M, Lindblad B, et al. Endovascular AAA exclusion: Will stents with hooks and barbs prevent stent-graft migration? Journal of Endovascular Surgery. 1998;5(4):310–317. doi: 10.1177/152660289800500404. [DOI] [PubMed] [Google Scholar]
- Marlow R. A general first-invariant hyperelastic constitutive model. Taylor & Francis; 2003. [Google Scholar]
- Martins P, Jorge RMN, et al. A comparative study of several material models for prediction of hyperelastic properties: Application to silicone-rubber and soft tissues. Strain. 2006;42(3):135–147. [Google Scholar]
- Morris L, Delassus P, et al. A mathematical model to predict the in vivo pulsatile drag forces acting on bifurcated stent grafts used in endovascular treatment of abdominal aortic aneurysms (AAA) Journal of Biomechanics. 2004;37(7):1087–1095. doi: 10.1016/j.jbiomech.2003.11.014. [DOI] [PubMed] [Google Scholar]
- Murphy EH, Johnson ED, et al. Device-specific resistance to in vivo displacement of stent-grafts implanted with maximum iliac fixation. Journal of Endovascular Therapy. 2007;14(4):585–592. doi: 10.1177/152660280701400422. [DOI] [PubMed] [Google Scholar]
- Oden JT, Martins JAC. Models and Computational Methods for Dynamic Friction Phenomena. Computer Methods in Applied Mechanics and Engineering. 1985;52(1–3):527–634. [Google Scholar]
- Olsson C, Thelin S, et al. Thoracic Aortic Aneurysm and Dissection. Circulation. 2006;114(24):2611–2618. doi: 10.1161/CIRCULATIONAHA.106.630400. [DOI] [PubMed] [Google Scholar]
- Prior AM. Applications of implicit and explicit Finite-Element techniques to metal-forming. Journal of Materials Processing Technology. 1994;45(1–4):649–656. [Google Scholar]
- Raghavan M. Wall stress distribution on three-dimensionally reconstructed models of human abdominal aortic aneurysm. Journal of Vascular Surgery. 2000;31(4):760–769. doi: 10.1067/mva.2000.103971. [DOI] [PubMed] [Google Scholar]
- Raghavan M, Kratzberg J, et al. Regional distribution of wall thickness and failure properties of human abdominal aortic aneurysm. Journal of Biomechanics. 2006;39(16):3010–3016. doi: 10.1016/j.jbiomech.2005.10.021. [DOI] [PubMed] [Google Scholar]
- Raghavan M, Webster MW, et al. Ex vivo biomechanical behavior of abdominal aortic aneurysm: assessment using a new mathematical model. Annals of biomedical engineering. 1996;24(5):573–582. doi: 10.1007/BF02684226. [DOI] [PubMed] [Google Scholar]
- Raghavan ML, Ma BS, et al. Non-invasive determination of zero-pressure geometry of arterial aneurysms. Annals of Biomedical Engineering. 2006;34(9):1414–1419. doi: 10.1007/s10439-006-9115-7. [DOI] [PubMed] [Google Scholar]
- Raghavan M, Vorp David A. Toward a biomechanical tool to evaluate rupture potential of abdominal aortic aneurysm: identification of a finite strain constitutive model and evaluation of its applicability. Journal of Biomechanics. 2000;33:475–482. doi: 10.1016/s0021-9290(99)00201-8. [DOI] [PubMed] [Google Scholar]
- Resch T, Malina M, et al. The impact of stent design on proximal stent-graft fixation in the abdominal aorta: an experimental study. European Journal of Vascular and Endovascular Surgery. 2000;20(2):190–195. doi: 10.1053/ejvs.1999.0991. [DOI] [PubMed] [Google Scholar]
- Roll S, Müller-Nordhorn J, et al. Dacron® vs. PTFE as bypass materials in peripheral vascular surgery – systematic review and meta-analysis. BMC surgery. 2008;8(1):22. doi: 10.1186/1471-2482-8-22. [DOI] [PMC free article] [PubMed] [Google Scholar]
- Sampaio SM, Panneton JM, et al. Aortic neck dilation after endovascular abdominal aortic aneurysm repair: Should oversizing be blamed? Annals of Vascular Surgery. 2006;20(3):338–345. doi: 10.1007/s10016-006-9067-2. [DOI] [PubMed] [Google Scholar]
- Simulia Abaqus Theory Manual, Version 6.8.
- SimVascular. Cardiovascular Modeling and Simulation Application. 2007 https://simtk.org/home/simvascular.
- Speelman L, Bosboom EMH, et al. Initial stress and nonlinear material behavior in patient-specific AAA wall stress analysis. Journal of Biomechanics. 2009;42(11):1713–1719. doi: 10.1016/j.jbiomech.2009.04.020. [DOI] [PubMed] [Google Scholar]
- Sternbergh WC, Carter G, et al. Aortic neck angulation predicts adverse outcome with endovascular abdominal aortic aneurysm repair. Journal of Vascular Surgery. 2002;35(3):482–486. doi: 10.1067/mva.2002.119506. [DOI] [PubMed] [Google Scholar]
- Sternbergh WC, Money SR, et al. Influence of endograft oversizing on device migration, endoleak, aneurysm shrinkage, and aortic neck dilation: Results from the Zenith multicenter trial. Journal of Vascular Surgery. 2004;39(1):20–26. doi: 10.1016/j.jvs.2003.09.022. [DOI] [PubMed] [Google Scholar]
- Stoeckel D, Pelton A, et al. Self-expanding nitinol stents: material and design considerations. European radiology. 2004;14(2):292–301. doi: 10.1007/s00330-003-2022-5. [DOI] [PubMed] [Google Scholar]
- Taylor CA, Figueroa CA. Patient-Specific Modeling of Cardiovascular Mechanics. Annual Review of Biomedical Engineering. Palo Alto, Annual Reviews. 2009;11:109–134. doi: 10.1146/annurev.bioeng.10.061807.160521. [DOI] [PMC free article] [PubMed] [Google Scholar]
- Vad S, Eskinazi A, et al. Determination of Coefficient of Friction for Self-Expanding Stent-Grafts. Journal of Biomechanical Engineering-Transactions of the Asme. 2010;132(12) doi: 10.1115/1.4002798. [DOI] [PubMed] [Google Scholar]
- Vande Geest JP, Sacks MS, et al. Age dependency of the biaxial biornechanical Behavior of humian abdominal aorta. Journal of Biomechanical Engineering-Transactions of the Asme. 2004;126(6):815–822. doi: 10.1115/1.1824121. [DOI] [PubMed] [Google Scholar]
- Vande Geest JP, Sacks MS, et al. The effects of aneurysm on the biaxial mechanical behavior of human abdominal aorta. Journal of Biomechanics. 2006;39(7):1324–1334. doi: 10.1016/j.jbiomech.2005.03.003. [DOI] [PubMed] [Google Scholar]
- Vignon-Clementel IE, Figueroa CA, Jansen KE, Taylor CA. Outflow Boundary Conditions for Three-Dimensional Simulations of Non-Periodic Blood Flow and Pressure Fields in Deformable Arteries. Computer Methods in Biomechanics and Biomedical Engineering. 2010;13(5):625–640. doi: 10.1080/10255840903413565. [DOI] [PubMed] [Google Scholar]
- Wriggers P. Finite element algorithms for contact problems. Archives of Computational Methods in Engineering. 1995;2(4):1–49. [Google Scholar]
- Wriggers P. Finite element methods for contact problems with friction. Tribology International. 1996;29(8):651–658. [Google Scholar]
- Wyss TR, Dick F, et al. The influence of thrombus, calcification, angulation, and tortuosity of attachment sites on the time to the first graft-related complication after endovascular aneurysm repair. Journal of Vascular Surgery. 2011;54(4):965–971. doi: 10.1016/j.jvs.2011.04.007. [DOI] [PubMed] [Google Scholar]
- Xiong G, Figueroa CA, et al. Simulation of Blood Flow in Deformable Vessels Using Subject-specific Geometry and Assigned Variable Mechanical Wall Properties. International Journal for Numerical Methods in Biomedical Engineering. 2010;27(7):1000–1016. doi: 10.1002/cnm.1404. [DOI] [PMC free article] [PubMed] [Google Scholar]
- Zarins C. Stent graft migration after endovascular aneurysm repair: importance of proximal fixation. Journal of Vascular Surgery. 2003;38(6):1264–1272. doi: 10.1016/s0741-5214(03)00946-7. [DOI] [PubMed] [Google Scholar]
- Zarins CK. The US AneuRx Clinical Trial: 6-year clinical update 2002. Journal of vascular surgery: official publication, the Society for Vascular Surgery [and] International Society for Cardiovascular Surgery, North American Chapter. 2003;37(4):904. doi: 10.1067/s0741-5214(03)70038-x. [DOI] [PubMed] [Google Scholar]