Abstract
The investigation of naturally volatile and derivatized metabolites in mammalian tissues by comprehensive two-dimensional (2D) gas chromatography coupled with time-of-flight mass spectrometry (GC × GC – TOFMS) can provide the data for a comprehensive analysis of the pathophysiology of disease processes. When relative quantification is needed for hypothesis testing, the preparation of sample tissue must provide clear evidence that a quantitative relationship exists between the final detected signal and the amount of metabolite in the tissue. Herein, we report the optimization of a metabolite extraction method for mouse heart tissue for GC × GC – TOFMS analysis. A recursive extraction experiment was initially performed to measure the extraction efficiency of representative target metabolites (sugars, tricarboxylic acid cycle metabolites, amino acids, lipid and signaling molecules) in the aqueous fraction of a three-phase extraction system involving tissue, methanol:water, and chloroform. Some metabolites suffered from incomplete extraction with a single extraction of ~ 40 mg in 600 μl organic and 400 μl aqueous phases, possibly caused by saturation effects. Subsequent experiments, calibrating resulting metabolite signal to the mass of heart tissue extracted, demonstrated that doubling the solvent volumes and a lower tissue mass was needed to provide accurate relative quantification of the derivatized mouse heart metabolome. We demonstrate quantitative extraction of metabolites from ~ 20 mg of heart tissue using 1200 μl organic phase (chloroform) and 800 μl aqueous phase (methanol: water in equal parts by volume).
Keywords: metabolomics, comprehensive two-dimensional gas chromatography, time-of-flight mass spectrometry, cardiac physiology
1. Introduction
The coupling of comprehensive two-dimensional (2D) gas chromatography with time-of-flight mass spectrometry (GC × GC – TOFMS) for metabolomics investigations combines the high peak capacity of GC × GC with fast scanning and highly selective detection of TOFMS for the analysis of naturally volatile metabolites and those metabolites made amenable to GC analysis via derivatization [1–11]. Metabolomics investigations into many mammalian tissue types by GC × GC – TOFMS has been very fruitful for a variety of sample types, including brain [1,2], urine [3], blood [4,5], and spleen [6]. The metabolomics analysis of the heart tissue of transgenic mice is of significant interest [12–18], but the detailed sample preparation of heart tissue for derivatized metabolomics analysis via GC × GC – TOFMS has not yet been reported in the literature. There are critical issues and challenges in the sample preparation of heart tissue for metabolomics with the GC × GC – TOFMS instrumental platform, specifically the mass of the tissue used and the volume of the extraction solvent(s). Investigations into other tissue types, mainly brain [1], spleen [6], and muscle tissue [13], vary in the tissue masses analyzed from a low of ~ 5 mg to a high of ~ 100 mg extracted into a 1 to 2 ml total extraction solvent (total volume of two-phase liquid extractions). To address these challenges, we report herein the investigation and development of a sample preparation method to facilitate the analysis of the heart metabolome in mice by GC × GC – TOFMS.
The selective knockout of genes in mammalian tissues enables the tissue specific testing of metabolic hypotheses [12, 15–18]. However, when relative quantification is needed for hypothesis testing, preparation of the tissue must provide clear evidence that a quantitative relationship exists between the final detected signal and the amount of metabolite in the tissue. This is difficult with the analysis of metabolites in solid tissues such as the heart, because hearts cannot be synthesized with known concentration levels of metabolites within them, and applying the standard addition method is impractical for comprehensive analysis. Unless complete extraction of all metabolites can be achieved, one can only be certain of the quantification of the metabolites contained in the extraction solvent. For accurate quantification there needs to be a reproducible relationship between the amount of metabolite in the tissue, the amount extracted, and the amount detected.
The advantage of using a mouse model to test hypotheses about specific genotype to phenotype interactions is the ability to reflect upon human physiology without using human subjects. Herein, we report the development and optimization of an extraction method, that has been applied to the analysis of heart tissue from mice with a cardiac-specific deletion of acetyl-CoA carboxylase 2 during pressure overload hypertrophy [12], however the details of the sample preparation methodology as they relate to the analytical chemistry issues of reproducibility, saturation, and tissue mass calibration were not previously reported. In the report herein, we explore these details regarding the sample preparation methodology, with primary focus on the sample mass-to-solvent volume ratio of the extraction conditions.
Three experiments were performed in this study. A recursive extraction experiment was initially performed to measure the extraction efficiency of representative target metabolites (sugars, tricarboxylic acid cycle metabolites, amino acids, lipid and signaling molecules) in the aqueous fraction of a three-phase extraction system involving heart tissue, methanol:water, and chloroform. Only metabolites in the aqueous fraction of the two-phase liquid extraction were dried, derivatized with methoxyamine hydrochloride and N,O-bis-trimethylsilyl-trifluoroacetamide (BSTFA) plus trimethylchlorosilane (TMCS), analyzed by GC × GC – TOFMS, and quantified utilizing chemometric software via PARAFAC deconvolution [19, 20]. Some metabolites will be shown to suffer from incomplete extraction with a single extraction of ~ 40 mg heart tissue in 600 μl organic and 400 μl aqueous phases, possibly caused by saturation effects. Therefore, subsequent to the recursive extraction experiment, a tissue mass calibration experiment was performed using 1200 μl organic and 800 μl aqueous phases to optimize the mass-to-volume ratio used for future investigations of mouse heart tissue. To achieve the goal of relative quantification of the mouse heart metabolome, as measured by derivatization and GC x GC –TOFMS, we will demonstrate quantitative extraction of metabolites from ~ 20 mg of heart tissue in 1200 μl organic and 800 μl aqueous phases. Finally, in a third experiment we use this optimized method to assess the biological variation across ten hearts extracted with ~ 20 mg of heart tissue in 1200 μl organic and 800 μl aqueous phases and quantifying each metabolite peak signal after chemometric deconvolution and relative quantification of targeted metabolites.
2. Experimental
In the experimental approach taken to optimize the extraction of metabolites from mouse heart tissue, a few commonalities exist with all three experiments: (1) recursive extraction experiment, (2) a tissue mass calibration experiment, and (3) a reproducibility experiment. Briefly, the approach to extract metabolites from heart tissue involves removing the heart from the mouse, pulverizing the tissue in liquid nitrogen with a morter and pestle, adding 2:1 chloroform:methanol (by volume) with actual volumes as specified for each experiment, homogenizing the mixture on ice for 30 s with a Tissue Tearor homogenizer (Biospec Products Inc. Bartlesville, OK) and sonicating for 20 s at 50 J. Equal parts of water and methanol (the actual volumes used are detailed below for each experiment) are added and the sample is centrifuged at 4 °C for phase separation of organic and aqueous layers. The aqueous layer is dried under nitrogen stream and the dried metabolites are derivatized with methoxyamine hydrochloride (Sigma-Aldrich, St. Louis, MO) and BSTFA + TMCS (Supelco, Bellefonte, PA).
Removal of heart tissue, metabolite derivatization, and GC × GC – TOFMS analysis are the same for all experiments. Metabolite derivatization and GC × GC – TOFMS analysis is detailed in the Metabolite Derivatization and Instrumental Analysis section. Prior to any metabolite extraction, mice were fasted for 4–5 hours prior to harvesting and at the same time of day. The hearts were removed from the mice by cutting below the auricles so that only ventricles were left. The heart was immediately placed on a gauze pad to remove blood from the exterior. Modified Wollenberger tongs (pre-cooled in liquid nitrogen) were used to freeze-clamp and rapidly submerge the heart in liquid nitrogen. Heart tissue was stored at −80 °C until the day of extraction. On the day of extraction, heart tissue was weighed with an analytical balance and pulverized under liquid nitrogen with a mortar and pestle.
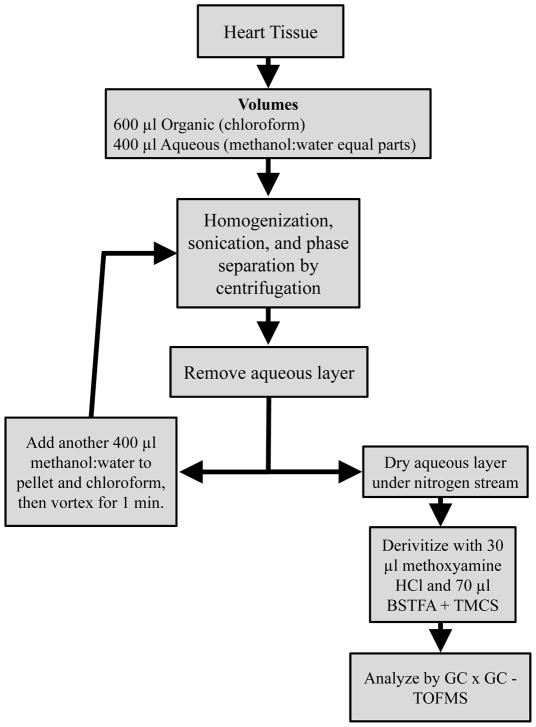
Two experiments were performed for the optimization of heart tissue extraction. The first is the recursive extraction experiment of ~ 40 mg of heart tissue. A schematic of the experimental procedure is shown in Fig. 1. Briefly, a 600 μl volume of cold 2:1 chloroform:methanol was added to 40.5 mg powdered and frozen heart tissue (ventricles). This mixture was homogenized on ice for 30 s with a Tissue Tearor homogenizer (Biospec Products Inc., Bartlesville, OK). The homogenate was sonicated for 20 s using a pulse sonicator at 50 J. A volume of 200 μl chloroform and 200 μl of deionized water were added and the sample was centrifuged at 3220 g for 20 min at 4°C (Eppendorf, 5810R, Hauppauge, NY). After phase separation, the aqueous (methanol:water) layer was removed, dried under nitrogen gas stream, with the metabolites derivatized and analyzed in duplicate by GC × GC – TOFMS. Then an additional 200 μl methanol and 200 μl deionized water was added to the chloroform and tissue pellet. The sample was vortexed, centrifuged, and the aqueous layer was removed for derivatization. Additional volumes of 200 μl methanol and 200 μl deionized water were added recursively, resulting in five total extractions from a single piece of heart tissue. For ~ 40 mg of heart tissue in 1 ml total volume, some metabolites are completely extracted by the first extraction, reflected in little-to-no metabolite extracted during the recursive extractions. However, some metabolites are not completely extracted from the first extraction, indicated as a large amount of metabolite extracted by the successive extractions.
Figure 1.
Recursive extraction experiment procedure to evaluate the effectiveness of extracting ~ 40 mg of heart tissue in 600 μl chloroform and 400 μl methanol:water (1:1 by volume).
We desired to achieve an extraction method that completely extracts all metabolites important for future biochemical investigations in a single extraction. The low volume extraction method (600 μl organic and 400 μl aqueous) does not provide complete extraction of a few representative important metabolites with ~ 40 mg sample in 1 ml total volume. Additionally, the incomplete extraction of these metabolites could cause incomplete or variable partitioning of other metabolites, Therefore, we performed a tissue mass calibration experiment to find an appropriate mass-to-volume ratio of the extraction with a higher total amount of total volume used, as compared to the recursive extraction experiment. We hypothesized that by doubling the solvent volumes used in the recursive extraction experiment, we would not significantly dilute low signal-to-noise analytes to an undetectable level, but would dilute previously saturated metabolites sufficiently for accurate relative quantification (Fig. 2). Three heart tissue samples were cut into four pieces: the masses of tissue were nominally 40 mg, 20 mg, 10 mg, and 5 mg (the exact mass of a given sample to 3 significant figures is plotted in subsequent figures). A volume of 1200 μl of 2:1 chloroform:methanol was added to each weighed, powdered, and frozen heart tissue sample (ventricles). Each mixture was homogenized on ice for ~ 30–45 s. The homogenate was sonicated for 20 s using a pulse sonicator at 50 J. 400 μl of chloroform and 400 μl of distilled water were added to each sample, and the samples were centrifuged at 3220 g for 20 min at 4°C. After phase separation, aqueous (methanol:water) layers were removed, dried under nitrogen gas stream, derivatized and analyzed in duplicate by GC × GC – TOFMS. Linear regression with Microsoft Excel 2010 (Microsoft Corp. Redmond, WA) was used to evaluate the calibration of tissue mass to the mathematically resolved (deconvoluted) peak signal, obtained using the chemometric data analysis tool PARAFAC [19, 20].
Figure 2.
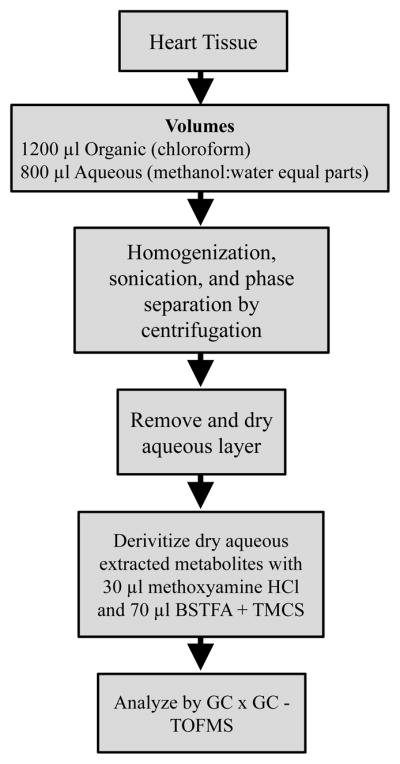
The tissue mass calibration experiment schematic is shown detailing the procedure used to evaluate the linearity of response of the metabolite signal relative to mass of heart extracted for targeted metabolites. Four nominal masses of heart tissue were taken from three different mice: ~ 40 mg, ~ 20 mg, ~ 10 mg, and ~ 5 mg.
A third experiment was performed to determine the reproducibility of the preparation method in combination with the biological variation across multiple mice. Ten hearts were removed and 20 mg pieces were extracted with the 1200 μl organic and 800 μl aqueous phase combination. Samples were dried, derivatized, and analyzed with the same preparation method as all other experiments. Precision was calculated from the PARAFAC deconvoluted peak signals for each metabolite.
2.1 Metabolite Derivatization and Instrumental Analysis
With a Hamilton syringe, 30 μl of 20 mg/ml methoxyamine hydrochloride (Sigma Aldrich) dissolved in pyridine was added to the dried aqueous metabolites. The heart tissue samples were vortexed and placed in a 30°C oven for 90 min. Then 70 μl of BSTFA + TMCS in pyridine was added and the samples were vortexed and placed in a 60 °C oven for 60 min.
For GC × GC – TOFMS analysis, 1 μl of sample extract was injected without a split by an autosampler equipped Agilent 6890 gas chromatograph (Agilent Technologies, Palo Alto, CA, USA). The gas chromatograph was modified with a 4D thermal modulator (LECO Corp., St. Joseph, MI, USA) that transfers effluent from the primary column (20 m × 250 μm i.d. × 0.5 μm Rtx-5MS, Restek, Bellefonte, PA, USA) to the secondary column (2 m × 180 μm i.d. × 2 μm Rtx 200MS, Restek, Bellefonte, PA, USA). The modulation period, the time between two episodes that effluent from the primary column is cryogenically frozen, thermally desorbed, injected, and separated in secondary column, was 1.5 s. The temperature program for primary column began at 60 °C for 0.25 min and then ramped at 8 °C/min to a final temperature of 280 °C. The temperature program for the secondary column was the same, except that it was consistently held 10 °C higher than primary column. The carrier gas was helium at a volumetric flow rate of 1 ml/min. The GC × GC was coupled to a Leco Pegasus III TOFMS (Leco Corp., St. Joseph, MI, USA). Ions were generated within the TOFMS by electron impact ionization and collected from mass channels of m/z 40 to m/z 600 at an acquisition rate of 100 spectra/s. Data were collected by LECO ChromaTOF software version 3.32 (LECO Corp., St. Joseph, MI, USA).
2.2 Data Analysis
LECO’s ChromaTOF software v 3.32 (St. Joseph, MI, USA) was used to collect GC × GC–TOFMS data. Metabolite identification was determined by mass spectral match value and retention time similarity with metabolite standards. Peak signals for relative quantification and precision analysis were attained for each metabolite using a target PARAFAC GUI [19, 20] developed in-house. The in-house software imports the raw data collected with ChromaTOF v 3.32 and deconvolutes the pure component chromatographic peak profile and the pure mass spectrum of an individual metabolite from overlapping peaks and background noise for quantification. The PARAFAC software provides baseline correction, because the baseline noise and the chromatographic peak signal profiles of target metabolites as well as any interference (in both chromatographic dimensions) are deconvoluted.
3. Results and Discussion
A representative GC × GC – TOFMS chromatogram from the aqueous fraction of 20 mg of heart tissue extracted by 1200 μl chloroform and 800 μl equal parts methanol:water (by volume) is shown in Fig. 3. The single ion 2D chromatogram at m/z 73 is used to show those metabolites that contained trimethylsilyl groups from derivatization. Hundreds of metabolites are detected. Evaluation of the complexity of this type of sample benefits from using the two separation dimensions provided by GC × GC. There are many metabolites that would be overlapped if only a single dimension of GC were used. Because of the secondary column, a larger number of metabolites can be separated in the 2D space, relative to only one dimension.
Figure 3.
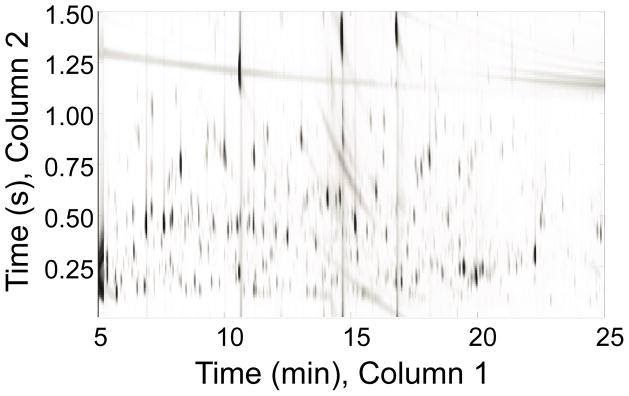
A representative GC × GC – TOFMS chromatogram at m/z 73 from a single heart tissue sample is presented, showing all trimethylsilated metabolites from the derivatization of the aqueous layer of the extraction of 20 mg of mouse heart tissue.
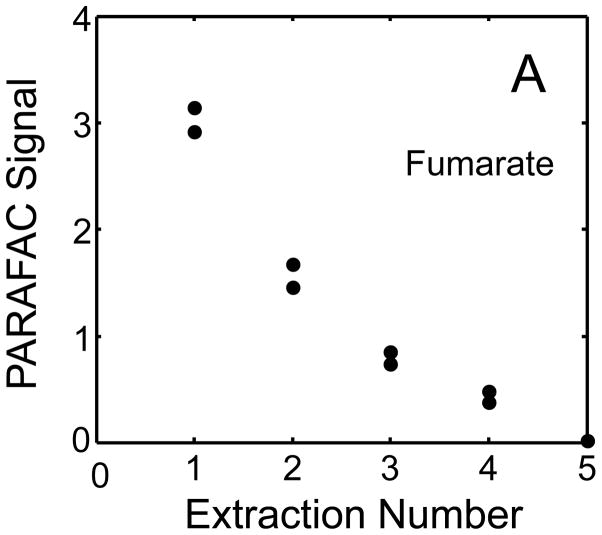
In early experiments with heart tissue, we encountered questionable quantitative results and we suspected that the extraction solvent conditions were suffering from saturation of some metabolites due to the small extraction volumes used. We designed an experiment to recursively extract mouse heart tissue to see how much metabolite remained unextracted after initial extraction, and found that a few metabolites remained in the two phases (chloroform and tissue pellet) after initial extraction (i.e., the recursive extraction experiment). Indeed, extraction of fumarate from ~ 40 mg of heart tissue gave the same peak signal as extracting ~ 20 mg of heart tissue when extracted in 600 μl chloroform and 400 μl equal parts methanol:water (data not shown for brevity).
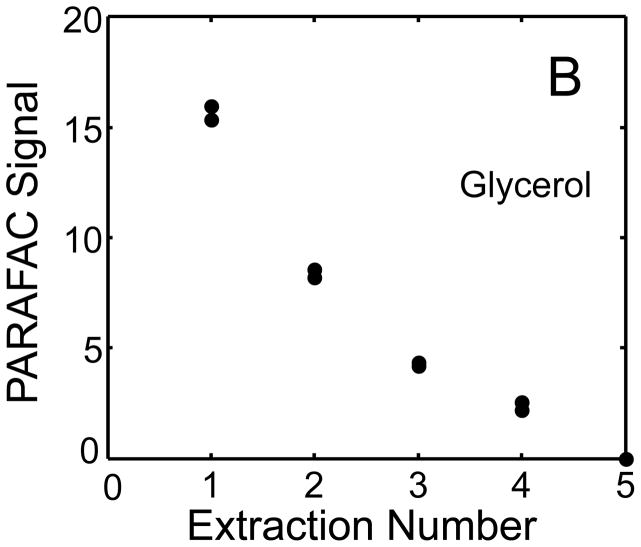
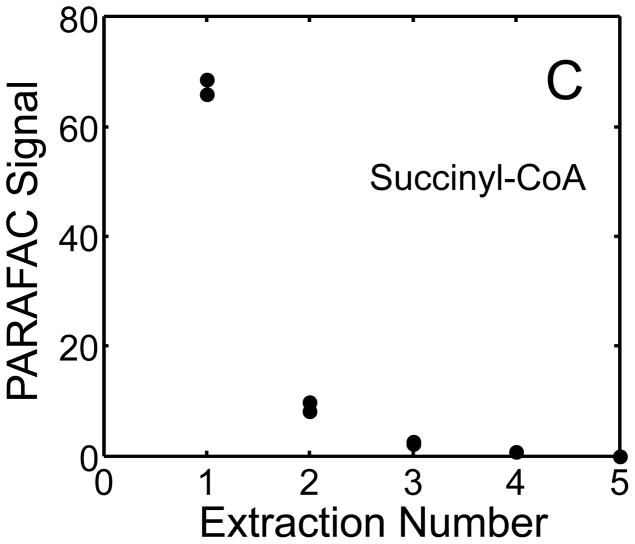
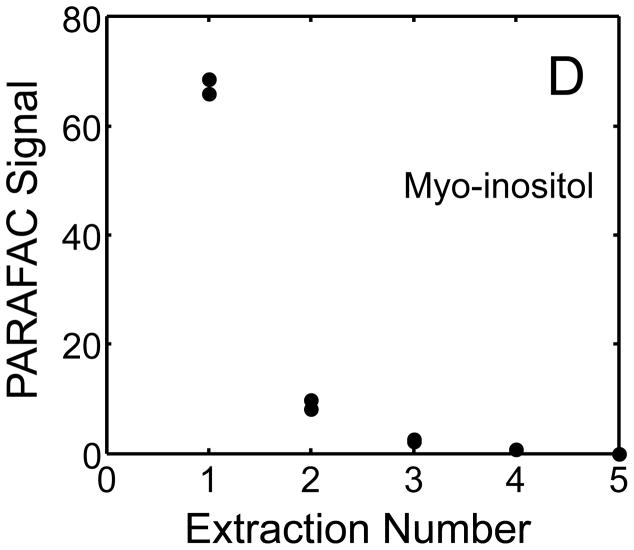
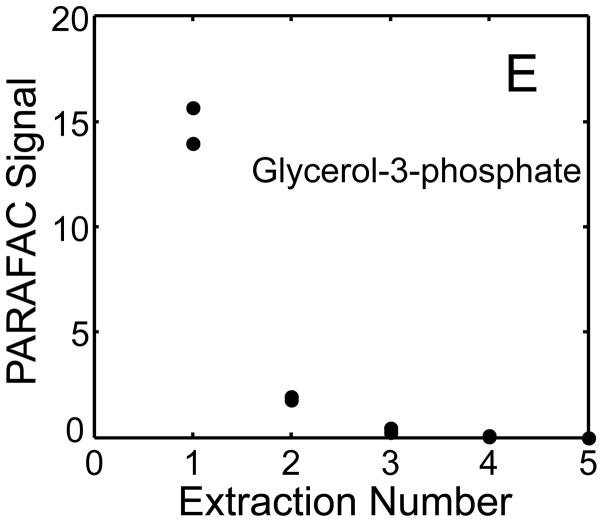
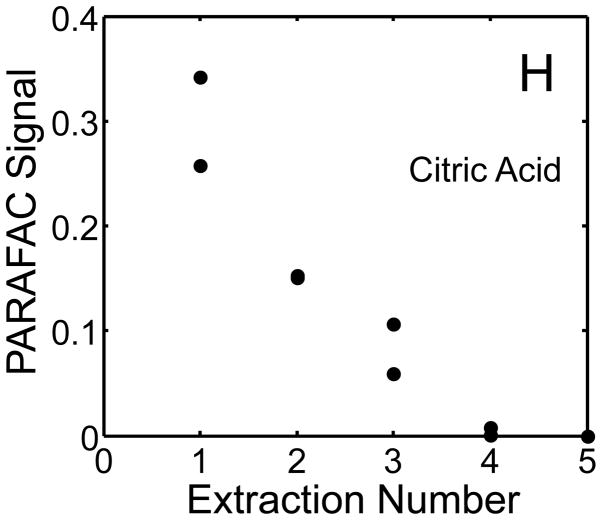
The metabolite signals for eight representative metabolites from PARAFAC signal deconvolution of each aqueous extract by applying the recursive extraction experiment (Fig. 1) are shown in Fig. 4. Fumarate, glycerol, and citric acid all show that ~ 50% of the peak signal recovered from the initial extraction (40 mg in 600 μl organic and 400 μl aqueous phases) was still left in the heart tissue or organic layer after the second addition of methanol:water. Many analytes did not show this dramatic under-extraction with the lower solvent volume conditions. Approximately 10% of the metabolite signal recovered from the initial extraction was recovered with a subsequent extraction of the metabolites succinyl-CoA, myo-inositol, glutamate, malate, and glycerol-3-phosphate. These results, combined with pilot experimental observation, confirmed our hypothesis that metabolite extraction was generally incomplete for the conditions employed in the recursive extraction experiment. The cause for incomplete extraction was possibly due to saturation of the aqueous solvent, and required further experimentation to establish a reproducible quantitative extraction protocol. The use of ~ 40 mg in 600 μl organic and 400 μl aqueous was quantitatively adequate for certain metabolites (providing acceptable precision and accuracy). However, these initial solvent extraction conditions would not be acceptable for experiments aimed at the relative quantification and concentration comparison of fumarate, glycerol, and citric acid in multiple heart samples, because the extent of extraction, and thus metabolite signal, was limited by the amount of solvent used, and not reflective of the metabolite concentration in the tissue.
Figure 4.
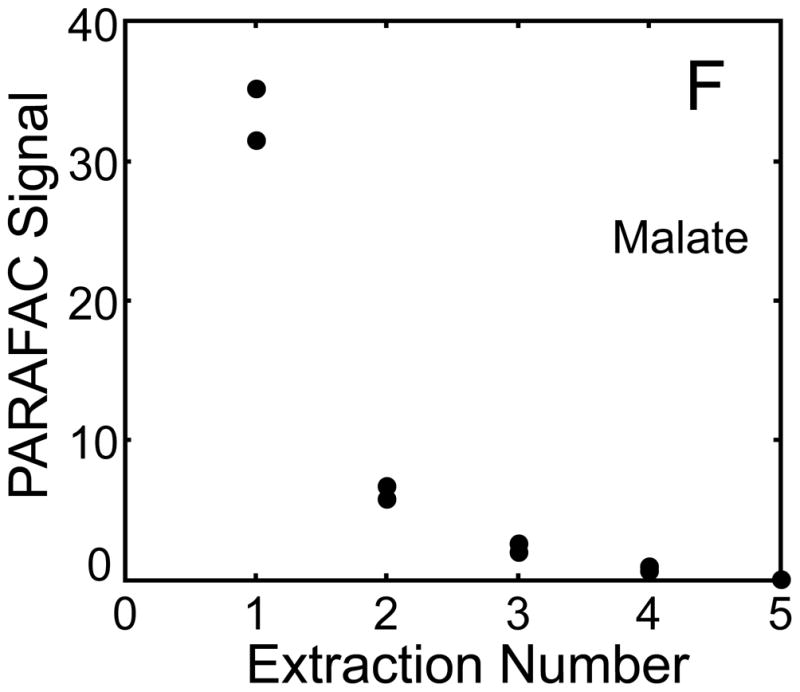
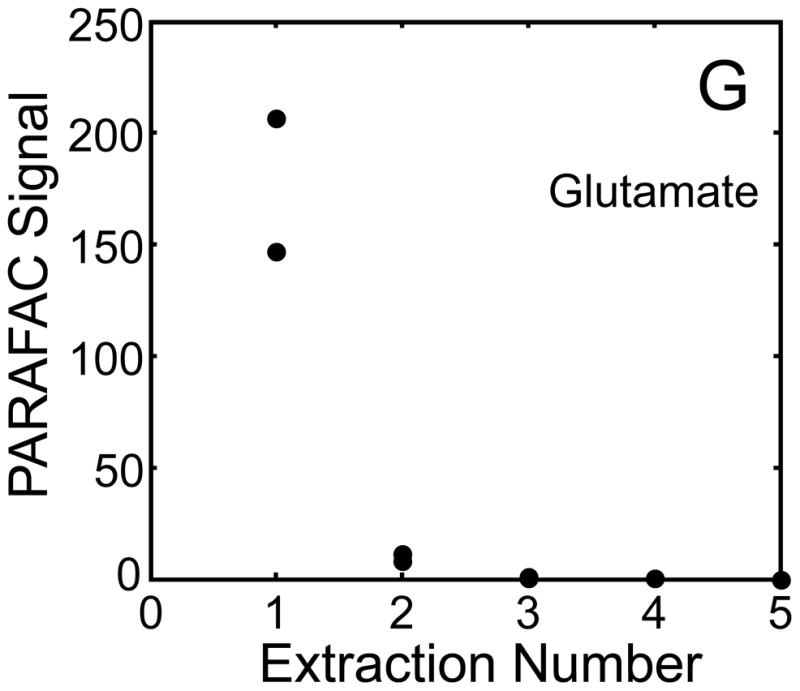
Representative quantitative results of the recursive extraction experiment (using procedure outlined in Fig. 1) of ~ 40 mg of heart tissue are shown. Replicate injections of each recursive extraction are shown. Signal for each metabolite was determined using PARAFAC signal deconvolution software [20,21]. The actual PARAFAC signals have been scaled down by a factor of 100,000 for clarity.
Extracting ~ 40 mg of heart sample in 600 μl organic and 400 μl aqueous was not the appropriate heart mass and/or solvent volume conditions to provide a comprehensive extraction of all metabolites for relative quantification—even though it was acceptable for some metabolites. Therefore, we performed a tissue mass calibration experiment, employing heart mass and extraction solvent conditions whereby the amount of metabolite extracted could be shown to be representative of the amount of metabolite in the heart tissue. Based on the recursive extraction experiment we hypothesized that doubling the solvent volumes used would sufficiently dilute previously saturated metabolites, while not diluting too many low signal-to-noise analytes as to make them undetectable. Therefore, following the tissue mass calibration experimental procedure outlined in Fig. 2, three heart samples were cut into four decreasing mass pieces (nominally 40 mg, 20 mg, 10 mg, and 5 mg), and extracted with 1200 μl chloroform and 800 μl equal parts methanol:water (twice the amount of solvent used relative to the recursive extraction experiment).
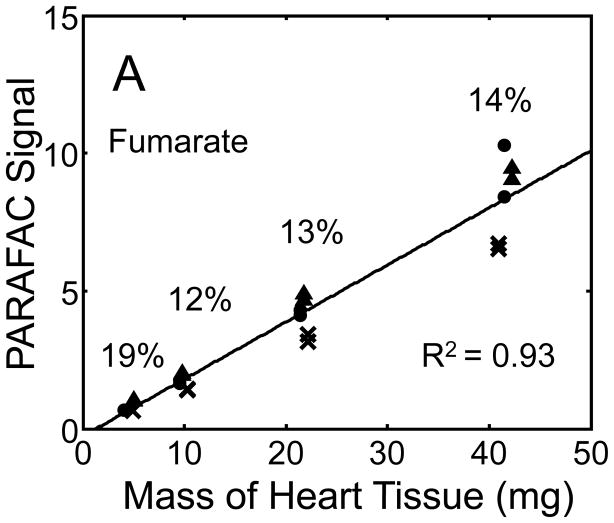
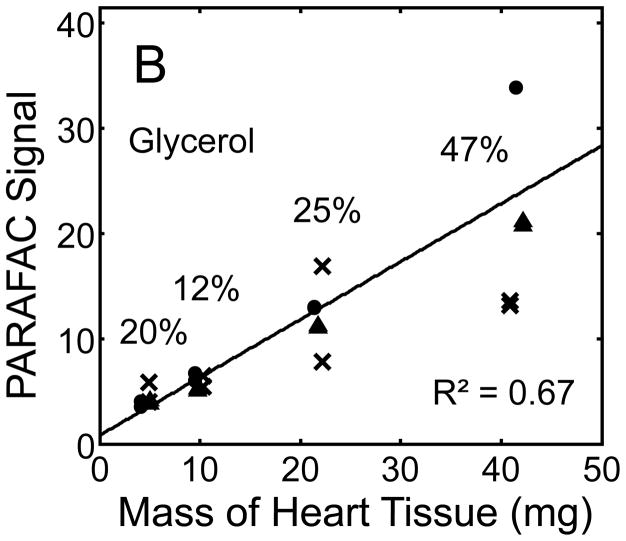
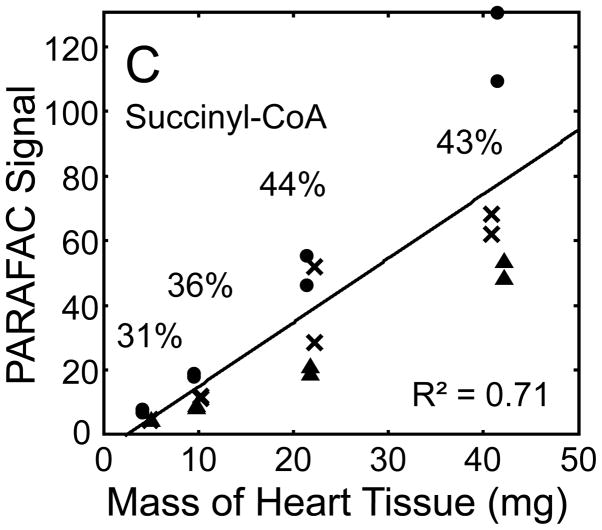
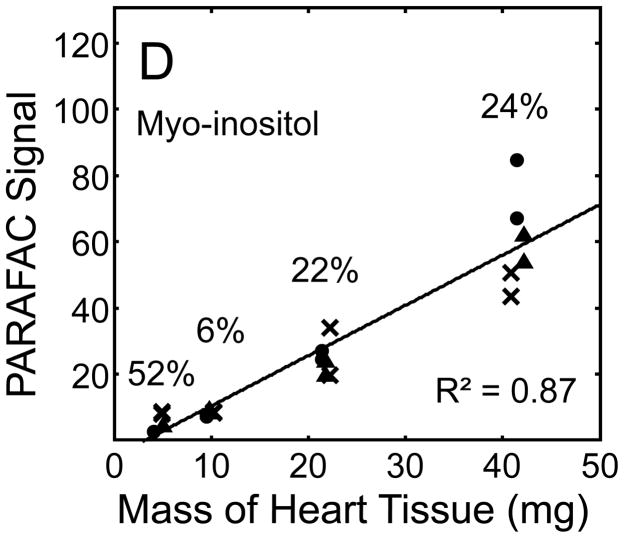
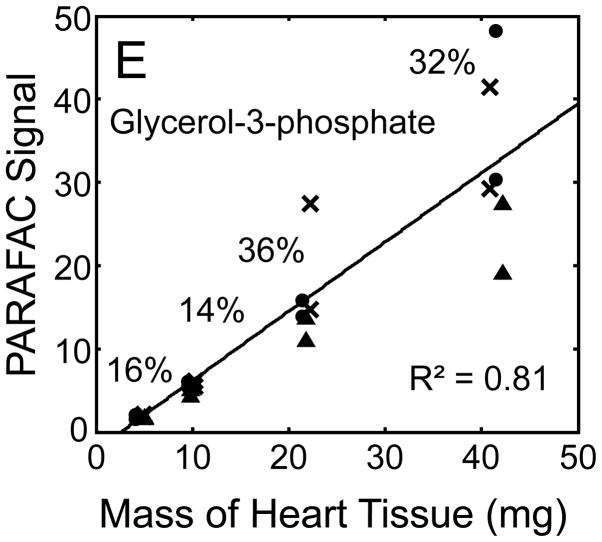
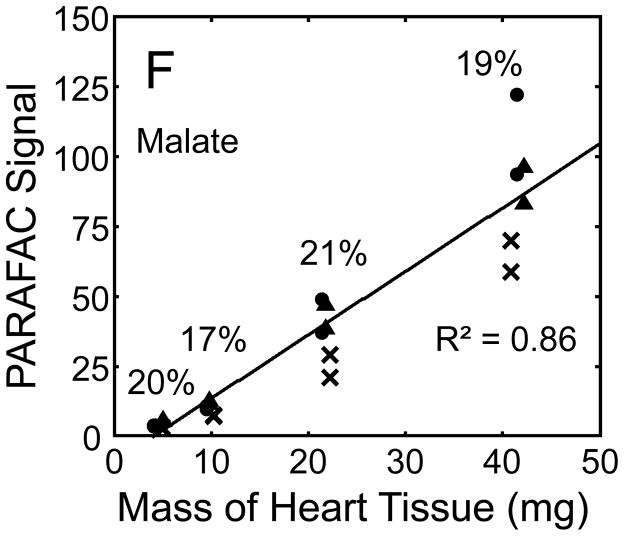
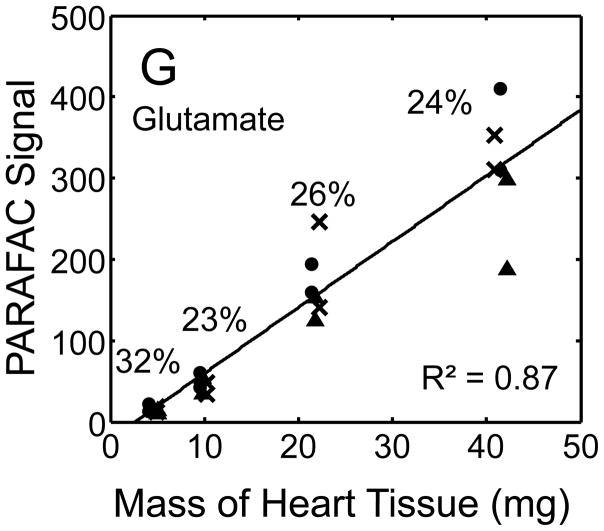
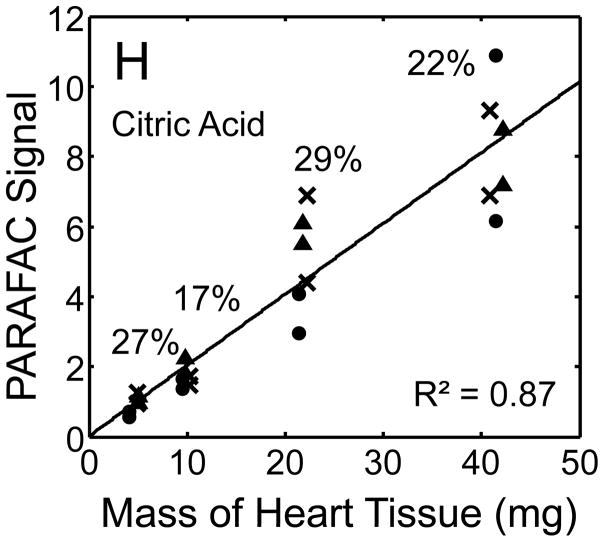
Quantitative results for the eight representative metabolites following the tissue mass calibration experiment (Fig. 2) are shown in Fig. 5. Four different masses of heart tissue from three different hearts are shown (exact masses plotted, with duplicate injections of each piece of heart). Signal for each metabolite was determined based upon PARAFAC signal deconvolution software [19, 20] and a linear relationship between the mass of heart extracted and the signal detected for each metabolite was evaluated using the Pearson’s correlation coefficient (by Microsoft Excel 2010). The linearity of response of metabolite signal after PARAFAC deconvolution of the eight representative metabolites is of paramount importance for the future relative quantification of these metabolites. The relative standard deviation (RSD) as a percent is reported for the four mass groupings across the three heart tissue samples, and is dominated by the biological variation for a given metabolite at each mass. For each of the eight representative metabolites, doubling the amount of solvent used previously is demonstrated in Fig. 5 to provide good linear calibration and thus confidence that the metabolite signal observed by extraction, derivatization, and GC x GC –TOFMS analysis is indicative of the concentration of metabolite in heart tissue. Notably, the previously saturated fumarate, glycerol, and citric acid now calibrate signal to mass of the heart tissue, solving our initial problem outlined in the recursive extraction experiment. The calibration plots in Fig. 5 of signal as a function of the heart mass suggest that no saturation effects are seen in the extracts utilizing 2 ml (1200 μl organic phase (chloroform) and 800 μl aqueous phase (methanol: water in equal parts by volume)). In addition, the total amount of metabolite extracted from 40 mg of heart tissue analyzed in the mass calibration experiment is equal or greater to the amount extracted by the sum of all the recursive extractions, as inferred by a comparison of signals in Figures 4 and 5. For example, the total summed PARAFAC signal in Fig. 4(A) for fumarate from every extraction of a 40 mg portion of heart in the recursive extraction experiment is about 6 (arbitrary signal units), while the extraction of 40 mg of heart in 2 ml using the optimized condition in the mass calibration experiment in Fig. 5(A) results in a PARAFAC signal ranging from about 6 to10 (with the range a result of the biological variation). We were confident that by doubling the amount of solvent used (to 1200 μl chloroform and 800 μl equal parts methanol:water), all other metabolites should also be quantitative, because fumarate, glycerol, and citric acid are of similar signal to other high, medium, and low (respectively) intensity metabolite signals in the full 2D chromatogram.
Figure 5.
Quantitative results for the eight representative metabolites following the tissue mass calibration experiment (using procedure outlined in Fig. 2) based upon extracting four different masses of heart tissue from three different hearts is shown. Different hearts are shown as different symbols. Duplicate injections of each piece of heart were analyzed. Signal for each metabolite was determined using PARAFAC software [20, 21]. The linear relationship between the mass of heart extracted and the signal detected for each metabolite is provided. The PARAFAC signals have been scaled down by 100,000 for clarity. The biological variation across six injections (three mice) is indicated as the RSD for each grouping of heart tissue masses (masses varied less than 4% RSD for each group). Linear regression is shown with Pearson’s correlation coefficient, with results indicating good linearity. The high residuals and low correlation coefficient observed is dominated by the biological variation. Linearity was also observed for many other metabolites (not shown for brevity).
For the mass tissue calibration experiment, the Pearson’s correlation coefficient is 0.71 and 0.67 for succinyl-CoA and glycerol respectively, because of large residuals caused by biological variation, where the injection variation for the method is demonstrated by duplicate injections in Fig. 5, and was determined to be ~ 10%RSD which is consistent with similar methodology applied with this instrumentation [10]. The biological variation observed across most metabolites (20–30% RSD) is comparable to GC × GC – TOFMS analysis of other mammalian tissues, but should be analyzed for more metabolites to determine if use of this sample preparation method in the future will detect statistically significant changes in metabolism [1–6]. Overall, the biological variation dominates over the method variation.
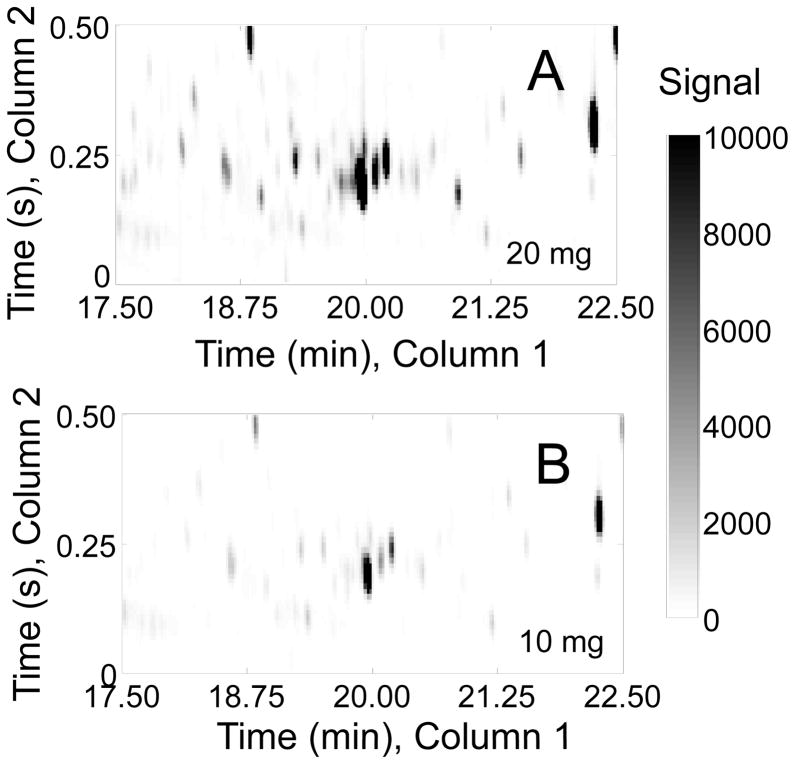
Finally, a reproducibility experiment for the extraction method was performed with ten mice, to assess the added effect of biological variation, by extracting ~ 20 mg of heart tissue in 1200 μl organic and 800 μl aqueous phases and quantifying each metabolite peak signal after PARAFAC deconvolution and relative quantification of targeted metabolites. Here we were applying the sample preparation method outlined in Fig. 2 that yielded the acceptable results in Fig. 5. A mass of ~ 20 mg was used for two reasons. It represents an adequate sample from the heart tissue, as 20 mg falls in the middle of the mass range used for the tissue mass calibration experiment and thus is demonstrated to not suffer from saturation since signal linearly correlates with mass (see plots in Fig. 5), and many metabolite signals are not readily visible when only 10 mg of tissue are used (see Fig. 6). For the GC × GC – TOFMS separations, the primary column retention times and secondary column retention times are reported in Table 1, along with the PARAFAC deconvoluted peak signal precision (RSD) of each metabolite across ten different mice. An average RSD of 20–30% is typical for mammalian tissues and is sufficiently small to find small (biologically relevant) differences between samples with adequate sample size and has been used for the evaluation of metabolomic changes under pressure overload hypertrophy in a cardiac-specific acetyl-CoA carboxylase isoform 2 knockout mouse model [12].
Figure 6.
A zoomed in section of two GC × GC chromatograms from the mass calibration experiment is shown, plotting m/z 73 showing all trimethylsilated metabolites from the derivatization of the aqueous layer of two pieces of heart tissue from the same mouse. The two GC × GC chromatograms are from (A) 20 mg of heart tissue and (B) 10 mg of heart tissue from the same mouse extracted in 1200 μl chloroform and 800 μl methanol:water (1:1 by volume). Some important metabolite signals are not readily visible if only 10 mg is used.
Table 1.
For the reproducibility experiment with the analysis of ten mice, a subset of metabolite identifications are provided in the extraction of ~ 20 mg of heart tissue in 1200 μl chloroform and 800 μl methanol:water (1:1 by volume). Metabolite signals for the determination of quantitative precision (RSD) were calculated after signal deconvolution by PARAFAC.
| Metabolite | Column 1 Retention Time (s) | Column 2 Retention Time (s) | Quantitative Precision Detected Signal (RSD) |
|---|---|---|---|
| lactate | 481.5 | 0.41 | 21 % |
| glucose | 1278 | 0.21 | 40 % |
| fumarate | 778.5 | 0.69 | 15 % |
| malate | 922.5 | 0.48 | 19 % |
| succinate | 711 | 0.90 | 47 % |
| succinyl-CoA | 747 | 0.62 | 39 % |
| myo-inositol | 1422 | 0.28 | 26 % |
| coenzyme A | 633 | 1.20 | 11 % |
| glycerol | 633 | 0.21 | 26 % |
| glycerol-3-phosphate | 1084.5 | 0.77 | 25 % |
| glucose-1-phosphate | 1194 | 0.20 | 27 % |
| glutamate | 877 | 1.41 | 26 % |
| citric acid | 1130 | 0.47 | 24 % |
| serine | 615 | 0.71 | 27% |
| thiamine diphosphate | 747 | 0.71 | 14% |
| nicotinamide adenine dinucleotide | 1281 | 0.85 | 39% |
| uracil | 699 | 0.40 | 24% |
4. Conclusions
The investigation of mammalian metabolism in a variety of tissues by GC × GC – TOFMS has been successfully performed and reported in the literature, but the preparation and metabolomics analysis of heart tissue by GC x GC – TOFMS has not yet been reported. We uncovered and addressed a few critical issues and challenges in the sample preparation of heart tissue for derivatized GC × GC – TOFMS. In particular, we discovered that particular metabolites were saturating the extraction solvent and thus we needed to calibrate the tissue mass and extraction solvent volume to the resulting metabolite signal.
The experimental optimization of mouse heart tissue extraction was performed herein. A recursive extraction experiment demonstrated that the metabolites fumarate, glycerol, and citric acid suffer from incomplete extraction and possible extraction solvent saturation if ~ 40 mg of heart tissue is used in a total volume of 1 ml of extraction solvent (using 600 μl chloroform and 400 μl 1:1 methanol:water). A tissue mass calibration experiment using twice the amount of solvent used in primary extraction of the recursive extraction experiment demonstrated the effective dilution and subsequent successful relative quantification of eight metabolites, including the previously saturated fumarate, glycerol, and citric acid. Finally, the use of ~ 20 mg of heart tissue extracted in 1200 μl chloroform and 800 μl 1:1 methanol:water was successful for the comprehensive relative quantification of the heart tissue metabolome. The method’s variation including biological variation, extraction variation, and comprehensive GC x GC – TOFMS instrumental variation, is reported herein (an average RSD of 20–30%). Recently, this RSD level allowed us to detect biologically relevant metabolite changes due to genetic differences in the response to pressure overload hypertrophy [12].
Highlights.
Heart tissue extraction was optimized for metabolomics analysis with GC x GC-TOFMS.
A recursive extraction experiment indicated careful selection of conditions was needed.
Several metabolites were targeted from various compounds classes.
Biological variation was assessed using 10 heart tissue samples, of 20 mg each.
Acknowledgments
This work was supported by NIH grants HL059246, HL067970 (to RT), and HL096284 (to SK).
Footnotes
Publisher's Disclaimer: This is a PDF file of an unedited manuscript that has been accepted for publication. As a service to our customers we are providing this early version of the manuscript. The manuscript will undergo copyediting, typesetting, and review of the resulting proof before it is published in its final citable form. Please note that during the production process errors may be discovered which could affect the content, and all legal disclaimers that apply to the journal pertain.
References
- 1.Snyder LR, Hoggard JC, Montine TJ, Synovec RE. J Chromatogr A. 2010;1217:4639–4647. doi: 10.1016/j.chroma.2010.04.065. [DOI] [PMC free article] [PubMed] [Google Scholar]
- 2.Snyder LR, Cruz-Aguado R, Sadilek M, Galasko D, Shaw CA, Montine TJ. Toxicol Appl Pharmacol. 2009;240:180–188. doi: 10.1016/j.taap.2009.06.025. [DOI] [PMC free article] [PubMed] [Google Scholar]
- 3.Rocha SM, Caldeira M, Carrola J, Santos M, Cruz N, Duarte IF. J Chromatogr A. 2012;1252:155–163. doi: 10.1016/j.chroma.2012.06.067. [DOI] [PubMed] [Google Scholar]
- 4.Beckstrom A, Humston E, Snyder L, Synovec R, Juul S. J Chromatogr A. 2011;1218:1899–1906. doi: 10.1016/j.chroma.2011.01.086. [DOI] [PMC free article] [PubMed] [Google Scholar]
- 5.Beckstrom AC, Tanya P, Humston EM, Snyder LR, Synovec RE, Juul SE. Pediatr Res. 2012;71:338–344. doi: 10.1038/pr.2011.74. [DOI] [PMC free article] [PubMed] [Google Scholar]
- 6.Welthagen W, Shellie RA, Spranger J, Ristow M, Zimmermann R, Fiehn O. Metabolomics. 2005;1:65–73. doi: 10.1016/j.chroma.2005.05.088. [DOI] [PubMed] [Google Scholar]
- 7.Humston EM, Dombek KM, Hoggard JC, Young ET, Synovec RE. Anal Chem. 2008;80:8002–8011. doi: 10.1021/ac800998j. [DOI] [PMC free article] [PubMed] [Google Scholar]
- 8.Humston EM, Dombek KM, Tu BP, Young ET, Synovec RE. Anal Bioanal Chem. 2011;401:2387–2402. doi: 10.1007/s00216-011-4800-2. [DOI] [PMC free article] [PubMed] [Google Scholar]
- 9.Mohler RE, Tu BP, Dombek KM, Hoggard JC, Young ET, Synovec RE. J Chromatogr A. 2008;1186:401–411. doi: 10.1016/j.chroma.2007.10.063. [DOI] [PMC free article] [PubMed] [Google Scholar]
- 10.Mohler RE, Dombek KM, Hoggard JC, Pierce KM, Young ET, Synovec RE. Analyst. 2007;132:756–767. doi: 10.1039/b700061h. [DOI] [PubMed] [Google Scholar]
- 11.Yang S, Sadilek M, Synovec RE, Lidstrom ME. J Chromatogr A. 2009;1216:3280–3289. doi: 10.1016/j.chroma.2009.02.030. [DOI] [PMC free article] [PubMed] [Google Scholar]
- 12.Kolwicz SC, Olson DP, Marney LC, Garcia-Menendez L, Synovec RE, Tian R. Circ Res. 2012;111:728–738. doi: 10.1161/CIRCRESAHA.112.268128. [DOI] [PMC free article] [PubMed] [Google Scholar]
- 13.Dyck JRB, Hopkins TA, Bonnet S, Michelakis ED, Young ME, Watanabe M, Kawase Y, Kawase Y, Jishage K, Lopaschuk G. Circulation. 2006;114:1721–1728. doi: 10.1161/CIRCULATIONAHA.106.642009. [DOI] [PubMed] [Google Scholar]
- 14.Koves TR, Ussher JR, Noland RC, Slentz D, Mosedale M, Ilkayeva O, Bain J, Stevens R, Dyck J, Newgard C, Lopaschuk G. D Muoio Cell Metab. 2008;7:45–56. doi: 10.1016/j.cmet.2007.10.013. [DOI] [PubMed] [Google Scholar]
- 15.Lopaschuk GD, Wambolt RB, Barr RL. J Pharmacol Exp Ther. 1993;264:135–144. [PubMed] [Google Scholar]
- 16.Lopaschuk GD, Witters LA, Itoi T, Barr R, Barr A. J Biol Chem. 1994;269:25871–25878. [PubMed] [Google Scholar]
- 17.Saddik M, Gamble J, Witters LA, Lopaschuk GD. Journal of Biological chemistry. 1993;268:25836–25845. [PubMed] [Google Scholar]
- 18.Dyck JRB, Hopkins TA, Bonnet S, Michelakis ED, Young ME, Watanabe M, Kawase Y, Jishage K. G Lopaschuk Circulation. 2006;114:1721–1728. doi: 10.1161/CIRCULATIONAHA.106.642009. [DOI] [PubMed] [Google Scholar]
- 19.Hoggard JC, Siegler WC, Synovec RE. J Chemom. 2009;23:421–431. [Google Scholar]
- 20.Hoggard JC, Synovec RE. Anal Chem. 2007;79:1611–1619. doi: 10.1021/ac061710b. [DOI] [PubMed] [Google Scholar]


