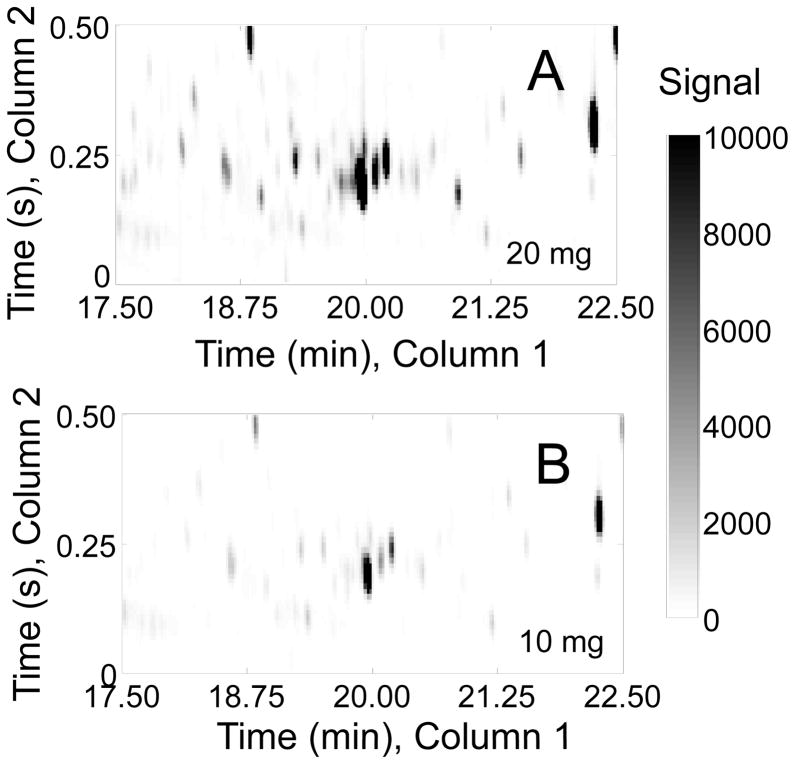
Figure 6.
A zoomed in section of two GC × GC chromatograms from the mass calibration experiment is shown, plotting m/z 73 showing all trimethylsilated metabolites from the derivatization of the aqueous layer of two pieces of heart tissue from the same mouse. The two GC × GC chromatograms are from (A) 20 mg of heart tissue and (B) 10 mg of heart tissue from the same mouse extracted in 1200 μl chloroform and 800 μl methanol:water (1:1 by volume). Some important metabolite signals are not readily visible if only 10 mg is used.

