

Abstract
The release of neurotransmitter via the fusion of transmitter-filled, presynaptic vesicles is the primary means by which neurons relay information. However, little is known regarding the molecular mechanisms that supply neurotransmitter destined for vesicle filling, the endogenous transmitter concentrations inside presynaptic nerve terminals, or the dynamics of vesicle refilling after exocytosis. We addressed these issues by recording from synaptically coupled pairs of glycine/GABA coreleasing interneurons (cartwheel cells) of the mouse dorsal cochlear nucleus. We find that the plasma membrane transporter GlyT2 and the intracellular enzyme glutamate decarboxylase supply the majority of glycine and GABA, respectively. Pharmacological block of GlyT2 or glutamate decarboxylase led to rapid and complete rundown of transmission, whereas increasing GABA synthesis via intracellular glutamate uncaging dramatically potentiated GABA release within 1 min. These effects were surprisingly independent of exocytosis, indicating that prefilled vesicles re-equilibrated upon acute changes in cytosolic transmitter. Titration of cytosolic transmitter with postsynaptic responses indicated that endogenous, nonvesicular glycine/GABA levels in nerve terminals are 5–7 mm, and that vesicular transport mechanisms are not saturated under basal conditions. Thus, cytosolic transmitter levels dynamically set the strength of inhibitory synapses in a release-independent manner.
Introduction
Synaptic vesicles express transporters that drive transmitter accumulation by exploiting a transvesicular voltage and/or pH gradient set by the vesicular ATPase (Edwards, 2007). Cytosolic transmitter levels in nerve terminals must therefore be sufficiently concentrated to permit fast and efficient refilling of recycling vesicles. Indeed, the local cytosolic concentration should determine the rate and extent of vesicle filling, thereby controlling the size of the “quantum” of transmission (Edwards, 2007; Hori and Takahashi, 2012). However, the endogenous cytosolic concentration of most neurotransmitters is unknown, and despite its theoretical importance (Axmacher et al., 2004), the extent to which cytoplasmic transmitter levels impact vesicle filling is also unknown.
A related issue is whether vesicles retain their contents until release, or if prefilled vesicles re-equilibrate upon acute changes in cytosolic transmitter independently of exocytosis. Isolated vesicles in certain biochemical experiments leak transmitter in absence of extralumenal substrate, suggesting that vesicle content may turn over rapidly (Burger et al., 1991; Floor et al., 1995). If such a leak were prominent in situ, vesicles would need to refill in the absence of activity; the amount of transmitter inside a vesicle would then reflect a “dynamic equilibrium” between transporter rates and leak (Williams, 1997; Edwards, 2007). This model predicts that changes in cytosolic transmitter will be rapidly mirrored as changes in vesicle filling, even at quiescent synapses. In contrast, studies at peripheral cholinergic synapses suggest that prefilled vesicles are “sealed off” and only exchange their contents after exocytosis, implying that changes in cytosolic transmitter will affect synaptic strength only after prolonged activity (Cabeza and Collier, 1988; Van der Kloot, 2003).
These questions are particularly important for inhibitory glycinergic and GABAergic synapses. The sole transporter responsible for packaging both glycine and GABA into vesicles, VGAT, has a particularly low affinity for its substrates (Km = 5–10 mm; Christensen et al., 1990; McIntire et al., 1997). Previous studies suggest that nerve terminal transmitter may reach up to 20–40 mm for glycine (Supplisson and Roux, 2002) or 50–150 mm for GABA (Fonnum and Walberg, 1973). However, these values would saturate VGAT-mediated uptake (Christensen et al., 1990), implying that fluctuations in cytosolic transmitter will have little effect on vesicle filling even in the presence of a nonspecific leak.
We addressed these issues in acute brain slices by identifying the mechanisms that supply cytosolic transmitter in synaptically coupled pairs of glycine/GABA coreleasing cartwheel interneurons of the dorsal cochlear nucleus (DCN). These short-axon cells (Bender and Trussell, 2009) allowed us to manipulate the presynaptic cytosol and examine the control mechanisms for two major transmitter systems in an identified, homogenous cell population. We show that GlyT2 and glutamate decarboxylase (GAD) supply the majority of glycine and GABA, respectively. Endogenous cytosolic glycine/GABA levels are in the low millimolar range and do not saturate vesicular transporters. Blocking GlyT2 or GAD, or acutely enhancing GAD activity, regulates transmission independently of the level of ongoing exocytosis. Thus prefilled, release-ready vesicles in nerve terminals re-equilibrate their contents upon changes in cytosolic transmitter, thereby implicating transmitter supply mechanisms as critical loci for regulating inhibitory synaptic strength.
Materials and Methods
Slice preparation.
All procedures involving animals were approved by Oregon Health and Science University's Institutional Animal Care and Use Committee. Wild-type mice of either sex (C57BL/6 or CBA) postnatal 15–24 d were used for the majority of the experiments. Optogenetic experiments were performed on GlyT2-cre transgenic mice (MMRRC Tg(Slc6a5-cre)KF109Gsat/Mmucd) containing a single copy of the cre transgene. Mice were anesthetized with isoflurane, decapitated, and 210–230 μm coronal slices of the DCN were cut in ice-cold solution containing the following (in mm): 87 NaCl, 25 NaHCO3, 25 glucose, 75 sucrose, 2.5 KCl, 1.25 NaH2PO4, 0.5 CaCl2, and 7 MgCl2, and bubbled with 5% CO2/95% O2. After cutting, slices were allowed to recover at 34°C in an artificial CSF (ACSF) solution containing the following (in mm): 130 NaCl, 2.1 KCl, 1.7 CaCl2, 1 MgSO4, 1.2 KH2PO4, 20 NaHCO3, 3 Na-HEPES, and 10–12 glucose, bubbled with 5% CO2/95% O2 (300–310 mOsm). In some experiments, 5 μm R-CPP or 50 μm D-APV were added to the incubation chamber. After a 30–45 min recovery period, slices were kept at room temperature (∼22°C) until recording. Experiments were typically performed within 5 h of slice preparation.
Electrophysiology.
Slices were transferred to a recording chamber and continuously perfused at 3–4 ml/min with ACSF heated to 31−33°C by an inline heater. IPSCs were isolated by blocking excitatory transmission with 10 μm NBQX and 5 μm R-CPP (or 50 μm D-APV) in all experiments. Neurons were visualized by Dodt contrast optics with a 40× objective on an upright microscope (Zeiss Axioskop2). Cartwheel cells were identified by previously published criteria (Roberts et al., 2008; Bender and Trussell, 2009; Kuo and Trussell, 2011). The presynaptic pipette solution contained the following (in mm): 15.5 KCl, 105 K-gluconate, 4.8 MgCl2, 4 ATP, 0.5 Tris-GTP, 14 Tris-phosphocreatine, 0.1 EGTA, and 10 HEPES, pH 7.25 with KOH, ∼290 mOsm. This solution was used for most postsynaptic recordings in Figures 1–4, yielding an ECl of −44 mV at 32°C. In most experiments in Figures 5–8, postsynaptic cells were filled with an internal solution containing the following (in mm): 94.5 CsMeSO3, 5 TEA-Cl, 5 QX314, 15.5 CsCl, 4.8 MgCl2, 4 ATP, 0.5 GTP, 14 Tris-phosphocreatine, 0.1 EGTA, and 10 HEPES (ECl = −36 mV). For miniature IPSC (mIPSC) recordings and the majority of glutamate uncaging experiments, CsMeSO3, QX314, and TEA-Cl were exchanged for 113 CsCl. For excised patch experiments, CsMeSO3 was replaced by 103 CsCl. In experiments where presynaptic neurons were dialyzed with exogenous GABA and for puff experiments in Figure 8, 3 μm CGP55845 was added to the ACSF to prevent activation of GABAB receptors by GABA ejected from the pipette during seal formation. Pipette resistances with a K+-based internal solution were typically 2–3 MΩ and 1.8–2.5 MΩ with the Cs+-based internal solution. For postsynaptic recordings, cells were held between −70 and −80 mV. In some experiments, cells were transiently hyperpolarized to −120 mV during presynaptic action potentials to increase the absolute amplitude of IPSCs. Series resistance of the postsynaptic cell (<15 MΩ) was compensated 60–80% “correction” and 90% “prediction” (bandwidth = 3 kHz) and experiments were not included if series resistance varied >20–25% over the course of the recording. Presynaptic cells were typically held between −70 and −80 mV in current-clamp. Action potentials were elicited every 15 s by positive current injection (0.8–1.5 nA, 1.5–2.5 ms) rapidly followed by negative current (between −0.5 and −1.5 nA, 100 ms) to prevent spike bursts. In some experiments, presynaptic cells were held in voltage-clamp and spikes were elicited by steps (20–100 μs) to −20 or −30 mV. Under these conditions, some cartwheel cells displayed a prominent autaptic IPSC with similar properties as paired recordings and thus were used for a minority of the data points (Fig. 2D, n = 1; Fig. 4; n = 2; Fig. 8; n = 1). For extracellular stimulation, voltage pulses (100–200 μs) were delivered once every 10–15 s through a bipolar theta-glass electrode placed in the vicinity of the recorded neuron. In experiments in Figure 4 where cells were dialyzed with exogenous glycine, SR95531 was applied >25 min after establishing a presynaptic whole-cell recording. For puff application experiments in Figure 8, glycine and GABA were dissolved in ACSF and pressure ejected (5 psi, 5–20 ms) near the soma. For excised patch experiments, solutions were loaded into separate barrels of a theta-glass pipette and pressure ejected (20–30 psi, 5–20 ms) near the patch. Glycine and GABA puffs were interleaved.
Figure 1.

Transmission between cartwheel cells is predominantly glycinergic. A, Example paired recording between synaptically connected cartwheel cells demonstrating that glycine is the main neurotransmitter at this synapse. Top, IPSC amplitude over time from a single experiment, showing IPSC block by the glycine receptor antagonist strychnine and the GABAA receptor antagonist SR95531. Bottom, Traces from this experiment, with a single presynaptic action potential and an overlay of 10 IPSCs evoked during baseline conditions (black), in the presence of 500 nm strychnine (blue), and in the presence of strychnine + 10 μm SR95531. Bottom gray traces show partial recovery of IPSCs during drug washout. B, Optogenetic activation of cartwheel cells. In a GlyT2-cre mouse injected with a ChR2 AAV virus, wide-field blue light flashes evoked bursts of IPSCs that were mostly blocked by strychnine, similar to paired recordings. Top, Time course of the experiment. Bottom, Example of sweeps evoked in different drug conditions. The color scheme is the same as in A. Blue line denotes approximate offset of a 20 ms light stimulus in this experiment. C, Summary data plotting the IPSC amplitude remaining in strychnine and SR95531 from paired recordings and optogenetic experiments. The percentage block by strychnine was not significantly different between the two datasets, showing that transmission between cartwheel cells is mainly glycinergic. Open circles are individual experiments. Red points are mean ± SEM. D, Individual mIPSCs recorded in the absence of inhibitory blockers and in the presence of pentobarbital + zolpidem (to prolong the decay of the GABAA component) display a spectrum of decay kinetics and can be classified into three basic categories: rapidly decaying and predominantly glycinergic events, slowly decaying events mediated by GABAA receptors, and a third population with both fast glycinergic and slow GABAergic decay components. E, The relative amplitude of the glycinergic and GABAergic components of mIPSCs was measured by force fitting the decay phase of individual events recorded in absence of inhibitory blockers with a double exponential function containing the average glycine and GABAA decay time constants recorded in the presence of SR95531 or strychnine (Jonas et al., 1998; Awatramani et al., 2005). The amplitude of the slow GABAA decay is plotted on the x-axis whereas the fast glycine component is plotted on the y-axis. The dashed gray lines represent the 2× SD for the amplitudes of glycine and GABAA decay components, and events falling above the cutoff for both glycine and GABAA amplitudes were classified as coreleasing glycine/GABA. On average, 19.3 ± 2.2% of events recorded in absence of inhibitory blockers were classified as mixed glycine/GABA mIPSCs (n = 14 cells). Data are from two separate cells. F, mIPSCs recorded from the same two cells as E, but after the addition of strychnine (blue points) or SR95531 (red points) in one or the other cell. The majority of mIPSCs fell below the 2× SD lines after blocking either GABAA or glycine receptors with SR95531 or strychnine. Inset shows the average glycinergic and GABAergic mIPSC recorded in SR95531 or strychnine, respectively. Note the similarity in kinetics to the pure glycine and GABA events recorded (D). G, Summary data from 14 experiments similar to D–F. Red points are mean ± SEM. ***p = 0.00001, paired t test.
Figure 2.

GlyT2 supplies the majority of glycine destined for filling of recycling vesicles. A–C, Bath application of the GlyT2 inhibitor ORG25543 causes a rapid and near complete rundown of glycinergic transmission independently of presynaptic activity. Left, Time course of rundown. Each data point is normalized mean ± SEM 3–9 individual experiments in A, 8–10 experiments in B, and 2–3 experiments in C. Right, Average of IPSCs from a single experiment evoked during baseline period (black) and after 25–30 min in ORG25543 (red trace). A, IPSCs were elicited at 0.07 Hz for the entirety of the experiment. B, Activity was suspended for the majority of drug application and transmission was periodically tested at ∼10 min intervals. The rundown in these “minimal activity” experiments was similar to the experiments in A. C, Presynaptic stimulation frequency was transiently increased from 0.07 to 2 Hz, eliciting between 572 and 600 action potentials during minute 3–8 of ORG25543 application. Upon returning to 0.07 Hz stimulation, IPSC rundown was not greater than in experiments from A and B. D, Summary showing the fraction remaining minutes 10–11 in experiments from A–C. No significant differences were found between the three conditions, demonstrating that presynaptic vesicle content equilibrates with cytosolic transmitter availability independently of exocytosis. Black dots represent values from individual experiments. Red is mean ± SEM. E, Adding exogenous glycine to the whole-cell internal solution occluded the rundown caused by GlyT2 block, showing that the ORG25543 effect was specifically due to loss of glycine availability in the presynaptic terminal. Right, Average IPSCs during baseline (black) and after 25–30 min in ORG25543 (red). Each time point is the normalized mean ± SEM from 4 to 6 individual experiments. F, Glycinergic transmission remains stable during whole-cell recordings with a glycine-free internal solution, showing that endogenous GlyT2 activity is sufficient to continuously fill synaptic vesicles even during prolonged dialysis. Right, Average IPSCs during minute 0–3 (black) and minute 35–40 (red). Each time point is the normalized mean ± SEM from 3 to 7 individual experiments.
Figure 3.

Rapid restoration of transmission in glycine-depleted cartwheel cells. A, Data from a single experiment where the slice was pre-incubated in 1 μm ORG25543 for ∼ 2 h. Glycinergic transmission was isolated with 10 μm SR95531. A pair of cartwheel cells was patched with an internal solution containing 10 mm glycine. Data collection at t = 0 began <1 min after breaking into the presynaptic cell. IPSC amplitudes rapidly increased during the first 20 min after break-in. Right, Example IPSCs (average of 4 sweeps per trace) at various times during presynaptic glycine dialysis. B, Average time course of transmission run up by presynaptic dialysis of 10 mm glycine in ORG25543-treated slices, similar to the experiment in A. T = 0 begins <2 min after presynaptic break-in. Data are normalized to the average IPSC amplitude at t = 20 min, and each data point is the normalized mean ± SEM 6–8 individual experiments.
Figure 4.

GlyT2 supplies ∼ 5 mm to presynaptic terminals. A, Cytosolic transmitter concentrations determine the degree of vesicle filling. Example average IPSCs evoked during baseline (10 μm SR95531) and after partial block of glycine receptors with 70 μm SR95531 (red traces) under endogenous conditions (control pairs and extracellular stimulation) and in paired recordings with experimentally determined concentrations of exogenous glycine. Far right trace shows results of a kinetic model for 4.95 mm peak cleft glycine and the relative amplitudes predicted for 10 and 70 μm SR95531. B, Summary plotting the fraction IPSC remaining in 70 μm SR95531 as a function of presynaptic glycine concentration. These values were fit with a Hill equation of the form Baseline + Ymax × , with C as concentration, and fit parameters of Baseline (starting amplitude), EC50 (half-maximal concentration), n (slope parameter), and Ymax (peak response). The fitted parameters for the red line were 0.12, 1.76 mm, 0.63, and 0.91, respectively. Gray bar brackets range of block seen with control pairs or extracellular stimulation, predicting ∼5 mm cytosolic glycine. C, A kinetic model (Beato, 2008) was driven with different peak glycine transients and the relative block in 70 μm versus 10 μm was compared, as in B. Blue lines connect experimental values in B for the range of cytosolic glycine levels used to the corresponding predicted values of cleft glycine in the model.
Figure 5.
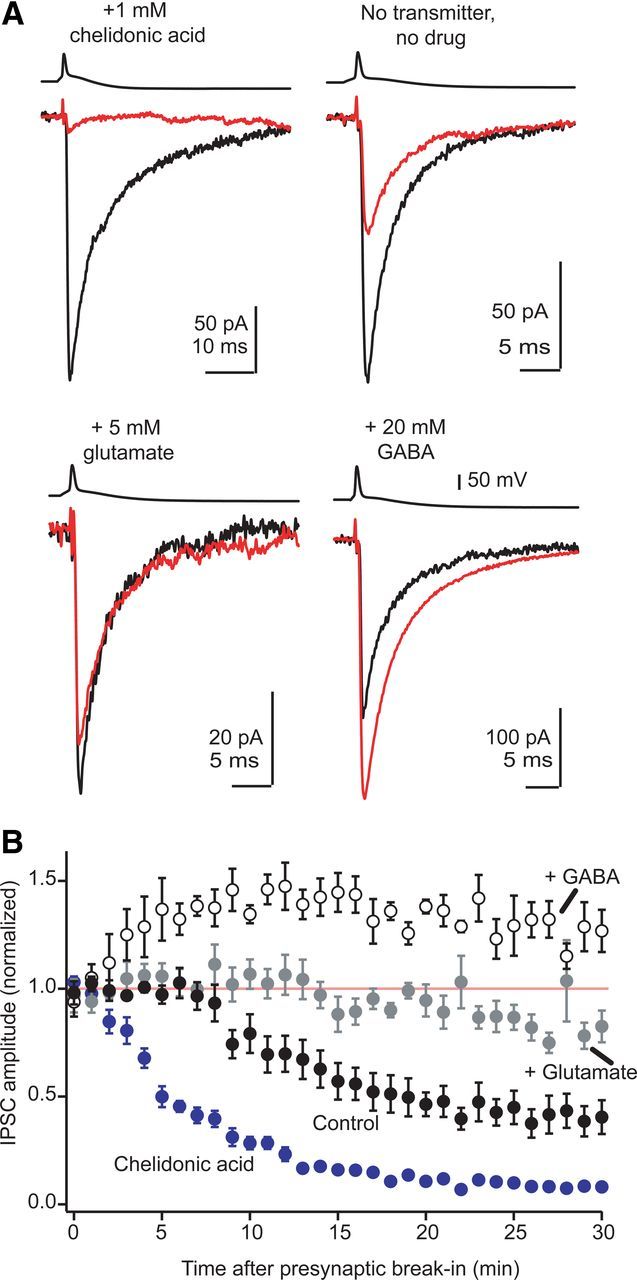
GAD supplies the majority of GABA for synaptic vesicles. A, Average of GABAA IPSCs evoked during the first 2 min after breaking into the presynaptic cell (black traces) and after 25–30 min of presynaptic dialysis (red traces). Each pair of red and black traces is from the same individual experiment. Dialyzing presynaptic cells with 1 mm chelidonic acid caused a near complete rundown of GABAergic transmission. Prolonged dialysis with a control internal solution caused partial rundown of GABAergic transmission that was reduced by exogenous glutamate, while 20 mm GABA potentiated transmission. B, Average time course of experiments shown in A. Each data point is the normalized mean ± SEM of 5–9 individual experiments in each condition.
Figure 6.
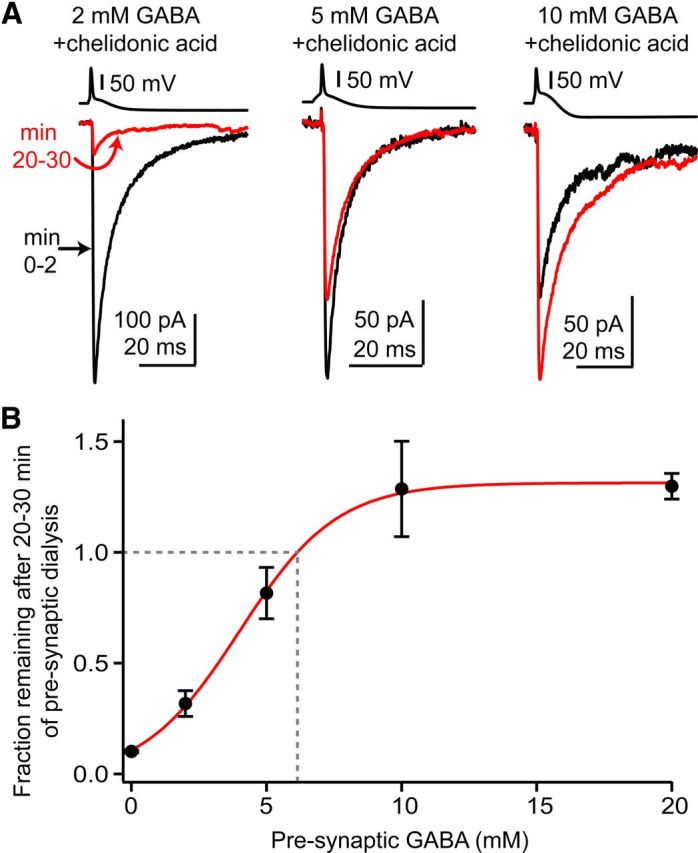
GAD supplies millimolar concentrations of GABA. A, Average GABAA IPSCs in single experiments during presynaptic dialysis with chelidonic acid and different concentrations of exogenous GABA. The black trace is an average of IPSCs during the first 2 min after presynaptic break-in and the red trace is an average of minute 20–30. The large hyperpolarization following the presynaptic action potential is due to negative current injection to prevent complex spike firing. B, Fractional IPSC remaining after 20–30 min is plotted against the concentration of exogenous GABA added to the presynaptic pipette solution. Data are normalized to the amplitude of IPSCs recorded during the first 2 min after presynaptic dialysis. The point 0 represents dialysis with chelidonic acid and 0 mm GABA. The 20 mm GABA data are from experiments in Figure 5 where presynaptic cells were loaded with 20 mm GABA and no chelidonic acid. To estimate the GABA concentration needed to prevent rundown (dashed gray line), the data were fit with a sigmoidal function of the form Baseline + {YMAX/(1 + exp((EC50 − C)/n))}, with C as concentration; the fitted parameters were Baseline (starting level of the fit), YMAX (peak), EC50 (concentration at half maximal run-down), and n (slope factor). For the solid red line these parameters were 0.02, 1.34, 4.01 mm, and 1.8. This equation was also used for jackknife analysis of the dataset as described in the text.
Figure 7.

Vesicles re-equilibrate with cytosolic transmitter within 1 min and independently of activity. A, Time course of GABAA IPSC amplitudes (bottom) and average traces at different time points (top) from a recording with 5 mm MNI-caged glutamate added to the presynaptic internal solution. Presynaptic whole-cell recording began ∼10 min before data collection. Uncaging glutamate by wide-field UV flash (500 ms; red line) rapidly potentiated GABAergic transmission. At the ∼20 min mark, presynaptic activity was suspended and glutamate was uncaged a second time. Presynaptic activity resumed 3 min after uncaging, and IPSC amplitudes were similarly potentiated. B–C, Average time course of the uncaging effect in experiments where IPSCs were continuously evoked after uncaging (B) or in experiments where presynaptic activity was suspended during uncaging (C). Each data point is the normalized mean ± SEM of 11–12 individual experiments (B) or 6–9 experiments (C).
Figure 8.

Postsynaptic receptor density determines IPSC phenotype. A, Presynaptic cartwheel cells loaded with 5 mm glycine + 7 mm GABA recapitulate the endogenous, predominantly glycinergic IPSC phenotype. Slices were pre-incubated in ORG25543 and cartwheel cells were patched with an internal solution containing 5 mm glycine, 7 mm GABA, and 1 mm chelidonic acid. Left, Time course from a single experiment plotting IPSC amplitude over time, showing that IPSCs evoked under these conditions are predominantly blocked by the glycine receptor antagonist strychnine. Right, Traces show a single presynaptic action potential and average IPSCs from this experiment during the baseline period (black, no inhibitory blockers), in strychnine (blue), and in strychnine + SR95531 (red). Gray trace is partial recovery during drug washout. B, Summary data plotting the fractional IPSC remaining in the presence of strychnine and strychnine + SR95531. Open circles are individual experiments. Red circles denote mean ± SEM. Data are normalized to the average IPSC amplitude during baseline. C, Puff application (10 ms, 5 psi) of 1 mm glycine or GABA to the same cell reveals that postsynaptic glycine currents are ∼3-fold larger than GABAA currents. Traces are averages from a single experiment. D, Summary of puff-evoked glycine/GABAA current ratios in seven cells similar to C. Open circles are individual experiments. Red dot represents mean ± SEM of these data.
Glutamate uncaging.
In Figure 7, MNI-glutamate (Tocris Bioscience) was added only to the presynaptic internal solution. K+ internal solution containing 5 mm MNI-glutamate was prepared in the dark and stored at −80°C in opaque 1 ml tubes until the day of the experiment. In some experiments, 5 mm glutathione was added along with MNI-glutamate. Experiments were performed in the dark and transillumination from the microscope was turned off after establishing a paired recording. The microscope setup for uncaging was similar to that described by Otis et al., 1996.
Data acquisition and analysis.
Data were collected with pClamp 9 software using a Multiclamp 700B amplifier and a Digidata 1322A analog-digital converter board. Traces were acquired at 20–50 kHz and lowpass filtered at 10–20 kHz. IPSCs were analyzed by filtering the traces off-line at 2–4 kHz and measuring the peak amplitude. Amplitudes were normalized to a stable 5–10 min baseline period (20–40 traces) and binned per minute. For the experiments with chelidonic acid in Figures 5 and 6, amplitudes were normalized to data during the first 2 min after breaking into the presynaptic cell.
mIPSC analysis.
mIPSCs were recorded in 1 μm tetrodotoxin (TTX) to block spikes, with 10 μm zolpidem + 30 μm pentobarbital to slow the decay kinetics of GABAA receptors and help distinguish them kinetically from glycinergic currents. Additionally, 10 μm baclofen was routinely added in these experiments. Baclofen reduced mIPSC frequency in cartwheel cells (our unpublished observation) and thereby minimized the frequency of overlapping events. Individual mIPSCs were detected using a template algorithm (AxoGraph X) with a minimum amplitude cutoff between −10 and −20 pA. Events were inspected visually for false positives or malformed events, and the decay components were fit by the following function to determine the relative contribution of glycinergic and GABAergic transmission to individual events (Jonas et al., 1998):
A and t represent the relative amplitude and time constants for the fast and slow components of a double exponential decay function. τfast = 3.07 and τslow = 27.88 ms represent the average decay time of purely glycinergic or GABAergic events recorded in 10 μm SR95531 or 500 nm strychnine, respectively. We considered events as “mixed glycine/GABA” if both the amplitude of the fast and slow components were >38.4 and 22.1 pA, respectively. These values represent the 2× SD cutoff for the amplitude of the fast component calculated from events recorded in strychnine (38.4 pA) and from the slow component recorded in SR95531 (22 pA).
Kinetic modeling.
The kinetic model and transmitter time course described by Beato (2008) for spinal interneurons was used to simulate IPSCs and their block by SR95531 in cartwheel cells. In the Beato model, a peak concentration of 3.3 mm was followed by a 0.64 ms exponential decay (obtained for a model in which desensitization was omitted), a glycine profile that accounted quantitatively for antagonism by SR95531, and enhancement following GlyT1 blockade. AxoGraph X software was used to drive the model with a set of peak glycine levels varying 0.5, 0.75, 1.0, 1.5, 2.0, and 2.5 times the optimal value determined in Beato (2008). For each of these values we then tested a set of SR95531 concentrations (0–6 mm), all with no change to the transmitter time course. Results in Figure 4C were obtained as the ratio of the response at 70 μm SR95531 to that at 10 μm SR95531, parallel to the experimental data shown in this figure. The 3.3 mm glycine value gave a fractional block in SR95531 lower than that observed experimentally (0.58 vs 0.65), suggesting that cartwheel cell vesicles release a somewhat higher concentration of glycine than do spinal interneurons.
In utero injections.
Pregnant female mice (10.5–12.5 d pregnant) were deeply anesthetized, and abdominal surgeries were performed as described in Wang et al. (2012). Up to eight embryos per dam were injected in the hindbrain with <200 nl of an AAV-FLEX-rev-ChR2-tdtomato construct (Addgene #18917) along with dextran-conjugated Alexa 488 using a beveled, glass capillary micropipette and a Parker Picospritzer III. Postnatal pups were genotyped for the cre transgene by PCR.
ChR2 activation.
Light from a 100 W Hg bulb in the epifluorescence path of the microscope was gated by a computer-controlled shutter (Uniblitz). Light then passed through a blue filter and brief flashes (2–50 ms) were delivered through the objective. In 4/8 experiments, we added 10 μm norepinephrine to the bath solution to reduce spontaneous firing of presynaptic cartwheel cells and increase the signal/noise ratio of IPSCs (Kuo and Trussell, 2011). No difference was observed in the glycine/GABA ratio (p = 0.458) with and without norepinephrine so the data were pooled. ChR2 stimulation evoked “complex spike” bursts of 2–4 IPSCs per light flash. We analyzed the glycine/GABA ratio of these bursts by measuring peak amplitude of the IPSC with the most stable baseline amplitude (typically the second or third IPSC in the burst) after peak aligning the individual sweeps.
Reagents.
NBQX, D-APV, R-CPP, and SR95531 were from Ascent Scientific/Abcam. MNI-glutamate was from Tocris Bioscience. Strychnine, pentobarbital, zolpidem, and chelidonic acid were from Sigma-Aldrich. ORG25543 was a gift from Hardy Sundaram at Organon.
Statistics.
All data reported in the text and displayed in figures are expressed as mean ± SEM. Statistical comparisons were made using paired or unpaired Student's t tests where appropriate. Fits to dose–response curves were performed on raw data using a sigmoid or Hill equation with Igor 6.22. The purpose of these fits was to determine through interpolation a predicted concentration for a given response amplitude. Reliability of the estimates of intracellular transmitter concentrations based on these curve fits was determined using a jackknife procedure (Efron and Tibshirani, 1986). In each dataset, a single point was removed, and the fit recalculated; the procedure was then repeated sequentially with removal and replacement of all points. Estimates of the concentration were determined from the mean of values obtained from the different curve fits. The error of the mean was then scaled by the number of iterations, according to Efron and Tibshirani (1986), their Equation 10.10.
Results
Synaptic transmission between cartwheel cells is predominantly glycinergic
Because VGAT packages both glycine and GABA into vesicles, functional corelease of glycine/GABA occurs at many synapses in juvenile and mature animals (Jonas et al., 1998; Awatramani et al., 2005). While cartwheel cells label with antibodies against both glycine and GABA (Wenthold et al., 1987), inhibitory transmission is reported to be predominantly glycinergic (Roberts et al., 2008; Mancilla and Manis, 2009).
To further define the balance between the two transmitter systems, paired presynaptic and postsynaptic recordings were made between neighboring cartwheel cells. Action potentials elicited in a presynaptic cell caused short latency, monosynaptic IPSCs in its voltage-clamped postsynaptic target cell (Fig. 1A). In agreement with previous studies, bath application of the glycine receptor antagonist strychnine (500 nm) significantly reduced IPSCs to 13 ± 2% of control (blue traces, n = 8) (Roberts et al., 2008). The GABAA receptor antagonist SR95531 (10 μm) blocked the strychnine-insensitive component (2 ± 1% remaining, n = 7), showing that glycine and GABA were coreleased from the same presynaptic cell. Cytosolic GABA can wash out during whole-cell recordings (Smith and Jahr, 2002; Diana and Marty, 2003), which may underestimate the GABAergic contribution to transmission in cartwheel cell pairs. We tried to avoid washout by applying blockers soon after recording began. Nevertheless, to determine whether the glycinergic predominance was due to selective washout of GABA, we expressed in cartwheel cells the light-activated ion channel channelrhodopsin2 (ChR2) via in utero viral transfection in GlyT2-cre transgenic mice (see Materials and Methods). Because GlyT2 is specifically expressed in glycinergic neurons (Zafra et al., 1995), viral transfection results in mosaic expression of ChR2 in cartwheel cells, enabling activation of these neurons via blue light stimuli. In DCN slices from injected GlyT2-cre mice, wide field flashes of blue light (2–50 ms duration) caused barrages of complex spike IPSCs previously attributed to burst firing of presynaptic cartwheel cells (Fig. 1B; Roberts et al., 2008). Strychnine (500 nm) reduced the amplitude of ChR2-evoked IPSCs to 16 ± 3% of baseline (n = 8), whereas SR95531 blocked the remaining IPSCs (2 ± 1% of baseline remaining, n = 8). The IPSC remaining in strychnine was not significantly different between paired recordings and optogenetic experiments (Fig. 1C; p = 0.32).
Cartwheel cells receive inhibitory inputs from two main sources: other cartwheel cells and superficial stellate cells (Rubio and Juiz, 2004). However, stellate cells are thought to be predominantly GABAergic (Rubio and Juiz, 2004). Furthermore, preliminary experiments suggest that the amplitude of unitary IPSCs made by stellate cells onto cartwheel cells is much smaller than for cartwheel-to-cartwheel cell pairs (Roberts and Trussell, 2010; our unpublished observations), suggesting that reciprocal synapses between cartwheel cells account for the majority of inhibitory release sites. Given this background, we recorded mIPSCs to test whether glycine and GABA were copackaged in the same vesicles, similar to other brain regions (Jonas et al., 1998; Nabekura et al., 2004; Awatramani et al., 2005). Recordings were made in the presence of 1 μm TTX to block spikes, along with 10 μm zolpidem and 30 μm pentobarbital to slow the decay kinetics of GABAA receptors. Under these conditions, the decay time constant of GABAA mIPSCs isolated with strychnine was ∼10-fold slower than that of glycine mIPSCs isolated with SR95531 (glycine = 3.0 ± 0.2 ms, n = 9; GABAA = 27.9 ± 2.0 ms, n = 9). Consequently, mIPSCs recorded in the absence of inhibitory blockers displayed a spectrum of decay kinetics and could be classified into three basic categories (Fig. 1D): rapidly decaying glycinergic events, slowly decaying events mediated by GABAA receptors, and a third population with both fast glycine and slow GABAergic decay components. We determined the relative amplitude of the glycinergic and GABAergic components of mIPSCs by force fitting the decay phase of individual events with a double exponential function containing the average glycine and GABAA decay time constants (Jonas et al., 1998; Awatramani et al., 2005). Figure 1E shows representative data from two cells, plotting the amplitude of the glycine component against the GABA component for individual mIPSCs. The dashed lines mark the 2× SD amplitude cutoffs for GABAA (horizontal) or glycine (vertical) events. We categorized events falling above both vertical and horizontal SD lines as “dual component” mIPSCs and thus mediated by both transmitters. On average, 19.3 ± 2.2% of events recorded in absence of inhibitory blockers were classified as mixed glycine/GABA mIPSCs (n = 14 cells; Fig. 1G). Importantly, adding 10 μm SR95531 (n = 10) or 500 nm strychnine (n = 4) to the bath solution reduced the fraction of mIPSCs falling above the 2× SD lines to 1.5 ± 0.3% (Fig. 1F,G). Thus, cartwheel cells copackage GABA and glycine in the same vesicle similar to other coreleasing synapses.
GlyT2 activity determines glycinergic synaptic strength on a timescale of minutes
Genetic deletion or chronic block of the plasma membrane glycine transporter GlyT2 reduces the amplitude of glycine mIPSCs in cultured spinal neurons, suggesting that GlyT2 can regulate glycine availability in nerve terminals (Gomeza et al., 2003; Rousseau et al., 2008). However, such chronic manipulations do not abolish glycinergic transmission, implying that nerve terminals can maintain glycine for long periods of time independent of GlyT2, or possibly compensate for loss of GlyT2 activity. Furthermore, in some cases acute block of GlyT2 reduces glycine mIPSC frequency without affecting mIPSC amplitudes (Bradaïa et al., 2004), suggesting that any acute effects of GlyT2 block could potentially reflect an influence of GlyT2 on presynaptic release probability (but see Rousseau et al., 2008), as has been demonstrated for other cation-coupled transporters (Bagley et al., 2011). We determined the extent to which GlyT2 actively regulates cytosolic glycine levels by assessing the acute effect of a selective GlyT2 inhibitor (ORG25543, 1 μm) on glycine IPSCs. Pairs were recorded in 10 μm SR95531 to isolate glycinergic transmission and ORG25543 was bath applied after establishing a stable baseline. IPSC amplitudes ran down soon after drug application (Fig. 2A), declining to 59 ± 11% (n = 9) of baseline within 10–11 min (Fig. 2D). The rate of rundown was variable between experiments (Fig. 2D), although IPSCs invariably dropped to 3 ± 1% of baseline within 30 min of drug application (n = 9, p = 0.0003). These results show that GlyT2 constitutively supplies glycine for moment-to-moment refilling of recycling vesicles.
Vesicles re-equilibrate with reduced cytosolic transmitter levels independently of exocytosis
We next tested whether the rundown induced by glycine depletion was affected by the rate of stimulation, either by suspending presynaptic activity during the first 10 min of ORG25543 application, or by increasing the rate of stimulation 30-fold, from 0.067 to 2 Hz (Fig. 2B–D). Surprisingly, neither manipulation altered the rate of loss of glycinergic transmission. When stimulation was omitted, IPSCs declined to 57 ± 9% of baseline (Fig. 2B,D, n = 10), as observed when presynaptic stimulation resumed 10–11 min after ORG25543 application. This value was not significantly different (p = 0.83) from experiments at 0.07 Hz (Fig. 2D). In 9 of 10 experiments, stimulation was again stopped for 7–10 min as slices remained exposed to ORG25543. Immediately upon resuming stimulation at 20–23 min, IPSCs were now further depressed to 12 ± 4% of baseline. Again, these values were not significantly different (p = 0.294) from the fraction remaining with continuous activity (14 ± 4%, n = 8). Conversely, transiently increasing the stimulus rate to 2 Hz to augment vesicle release during ORG25543 application did not appreciably accelerate rundown, with amplitudes remaining at 66 ± 27% of baseline (n = 3) after 10–11 min (Fig. 2C,D). These results argue that glycine content inside vesicles is not static, but rapidly re-equilibrates upon acute reductions in extralumenal glycine levels.
Could a high rate of spontaneous vesicle release obscure an activity-dependence of rundown during ORG25543 application? In cartwheel cells, glycine mIPSCs recorded in TTX using a CsCl internal solution (without pentobarbital, zolpidem, or baclofen added to the bath) had an average amplitude of 68.8 ± 5.3 pA and occurred with a frequency of 12.3 ± 1.0 Hz (n = 16 cells; data not shown). In separate experiments, we obtained a rough estimate of the number of functional release sites between single cartwheel cell pairs by loading presynaptic and postsynaptic neurons with a CsCl-internal solution and triggering escaping spikes in the voltage-clamped presynaptic neuron. Adding CsCl to the presynaptic neuron blocks K+ channels and broadens the presynaptic action potential waveform, thereby enhancing Ca2+ influx and release probability in nerve terminals (Vincent and Marty, 1996). Unitary glycine IPSCs evoked under these conditions had an average amplitude of 4.8 ± 1.4 nA (n = 14 pairs; data not shown), suggesting that the reciprocal synapses between cartwheel cells are made up of at minimum ∼70 release sites (unitary IPSC/mIPSC amplitude: 4800/69 = 69.5). Based on correlation analysis, cartwheel cells are probably contacted by at least two other cartwheel cells (Roberts and Trussell, 2010). If we assume that a single neuron is contacted by five neighboring presynaptic cartwheel cells, the frequency of spontaneous fusion at a single release site is on the order of one to two vesicles per minute (12.3 Hz/350 release sites = 0.035 Hz/release site). Thus, during a 10 min application of ORG25543, only 20 vesicles will have spontaneously released from each site, which is probably small compared with the number of vesicles released during evoked transmission.
We also tested whether ORG25543-induced rundown was due to a spurious drug effect on release probability by adding glycine (20 mm) to the pipette solution and subsequently bath applying ORG25543 (Fig. 2E). Glycinergic transmission was stable for the entirety of the experiment, with IPSC amplitudes remaining at 106 ± 21% of baseline (n = 6) 30–36 min after drug application. This indicates that ORG25543 acted by depleting the terminal of glycine, and also that pipette contents effectively reach presynaptic terminals. The possibility was also tested that washout of presynaptic glycine during prolonged whole-cell dialysis with transmitter-free solution could reduce IPSC amplitude (Diana and Marty, 2003). When pairs were recorded with a glycine-free internal solution, IPSC amplitudes at minute 35–40 remained at 98 ± 11% of the first 5 min (n = 7, p = 0.98; Fig. 2F) suggesting that whole-cell dialysis does not significantly reduce presynaptic glycine while GlyT2 is active. Finally, establishing paired recordings with glycine in the presynaptic electrode after pre-incubation in ORG25543 rapidly restored transmission (Fig. 3), arguing that loss of intracellular glycine does not have a deleterious effect on nerve terminals.
GlyT2-supplied glycine does not saturate VGAT
Our data indicate that cytosolic transmitter levels determine the level of vesicle filling, and thus the strength of transmission. However, VGAT has a low affinity for glycine and GABA, suggesting that terminals must contain millimolar levels of free transmitter to adequately refill vesicles. Indeed, GlyT2 can establish intracellular glycine concentrations up to 20–40 mm from nanomolar extracellular pools (Supplisson and Roux, 2002), although concentrations above ∼10 mm are expected to saturate VGAT function (Christensen et al., 1990). We tested for such saturation by measuring the degree of block of IPSCs by the low-affinity, competitive glycine receptor antagonist SR95531, under basal conditions and in pairs with 20 mm glycine in the presynaptic pipette. SR95531 blocks GABAA receptors with high affinity, although it also acts as a low-affinity competitive antagonist of glycine receptors at concentrations >30 μm (Beato et al., 2007, 2008). The off-rate of SR95531 from glycine receptors (∼300 μs) is faster than the duration of the synaptic glycine transient (Beato et al., 2007). Thus, a significant fraction of glycine receptors will unbind SR95531 while glycine is still present in the synaptic cleft, making the degree of block by a set concentration of SR95531 inversely proportional to the amount of glycine released in the cleft following exocytosis (Beato, 2008). If the basal cytoplasmic glycine concentration saturates VGAT, experimentally increasing presynaptic glycine levels should have no effect on the efficacy of SR95531 to block glycine receptors compared with control. Alternatively, if vesicular transport is not saturated under basal conditions, SR95531 should reduce IPSC amplitudes significantly less when presynaptic neurons are loaded with 20 mm glycine compared with control conditions with no added transmitter.
SR95531 (10 μm) was present during the baseline period to block GABAA receptors. In control pairs with no exogenous glycine in the internal solution, increasing SR95531 from 10 to 70 μm reduced glycine IPSCs to 63 ± 3% of baseline (Fig. 4A; n = 10). SR95531 (70 μm) similarly reduced glycine IPSCs evoked with an extracellular stimulating electrode (65 ± 3%, n = 6, p = 0.68 compared with control pairs), indicating that whole-cell recording from the presynaptic neuron did not significantly diminish the amount of glycine released in the cleft. In contrast, 70 μm SR95531 reduced IPSCs significantly less when 20 mm glycine was added to the presynaptic pipette (77 ± 3% of baseline, n = 8, p = 0.0014 compared with control pairs). Thus, increasing cytosolic glycine levels near presynaptic vesicles resulted in a higher peak transmitter concentration released per action potential, indicating that the glycine provided by GlyT2 does not saturate VGAT function.
The endogenous concentration of glycine in nerve terminals
We used the low-affinity antagonist approach to determine the endogenous glycine concentration supplied by GlyT2 by pre-incubating slices in 1 μm ORG25543 to deplete cartwheel cells of their endogenous glycine, and “rescuing” transmission with experimentally defined glycine concentrations in the recording pipette. IPSCs evoked with 2 mm glycine in the pipette were significantly more sensitive to 70 μm SR95531 than in control conditions (Fig. 4A; 52 ± 4% reduction, n = 8. p = 0.02 and 0.03 compared with control pairs and extracellularly evoked IPSCs, respectively), showing that GlyT2 must supply >2 mm glycine. In pairs loaded with 5 mm glycine, 70 μm SR95531 reduced IPSCs to 65 ± 2% of baseline (n = 9). This reduction was similar to control pairs (p = 0.74) and extracellularly evoked IPSCs (p = 0.998). SR95531 (70 μm) similarly reduced IPSCs with 10 mm glycine in the pipette (69 ± 3% of baseline remaining, n = 5). By fitting these concentration-block data with a Hill function (Fig. 4B), we find that the values from control pairs and extracellular stimulation experiments lie near the 5 mm data point (gray bar). Using a value of control block of 0.65, a jackknife analysis of the curve fit to these data (see Materials and Methods) indicated that GlyT2 supplies ∼5.4 ± 1.0 mm glycine to presynaptic terminals (mean and SEM fits to 30 trials).
What range of vesicular glycine concentrations might result from the 10-fold range of cytosolic glycine levels that we tested? As we could not directly measure vesicular glycine in situ, we adopted an indirect modeling approach, and determined the predicted values of cleft glycine concentrations that would be associated with the various levels of block observed with SR95531. The results of Beato (2008) were used as a starting point for a kinetic model of synaptic glycine receptors and for an initial value for peak cleft glycine concentration and transmitter time course. Both peak cleft glycine and SR95531 values were varied in the model, and a fractional block was expressed as block in 70 μm/10 μm SR95531 to directly compare values to the experimental data of Figure 4, A and B. The results shown in Figure 4, A and C, indicate that a degree of block similar to that seen with control recordings was obtainable in the model with just <5 mm peak cleft glycine. Importantly, the results show that although the range we observed of fractional block by SR95531 was <50%, such a range would correspond to a >3-fold variation in cleft glycine and, presumably, a similar range in vesicular glycine.
GAD is the predominant source of GABA in cartwheel cell terminals
We next tested whether GAD is the main supplier of GABA to vesicles by dialyzing presynaptic neurons with chelidonic acid, a conformationally restricted analog of glutamate that rapidly and competitively inhibits GAD (Porter and Martin, 1985). GABAergic transmission was isolated with 500 nm strychnine, and pairs were recorded with chelidonic acid (1 mm) in the presynaptic pipette. Data collection began within 30 s of breaking into the presynaptic cell. Figure 5B (blue circles) shows that GABAA IPSCs ran down rapidly after break-in, reaching 11 ± 1% of their initial amplitude after 20 min of presynaptic dialysis (n = 9). This remaining component probably reflects a residual glycinergic component not blocked by 500 nm strychnine. These data show that de novo synthesis by GAD is the main source of GABA in nerve terminals, and tightly regulates vesicular GABA content on the order of minutes.
Similar to previous studies' recording from pairs of GABAergic neurons (Smith and Jahr, 2002; Diana and Marty, 2003), we observed partial rundown of GABAA IPSCs after ∼10 min of whole-cell dialysis with our standard internal solution (without chelidonic acid). This rundown stabilized to 43 ± 7% of baseline after 20–30 min (n = 8, Fig. 5A,B). Adding 5 mm glutamate to the internal solution significantly reduced this rundown (Fig. 5A,B; fraction remaining after 20–30 min: 88 ± 5%, n = 9, p = 0.0002 compared with control conditions) supporting an essential role for GAD in supplying GABA for vesicle filling. Furthermore, adding exogenous GABA (20 mm) to the presynaptic internal solution rapidly and significantly potentiated transmission to 130 ± 5% of the first 2 min (open circles; p = 0.01, n = 5). Thus, unlike GlyT2-supplied glycine, vesicular packaging of GABA does not function optimally during whole-cell dialysis due to washout of GABA and/or its precursor glutamate.
The effective cytosolic concentration of GABA
Based on the previous observations we estimated the endogenous GABA concentration in nerve terminals by dialyzing presynaptic cells with chelidonic acid plus defined concentrations of exogenous GABA, and determined the amount of GABA necessary to maintain transmission near baseline for 20–30 min. With 2 mm GABA + chelidonic acid in the presynaptic cell (Fig. 6A,B), the fraction remaining was 32 ± 6% of baseline (n = 7), suggesting that cytosolic GABA levels must be >2 mm. The fraction remaining with 5 mm GABA + chelidonic acid was 82 ± 12% of baseline (n = 8), while 10 mm GABA + chelidonic acid potentiated transmission to 130 ± 22% of baseline (n = 12; Fig. 6A,B). A sigmoid fit to these data using a jackknife procedure (see Materials and Methods) indicated that transmission would be maintained at a constant level by 6.2 ± 1.2 mm intracellular GABA (mean and SEM for 40 iterations; Fig. 6B). Thus, these observations suggest that synaptic vesicles in cartwheel cell terminals are exposed to similar levels of cytoplasmic GABA and glycine.
GABA is synthesized and loaded into synaptic vesicles on the timescale of minutes
Is GAD turnover sufficiently fast to supply the high concentrations of GABA needed to refill vesicles? Classic experiments in purified vesicles, along with a recent study at the calyx of Held, suggest that synaptic vesicles rapidly (<1 min) accumulate transmitter (Christensen et al., 1990; Hori and Takahashi, 2012). However, these experiments could not address whether endogenous transmitter supply mechanisms operate on a similar timescale. Conversely, experiments at cholinergic synapses suggest that newly synthesized acetylcholine does not readily incorporate into synaptic vesicles unless the preparation is extensively stimulated (Potter, 1970; Agoston et al., 1985), arguing that transmitter synthesis lags behind vesicle filling under periods of low activity. Having established that GAD is the main supplier of GABA, we therefore asked whether inhibitory synaptic strength is tightly coupled to GABA synthesis, or whether transmitter supply mechanisms affect transmission only after a significant delay. We dialyzed presynaptic cells with a solution containing no added GABA or glutamate, but rather a caged glutamate compound (MNI-glutamate; 5 mm). The loss of endogenous glutamate and GABA led to rundown of transmission, as expected from the experiments in Figure 5, and subsequently uncaging glutamate inside the terminal rapidly increased local GAD substrate. Figure 7A shows data from a typical experiment, plotting the amplitude of individual GABAergic IPSCs (recorded in strychnine) over time. MNI-glutamate was uncaged with wide-field illumination by UV light (500 ms) at times denoted by the red line. The results were dramatic, with IPSC amplitudes potentiating >3-fold within 2 min. Indeed, the first test points taken even 15 and 30 s after uncaging are clearly enhanced above preflash baseline. These data illustrate that GABA is synthesized and packaged into release-ready vesicles within seconds of increases in nerve terminal glutamate concentrations.
We next tested whether GABA synthesis and/or vesicle refilling required activity. MNI-glutamate was uncaged in the absence of presynaptic activity, and the resumption of test stimuli was delayed for ∼3 min. An example is shown in Figure 7A, where presynaptic activity was suspended at the 20 min mark, followed by a 500 ms UV flash. When stimulation was resumed, IPSCs were clearly potentiated compared with baseline. These data show that de novo transmitter synthesis and vesicle filling are remarkably independent of exocytic history.
The potentiation under the two stimulus conditions was quantified and compared by normalizing IPSCs to the average amplitude during a 5 min epoch before uncaging and binning these values per minute. With continuous presynaptic activity, IPSC amplitudes increased significantly to 204 ± 12% of baseline 3–5 min after uncaging (Fig. 7B, n = 12, p = 0.0004). Following an absence of stimulation, IPSC amplitudes similarly increased to 211 ± 12% of baseline (Fig. 7C, n = 9, p = 0.0005). The degree of potentiation was not significantly different between these two datasets (p = 0.6), showing that the refilling of vesicles was virtually independent of presynaptic spike activity.
Several control experiments rejected alternative interpretations that could account for the rapid potentiation following uncaging. The 500 ms UV flashes with no MNI-glutamate in the pipette did not potentiate GABAergic transmission (IPSC amplitudes 3–5 min after UV flashes: 71 ± 7% of baseline, n = 3), ruling out direct effects of UV light on GABAA receptors (Chang et al., 2001). Furthermore, uncaging MNI-glutamate in presynaptic cartwheel cells had no effect on glycinergic IPSCs recorded in 10 μm SR95531 (IPSC amplitudes 3–5 min after uncaging were 93 ± 4% of baseline, n = 9, p = 0.35), demonstrating that uncaging glutamate does not increase the probability of vesicle release. Finally, uncaging-induced potentiation of GABAA IPSCs was absent when presynaptic cells were loaded with 5 mm MNI-glutamate and 1 mm chelidonic acid (IPSC amplitudes 3–5 min after uncaging were 75 ± 9% of baseline, n = 7), showing that potentiation required de novo GABA synthesis. Together, these data confirm that GABAergic transmission is temporally coupled to increases in GAD substrate availability, and that the extent of increase is not influenced by ongoing exocytosis.
Transmission is predominantly glycinergic even when terminals contain similar GABA and glycine levels
The results thus far suggest that cartwheel cell terminals contain similar concentrations of glycine and GABA. As an independent test of our presynaptic glycine/GABA estimate, we loaded cartwheel cells with the concentrations determined in Figures 4 and 6 (5 mm glycine and 7 mm GABA), while depleting neurons of endogenous glycine/GABA by pre-incubating in 1 μm ORG25543 and adding chelidonic acid to the internal solution. Under these conditions, 500 nm strychnine reduced IPSC amplitudes to 24 ± 3% of baseline (Fig. 8A,B; n = 10), and subsequent application of 10 μm SR95531 reduced the remaining IPSCs to 1.3 ± 0.2% (n = 7). Given that IPSCs were predominantly glycinergic in all 10 pairs tested (Fig. 8B), these results indicate that cartwheel cells contain approximately equal concentrations of glycine and GABA, and suggest that postsynaptic factors determine IPSC identity.
Postsynaptic receptor expression determines IPSC phenotype
One transmitter typically predominates over the other at mixed glycine/GABA synapses, but whether this is due to different ratios of transmitter in presynaptic vesicles (Nabekura et al., 2004) or differential postsynaptic expression of glycine and GABAA receptors (Dugué et al., 2005) is unresolved. Given that VGAT has a ∼2-fold higher affinity for GABA than glycine (Burger et al., 1991), the largely glycinergic phenotype in Figure 1 might be determined postsynaptically and not by differential presynaptic glycine/GABA levels. We tested whether the postsynaptic response to exogenous glycine and GABAA differed in parallel to that of synaptic responses by quantifying the relative amplitude of currents evoked by puff application of 1 mm glycine or GABA onto the same neuron (Fig. 8C,D). The average amplitude of glycine-evoked currents was always substantially greater than the GABAA component (p = 0.006, n = 7), with an average glycine/GABA ratio of 3.6 ± 0.3 (Fig. 8D). Because the puff-evoked whole-cell currents were often several nanoamperes in amplitude, we worried that voltage-clamp errors could distort the calculated ratio. Furthermore, saturating concentrations of agonists may lead to differential receptor desensitization during puffs. As a control, we therefore performed excised (“outside-out”) patch experiments from cartwheel cell soma and sequentially puff applied glycine and GABA (1 mm each) to the same membrane patch. In agreement with our whole-cell results, glycine evoked significantly larger responses than GABA in excised patches, with a peak glycine/GABA ratio of 3.5 ± 1.4 (n = 11 patches, p = 0.003). These results, along with our finding that cartwheel cell terminals contain similar glycine/GABA concentrations, show that the IPSC phenotype in cartwheel cells is determined by the relative expression of postsynaptic glycine/GABAA receptors and not by different transmitter levels in synaptic vesicles.
Discussion
Vesicular transmitter content is in dynamic equilibrium with cytosolic concentrations
We used paired recordings to determine the molecular mechanisms, temporal dynamics, and cytosolic transmitter concentrations involved in vesicle refilling at a mixed glycine/GABA synapse. Surprisingly, neither upregulation nor downregulation of vesicle content was modified by activity-driven exocytosis, suggesting that vesicular transmitter turns over in minutes, independent of activity. These results establish that synaptic vesicle content is not merely a static reflection of initial transport activity following vesicle biogenesis, but is dynamically regulated by ongoing fluctuations in cytosolic transmitter availability.
Our results contrast with studies at cholinergic synapses, where blocking vesicular acetylcholine uptake does not affect transmission unless axons are stimulated extensively and ∼15% of the vesicle pool has turned over (Cabeza and Collier, 1988; Searl et al., 1991). Furthermore, radiolabeled acetylcholine does not incorporate into vesicles in unstimulated preparations (Agoston et al., 1985; Whittaker, 1987), suggesting that vesicles do not increase their contents upon acute increases in cytosolic transmitter, nor is active synthesis of acetylcholine required to maintain vesicle content. Thus, it is thought that cholinergic vesicles are “sealed off” and cannot change their contents until they are recycled after exocytosis, thereby limiting fluctuations in cytoplasmic transmitter from affecting transmission only after significant activity (Van der Kloot, 2003). One explanation is that positively charged acetylcholine may be less prone to leaking from vesicles than glycine/GABA, which are transported as neutral zwitterions (Edwards, 2007).
Recent studies exploring this issue at inhibitory synapses in the hippocampus provided differing results, with some data suggesting that vesicles re-equilibrate independent of exocytosis after acutely blocking GABA synthesis (Mathews and Diamond, 2003), whereas another study required significant activity to observe changes in vesicle filling (Liang et al., 2006). One explanation is that differences in spontaneous firing of presynaptic neurons may result in different rates of vesicle turnover during experiments. Indeed, extensive stimulation produces a component of synaptic depression due to depletion of glycine availability in terminals (Rousseau et al., 2008). We controlled the degree of presynaptic activity using paired recordings and found that regulation of cytosolic transmitter caused rapid, activity-independent changes in transmitter release. Our results corroborate a model whereby vesicle content reflects the balance between transport-mediated uptake of cytosolic transmitter and nonspecific efflux.
GlyT2 provides glycine for cartwheel cell nerve terminals
Previous studies show that GlyT2 is intimately linked to refilling of glycinergic vesicles (Rousseau et al., 2008). However, alternative sources may also supply glycine to fill synaptic vesicles: GlyT2 −/− mice exhibit some glycinergic transmission, albeit with reduced quantal size (Gomeza et al., 2003), and preincubation of cultured spinal neurons with ORG25543 for 12–24 h does not completely abolish glycine IPSCs (Rousseau et al., 2008). Our results extend these observations by demonstrating that GlyT2 is the main, if not only source of glycine for constitutive vesicle refilling (Fig. 2). Thus, alternative pathways for intracellular synthesis or uptake of glycine are likely to operate on a slower time scale than GlyT2.
GAD is the main supplier of vesicular GABA
GABA is synthesized through decarboxylation of glutamate by GAD65 and GAD67, and mutant mice lacking both GAD isoforms have no detectable brain GABA (Ji et al., 1999). However, pharmacological block of GAD using extracellularly applied antagonists over several hours typically fails to abolish GABAergic transmission (Engel et al., 2001; Mathews and Diamond, 2003; Lu et al., 2008). Thus, while GAD is involved in synthesizing GABA for vesicular transport, it is possible that other sources, such as local recapture by plasma membrane GAT1 transporters (Kirmse and Kirischuk, 2006) or synthesis from polyamines (Bell et al., 2011), may also rapidly concentrate GABA near synaptic vesicles. However, we find that direct application of a GAD inhibitor to the presynaptic cytosol causes rapid and almost complete rundown of GABAergic transmission that is reversed, in a concentration-dependent manner, by the addition of exogenous GABA to the pipette (Fig. 6). Moreover, in GABA-depleted synapses, step increases in cytosolic glutamate through intracellular uncaging restored GABAergic transmission within seconds (Fig. 7).
Why do other studies report incomplete reductions in GABAergic transmission with GAD inhibitors, even after incubations >12 h (Engel et al., 2001)? A commonly used GAD inhibitor, 3-mercaptopropionic acid, blocks only ∼50% of GABA synthesis in brain slices, even at saturating concentrations (Dericioglu et al., 2008). Chelidonic acid is a potent GAD inhibitor that is competitive with glutamate and does not inhibit GAD by interfering with its required cofactor, pyridoxal-phosphate (Porter and Martin, 1985). To our knowledge, our study is the first to apply directly a GAD inhibitor inside nerve terminals to determine the extent to which GAD supplies GABA for vesicle refilling.
Synaptic vesicles are exposed to low mm glycine/GABA concentrations
Little is known about endogenous transmitter levels inside nerve terminals. One study indicates that the endogenous glutamate concentration in the cytoplasm is between 1 and 10 mm (Ishikawa et al., 2002), while experiments in chromaffin cells estimated that catecholamines are between 5 and 50 μm (Mosharov et al., 2003). There have been no functional estimates of intracellular glycine/GABA levels until now. Previous studies proposed GABA concentrations ranging from 7 mm in somata (Obata et al., 1970; Otsuka et al., 1971) to 50–150 mm in nerve terminals (Fonnum and Walberg, 1973), while glycine may be near 20–40 mm (Supplisson and Roux, 2002). These estimates raise the intriguing possibility that VGAT saturation is a prerequisite for efficient refilling of inhibitory vesicles. However, we find that endogenous transmitter does not saturate vesicular transporters: dialyzing presynaptic cells with high concentrations of glycine or GABA reduced the efficacy of a fast-off glycine receptor antagonist (Fig. 4) and potentiated GABAergic transmission (Fig. 5).
Our cytosolic transmitter estimates agree with the work of Obata et al. (1970) and Otsuka et al. (1971) in Purkinje cell somata. Cartwheel cells share considerable homology to Purkinje cells (Mugnaini et al., 1987), suggesting that our estimates extend to GABA-only synapses. Nevertheless our results may represent underestimates, as previous work suggests that cytosolic glycine and GABA compete for vesicular transport (Burger et al., 1991). Moreover, the concentrations reached in the terminal cytoplasm may be somewhat lower than that of the pipette. Our experiments were limited by the fact that GABA, but not glycine washes out during whole-cell dialysis (Figs. 2D, 5A). Thus, if GABA and glycine compete for vesicular transport, the 5 mm glycine estimate would have been determined under conditions where endogenous GABA is reduced by ∼50%. However it should be noted that GAD is anchored to synaptic vesicles in nerve terminals (Kanaani et al., 2002; Jin et al., 2003). This association with vesicles could reduce the extent to which glycine and GABA compete for vesicular transport by establishing spatial “nanodomains” of GABA that would be preferentially transported by VGAT. In agreement with minimal competition are data showing that neither pharmacological block (Bradaïa et al., 2004; Rousseau et al., 2008) nor genetic deletion of GlyT2 (Latal et al., 2010) increase GABAA mIPSC amplitudes in spinal neurons (but see Xu et al., 2005).
Postsynaptic receptor expression, not presynaptic transmitter availability, determines transmitter phenotype
Glycine/GABA corelease occurs in the cerebellum (Dugué et al., 2005), brainstem (Nabekura et al., 2004; Awatramani et al., 2005), and spinal cord (Jonas et al., 1998). Whether transmitter phenotype is determined by differential glycine/GABA concentrations in presynaptic vesicles (Nabekura et al., 2004) and/or by differential expression of glycine and GABAA receptors at postsynaptic targets (Dugué et al., 2005) remained unresolved. We find that under conditions where there is equal, if not more GABA than glycine in vesicles, synaptic transmission is predominantly glycinergic (Figs. 1, 8). Furthermore, direct application of glycine and GABA to postsynaptic cells revealed much larger glycine than GABAA currents. A fraction of this glycinergic predominance can be explained by the larger (∼40%) single channel conductance of glycine over GABAA receptors (Smith et al., 1989). However, the postsynaptic response to exogenous glycine was 3.5-fold larger than to equimolar GABA, suggesting that an increased density of glycine receptors accounts for the majority of the observed phenotype. The glycine/GABA ratio in the puff experiments was slightly lower than our synaptic estimates with paired recordings. This is not surprising, as puff application will sample both synaptic and extrasynaptic receptors. A high density of extrasynaptic GABAA receptors, as reported for targets of coreleasing interneurons in the spinal cord (Chéry and de Koninck, 1999), would reduce our synaptic glycine/GABA estimate. We nevertheless observe a 3.5-fold larger glycine than GABAA component, indicating that receptor expression determines transmitter phenotype in cartwheel cells.
Implications for inhibitory synaptic plasticity
GlyT2 membrane expression and GABA synthesis are subject to regulation by multiple signaling pathways: GlyT2 trafficks to and from the plasma membrane on a timescale of minutes, and this trafficking is regulated by activity-dependent Ca2+ influx (Geerlings et al., 2001), protein kinase C (Fornés et al., 2008), and metabotropic purine receptors (Jiménez et al., 2011). Furthermore, GABA synthesis is bidirectionally controlled by protein kinase A and C (Wei and Wu, 2008), suggesting that activators upstream of these kinases might control cytosolic GABA levels. Together with our current findings, these results predict that cytosolic transmitter levels potently regulate inhibitory synaptic strength.
Footnotes
This project was funded by National Institutes of Health Grant R01DC004450 (L.O.T.), Cornelia H. Stevens ARCS scholarship, N.L. Tartar Trust Fellowship, and National Institutes of Health–National Institute on Deafness and Other Communication Disorders Fellowship F31DC012222 (P.F.A.) We thank Michael Bateschell for performing the in utero injections; Drs. Stephen Smith and Gary Westbrook for comments on this manuscript; Dr. John Brigande and Dan Yaeger for advice regarding the optogenetic experiments; Drs. Stephen David and Michael Roberts for advice on statistical testing; and Drs. Hai Huang, Kevin Bender, and Sid Kuo, and all members of the Trussell lab for helpful discussions during the course of these experiments.
References
- Agoston DV, Kosh JW, Lisziewicz J, Whittaker VP. Separation of recycling and reserve synaptic vesicles from cholinergic nerve terminals of the myenteric plexus of guinea pig ileum. J Neurochem. 1985;44:299–305. doi: 10.1111/j.1471-4159.1985.tb07144.x. [DOI] [PubMed] [Google Scholar]
- Awatramani GB, Turecek R, Trussell LO. Staggered development of GABAergic and glycinergic transmission in the MNTB. J Neurophysiol. 2005;93:819–828. doi: 10.1152/jn.00798.2004. [DOI] [PubMed] [Google Scholar]
- Axmacher N, Stemmler M, Engel D, Draguhn A, Ritz R. Transmitter metabolism as a mechanism of synaptic plasticity: a modeling study. J Neurophysiol. 2004;91:25–39. doi: 10.1152/jn.00797.2003. [DOI] [PubMed] [Google Scholar]
- Bagley EE, Hacker J, Chefer VI, Mallet C, McNally GP, Chieng BC, Perroud J, Shippenberg TS, Christie MJ. Drug-induced GABA transporter currents enhance GABA release to induce opioid withdrawal behaviors. Nat Neurosci. 2011;14:1548–1554. doi: 10.1038/nn.2940. [DOI] [PubMed] [Google Scholar]
- Beato M. The time course of transmitter at glycinergic synapses onto motoneurons. J Neurosci. 2008;28:7412–7425. doi: 10.1523/JNEUROSCI.0581-08.2008. [DOI] [PMC free article] [PubMed] [Google Scholar]
- Beato M, Burzomato V, Sivilotti LG. The kinetics of inhibition of rat recombinant heteromeric alpha1beta glycine receptors by the low-affinity antagonist SR-95531. J Physiol. 2007;580:171–179. doi: 10.1113/jphysiol.2006.126888. [DOI] [PMC free article] [PubMed] [Google Scholar]
- Bell MR, Belarde JA, Johnson HF, Aizenman CD. A neuroprotective role for polyamines in a Xenopus tadpole model of epilepsy. Nat Neurosci. 2011;14:505–512. doi: 10.1038/nn.2777. [DOI] [PubMed] [Google Scholar]
- Bender KJ, Trussell LO. Axon initial segment Ca2+ channels influence action potential generation and timing. Neuron. 2009;61:259–271. doi: 10.1016/j.neuron.2008.12.004. [DOI] [PMC free article] [PubMed] [Google Scholar]
- Bradaïa A, Schlichter R, Trouslard J. Role of glial and neuronal glycine transporters in the control of glycinergic and glutamatergic synaptic transmission in lamina X of the rat spinal cord. J Physiol. 2004;559:169–186. doi: 10.1113/jphysiol.2004.068858. [DOI] [PMC free article] [PubMed] [Google Scholar]
- Burger PM, Hell J, Mehl E, Krasel C, Lottspeich F, Jahn R. GABA and glycine in synaptic vesicles: storage and transport characteristics. Neuron. 1991;7:287–293. doi: 10.1016/0896-6273(91)90267-4. [DOI] [PubMed] [Google Scholar]
- Cabeza R, Collier B. Acetylcholine mobilization in a sympathetic ganglion in the presence and absence of 2-(4-phenylpiperidino)cyclohexanol (AH5183) J Neurochem. 1988;50:112–121. doi: 10.1111/j.1471-4159.1988.tb13237.x. [DOI] [PubMed] [Google Scholar]
- Chang Y, Xie Y, Weiss DS. Positive allosteric modulation by ultraviolet irradiation on GABA(A), but not GABA(C), receptors expressed in Xenopus oocytes. J Physiol. 2001;536:471–478. doi: 10.1111/j.1469-7793.2001.0471c.xd. [DOI] [PMC free article] [PubMed] [Google Scholar]
- Chéry N, de Koninck Y. Junctional versus extrajunctional glycine and GABA(A) receptor-mediated IPSCs in identified lamina I neurons of the adult rat spinal cord. J Neurosci. 1999;19:7342–7355. doi: 10.1523/JNEUROSCI.19-17-07342.1999. [DOI] [PMC free article] [PubMed] [Google Scholar]
- Christensen H, Fykse EM, Fonnum F. Uptake of glycine into synaptic vesicles isolated from rat spinal cord. J Neurochem. 1990;54:1142–1147. doi: 10.1111/j.1471-4159.1990.tb01941.x. [DOI] [PubMed] [Google Scholar]
- Dericioglu N, Garganta CL, Petroff OA, Mendelsohn D, Williamson A. Blockade of GABA synthesis only affects neural excitability under activated conditions in rat hippocampal slices. Neurochem Int. 2008;53:22–32. doi: 10.1016/j.neuint.2008.04.006. [DOI] [PMC free article] [PubMed] [Google Scholar]
- Diana MA, Marty A. Characterization of depolarization-induced suppression of inhibition using paired interneuron–Purkinje cell recordings. J Neurosci. 2003;23:5906–5918. doi: 10.1523/JNEUROSCI.23-13-05906.2003. [DOI] [PMC free article] [PubMed] [Google Scholar]
- Dugué GP, Dumoulin A, Triller A, Dieudonné S. Target-dependent use of co-released inhibitory transmitters at central synapses. J Neurosci. 2005;25:6490–6498. doi: 10.1523/JNEUROSCI.1500-05.2005. [DOI] [PMC free article] [PubMed] [Google Scholar]
- Edwards RH. The neurotransmitter cycle and quantal size. Neuron. 2007;55:835–858. doi: 10.1016/j.neuron.2007.09.001. [DOI] [PubMed] [Google Scholar]
- Efron B, Tibshirani R. Bootstrap methods for standard errors, confidence intervals, and other measures of statistical accuracy. Statist Sci. 1986;1:54–75. [Google Scholar]
- Engel D, Pahner I, Schulze K, Frahm C, Jarry H, Ahnert-Hilger G, Draguhn A. Plasticity of rat central inhibitory synapses through GABA metabolism. J Physiol. 2001;535:473–482. doi: 10.1111/j.1469-7793.2001.00473.x. [DOI] [PMC free article] [PubMed] [Google Scholar]
- Floor E, Leventhal PS, Wang Y, Meng L, Chen W. Dynamic storage of dopamine in rat brain synaptic vesicles in vitro. J Neurochem. 1995;64:689–699. doi: 10.1046/j.1471-4159.1995.64020689.x. [DOI] [PubMed] [Google Scholar]
- Fonnum F, Walberg F. The concentration of GABA within inhibitory nerve terminals. Brain Res. 1973;62:577–579. doi: 10.1016/0006-8993(73)90724-5. [DOI] [PubMed] [Google Scholar]
- Fornés A, Núñez E, Alonso-Torres P, Aragón C, López-Corcuera B. Trafficking properties and activity regulation of the neuronal glycine transporter GLYT2 by protein kinase C. Biochem J. 2008;412:495–506. doi: 10.1042/BJ20071018. [DOI] [PubMed] [Google Scholar]
- Geerlings A, Núñez E, López-Corcuera B, Aragón C. Calcium- and syntaxin 1-mediated trafficking of the neuronal glycine transporter GLYT2. J Biol Chem. 2001;276:17584–17590. doi: 10.1074/jbc.M010602200. [DOI] [PubMed] [Google Scholar]
- Gomeza J, Ohno K, Hülsmann S, Armsen W, Eulenburg V, Richter DW, Laube B, Betz H. Deletion of the mouse glycine transporter 2 results in a hyperekplexia phenotype and postnatal lethality. Neuron. 2003;40:797–806. doi: 10.1016/s0896-6273(03)00673-1. [DOI] [PubMed] [Google Scholar]
- Hori T, Takahashi T. Kinetics of synaptic vesicle refilling with neurotransmitter glutamate. Neuron. 2012;76:511–517. doi: 10.1016/j.neuron.2012.08.013. [DOI] [PubMed] [Google Scholar]
- Ishikawa T, Sahara Y, Takahashi T. A single packet of transmitter does not saturate postsynaptic glutamate receptors. Neuron. 2002;34:613–621. doi: 10.1016/s0896-6273(02)00692-x. [DOI] [PubMed] [Google Scholar]
- Ji F, Kanbara N, Obata K. GABA and histogenesis in fetal and neonatal mouse brain lacking both the isoforms of glutamic acid decarboxylase. Neurosci Res. 1999;33:187–194. doi: 10.1016/s0168-0102(99)00011-5. [DOI] [PubMed] [Google Scholar]
- Jiménez E, Zafra F, Pérez-Sen R, Delicado EG, Miras-Portugal MT, Aragón C, López-Corcuera B. P2Y purinergic regulation of the glycine neurotransmitter transporters. J Biol Chem. 2011;286:10712–10724. doi: 10.1074/jbc.M110.167056. [DOI] [PMC free article] [PubMed] [Google Scholar]
- Jin H, Wu H, Osterhaus G, Wei J, Davis K, Sha D, Floor E, Hsu CC, Kopke RD, Wu JY. Demonstration of functional coupling between gamma-aminobutyric acid (GABA) synthesis and vesicular GABA transport into synaptic vesicles. Proc Natl Acad Sci U S A. 2003;100:4293–4298. doi: 10.1073/pnas.0730698100. [DOI] [PMC free article] [PubMed] [Google Scholar]
- Jonas P, Bischofberger J, Sandkühler J. Corelease of two fast neurotransmitters at a central synapse. Science. 1998;281:419–424. doi: 10.1126/science.281.5375.419. [DOI] [PubMed] [Google Scholar]
- Kanaani J, el-Husseini Ael-D, Aguilera-Moreno A, Diacovo JM, Bredt DS, Baekkeskov S. A combination of three distinct trafficking signals mediates axonal targeting and presynaptic clustering of GAD65. J Cell Biol. 2002;158:1229–1238. doi: 10.1083/jcb.200205053. [DOI] [PMC free article] [PubMed] [Google Scholar]
- Kirmse K, Kirischuk S. Ambient GABA constrains the strength of GABAergic synapses at Cajal-Retzius cells in the developing visual cortex. J Neurosci. 2006;26:4216–4227. doi: 10.1523/JNEUROSCI.0589-06.2006. [DOI] [PMC free article] [PubMed] [Google Scholar]
- Kuo SP, Trussell LO. Spontaneous spiking and synaptic depression underlie noradrenergic control of feed-forward inhibition. Neuron. 2011;71:306–318. doi: 10.1016/j.neuron.2011.05.039. [DOI] [PMC free article] [PubMed] [Google Scholar]
- Latal AT, Kremer T, Gomeza J, Eulenburg V, Hülsmann S. Development of synaptic inhibition in glycine transporter 2 deficient mice. Mol Cell Neurosci. 2010;44:342–352. doi: 10.1016/j.mcn.2010.04.005. [DOI] [PubMed] [Google Scholar]
- Liang SL, Carlson GC, Coulter DA. Dynamic regulation of synaptic GABA release by the glutamate-glutamine cycle in hippocampal area CA1. J Neurosci. 2006;26:8537–8548. doi: 10.1523/JNEUROSCI.0329-06.2006. [DOI] [PMC free article] [PubMed] [Google Scholar]
- Lu T, Rubio ME, Trussell LO. Glycinergic transmission shaped by the corelease of GABA in a mammalian auditory synapse. Neuron. 2008;57:524–535. doi: 10.1016/j.neuron.2007.12.010. [DOI] [PubMed] [Google Scholar]
- Mancilla JG, Manis PB. Two distinct types of inhibition mediated by cartwheel cells in the dorsal cochlear nucleus. J Neurophysiol. 2009;102:1287–1295. doi: 10.1152/jn.91272.2008. [DOI] [PMC free article] [PubMed] [Google Scholar]
- Mathews GC, Diamond JS. Neuronal glutamate uptake Contributes to GABA synthesis and inhibitory synaptic strength. J Neurosci. 2003;23:2040–2048. doi: 10.1523/JNEUROSCI.23-06-02040.2003. [DOI] [PMC free article] [PubMed] [Google Scholar]
- McIntire SL, Reimer RJ, Schuske K, Edwards RH, Jorgensen EM. Identification and characterization of the vesicular GABA transporter. Nature. 1997;389:870–876. doi: 10.1038/39908. [DOI] [PubMed] [Google Scholar]
- Mosharov EV, Gong LW, Khanna B, Sulzer D, Lindau M. Intracellular patch electrochemistry: regulation of cytosolic catecholamines in chromaffin cells. J Neurosci. 2003;23:5835–5845. doi: 10.1523/JNEUROSCI.23-13-05835.2003. [DOI] [PMC free article] [PubMed] [Google Scholar]
- Mugnaini E, Berrebi AS, Dahl AL, Morgan JI. The polypeptide PEP-19 is a marker for Purkinje neurons in cerebellar cortex and cartwheel neurons in the dorsal cochlear nucleus. Arch Ital Biol. 1987;126:41–67. [PubMed] [Google Scholar]
- Nabekura J, Katsurabayashi S, Kakazu Y, Shibata S, Matsubara A, Jinno S, Mizoguchi Y, Sasaki A, Ishibashi H. Developmental switch from GABA to glycine release in single central synaptic terminals. Nat Neurosci. 2004;7:17–23. doi: 10.1038/nn1170. [DOI] [PubMed] [Google Scholar]
- Obata K, Otsuka M, Tanaka Y. Determination of gamma-aminobutyric acid in single nerve cells of cat central nervous system. J Neurochem. 1970;17:697–698. doi: 10.1111/j.1471-4159.1970.tb00550.x. [DOI] [PubMed] [Google Scholar]
- Otis TS, Wu YC, Trussell LO. Delayed clearance of transmitter and the role of glutamate transporters at synapses with multiple release sites. J Neurosci. 1996;16:1634–1644. doi: 10.1523/JNEUROSCI.16-05-01634.1996. [DOI] [PMC free article] [PubMed] [Google Scholar]
- Otsuka M, Obata K, Miyata Y, Tanaka Y. Measurement of gamma-aminobutyric acid in isolated nerve cells of cat central nervous system. J Neurochem. 1971;18:287–295. doi: 10.1111/j.1471-4159.1971.tb00567.x. [DOI] [PubMed] [Google Scholar]
- Porter TG, Martin DL. Chelidonic acid and other conformationally restricted substrate analogues as inhibitors of rat brain glutamate decarboxylase. Biochem Pharmacol. 1985;34:4145–4150. doi: 10.1016/0006-2952(85)90207-2. [DOI] [PubMed] [Google Scholar]
- Potter LT. Synthesis, storage and release of [14C]acetylcholine in isolated rat diaphragm muscles. J Physiol. 1970;206:145–166. doi: 10.1113/jphysiol.1970.sp009003. [DOI] [PMC free article] [PubMed] [Google Scholar]
- Roberts MT, Trussell LO. Molecular layer inhibitory interneurons provide feedforward and lateral inhibition in the dorsal cochlear nucleus. J Neurophysiol. 2010;104:2462–2473. doi: 10.1152/jn.00312.2010. [DOI] [PMC free article] [PubMed] [Google Scholar]
- Roberts MT, Bender KJ, Trussell LO. Fidelity of complex spike-mediated synaptic transmission between inhibitory interneurons. J Neurosci. 2008;28:9440–9450. doi: 10.1523/JNEUROSCI.2226-08.2008. [DOI] [PMC free article] [PubMed] [Google Scholar]
- Rousseau F, Aubrey KR, Supplisson S. The glycine transporter GlyT2 controls the dynamics of synaptic vesicle refilling in inhibitory spinal cord neurons. J Neurosci. 2008;28:9755–9768. doi: 10.1523/JNEUROSCI.0509-08.2008. [DOI] [PMC free article] [PubMed] [Google Scholar]
- Rubio ME, Juiz JM. Differential distribution of synaptic endings containing glutamate, glycine, and GABA in the rat dorsal cochlear nucleus. J Comp Neurol. 2004;477:253–272. doi: 10.1002/cne.20248. [DOI] [PubMed] [Google Scholar]
- Searl T, Prior C, Marshall IG. Acetylcholine recycling and release at rat motor nerve terminals studied using (-)-vesamicol and troxpyrrolium. J Physiol. 1991;444:99–116. doi: 10.1113/jphysiol.1991.sp018868. [DOI] [PMC free article] [PubMed] [Google Scholar]
- Smith SM, Zorec R, McBurney RN. Conductance states activated by glycine and GABA in rat cultured spinal neurones. J Membr Biol. 1989;108:45–52. doi: 10.1007/BF01870424. [DOI] [PubMed] [Google Scholar]
- Smith TC, Jahr CE. Self-inhibition of olfactory bulb neurons. Nat Neurosci. 2002;5:760–766. doi: 10.1038/nn882. [DOI] [PubMed] [Google Scholar]
- Supplisson S, Roux MJ. Why glycine transporters have different stoichiometries. FEBS Lett. 2002;529:93–101. doi: 10.1016/s0014-5793(02)03251-9. [DOI] [PubMed] [Google Scholar]
- Van der Kloot W. Loading and recycling of synaptic vesicles in the Torpedo electric organ and the vertebrate neuromuscular junction. Prog Neurobiol. 2003;71:269–303. doi: 10.1016/j.pneurobio.2003.10.003. [DOI] [PubMed] [Google Scholar]
- Vincent P, Marty A. Fluctuations of inhibitory postsynaptic currents in Purkinje cells from rat cerebellar slices. J Physiol. 1996;494:183–199. doi: 10.1113/jphysiol.1996.sp021484. [DOI] [PMC free article] [PubMed] [Google Scholar]
- Wang L, Jiang H, Brigande JV. Gene transfer to the developing mouse inner ear by in vivo electroporation. J Vis Exp. 2012;64:e3653. doi: 10.3791/3653. [DOI] [PMC free article] [PubMed] [Google Scholar]
- Wei J, Wu JY. Post-translational regulation of L-glutamic acid decarboxylase in the brain. Neurochem Res. 2008;33:1459–1465. doi: 10.1007/s11064-008-9600-5. [DOI] [PubMed] [Google Scholar]
- Wenthold RJ, Huie D, Altschuler RA, Reeks KA. Glycine immunoreactivity localized in the cochlear nucleus and superior olivary complex. Neuroscience. 1987;22:897–912. doi: 10.1016/0306-4522(87)92968-x. [DOI] [PubMed] [Google Scholar]
- Whittaker VP. Cholinergic synaptic vesicles from the electromotor nerve terminals of Torpedo. Composition and life cycle. Ann N Y Acad Sci. 1987;493:77–91. doi: 10.1111/j.1749-6632.1987.tb27185.x. [DOI] [PubMed] [Google Scholar]
- Williams J. How does a vesicle know it is full? Neuron. 1997;18:683–686. doi: 10.1016/s0896-6273(00)80308-6. [DOI] [PubMed] [Google Scholar]
- Xu TX, Gong N, Xu TL. Inhibitors of GlyT1 and GlyT2 differentially modulate inhibitory transmission. Neuroreport. 2005;16:1227–1231. doi: 10.1097/00001756-200508010-00019. [DOI] [PubMed] [Google Scholar]
- Zafra F, Aragón C, Olivares L, Danbolt NC, Giménez C, Storm-Mathisen J. Glycine transporters are differentially expressed among CNS cells. J Neurosci. 1995;15:3952–3969. doi: 10.1523/JNEUROSCI.15-05-03952.1995. [DOI] [PMC free article] [PubMed] [Google Scholar]