

Aneuploidy causes cell proliferation defects in budding yeast, with many aneuploid strains exhibiting a G1 delay. This study shows that the G1 delay in aneuploid budding yeast is caused by a growth defect and delayed passage through START due to delayed G1 cyclin accumulation.
Abstract
Aneuploidy, a chromosome content that is not a multiple of the haploid karyotype, is associated with reduced fitness in all organisms analyzed to date. In budding yeast aneuploidy causes cell proliferation defects, with many different aneuploid strains exhibiting a delay in G1, a cell cycle stage governed by extracellular cues, growth rate, and cell cycle events. Here we characterize this G1 delay. We show that 10 of 14 aneuploid yeast strains exhibit a growth defect during G1. Furthermore, 10 of 14 aneuploid strains display a cell cycle entry delay that correlates with the size of the additional chromosome. This cell cycle entry delay is due to a delayed accumulation of G1 cyclins that can be suppressed by supplying cells with high levels of a G1 cyclin. Our results indicate that aneuploidy frequently interferes with the ability of cells to grow and, as with many other cellular stresses, entry into the cell cycle.
INTRODUCTION
In most eukaryotes, the decision of whether or not to enter the cell cycle is made in G1 and governed by extracellular and intracellular cues (reviewed in Turner et al., 2012). Identifying and characterizing the pathways that regulate this decision is critical for understanding not only normal cell division, but also the abnormal cell divisions that are seen in cancer. The molecular events governing entry into the cell cycle—known as START—are well characterized in budding yeast (Jorgensen and Tyers, 2004). During early G1, the cyclin-dependent kinase (CDK) Cdc28 is activated by the Cln3 cyclin subunit in a manner that is intimately coordinated with growth rate and extracellular signals such as nutrient availability and the presence of mating pheromone (reviewed in Turner et al., 2012). In turn, Cln3-CDKs regulate the transcriptional inhibitor Whi5. During G1, Whi5 localizes to the nucleus, where it inhibits the SBF transcription factor complex (Costanzo et al., 2004; de Bruin et al., 2004). This complex (composed of Swi4 and Swi6) and a similar complex MBF (composed of Mbp1 and Swi6) activate the transcriptional program essential for DNA replication and bud formation (Futcher, 2002). Key among SBF's targets are the two G1 cyclin-encoding genes CLN1 and CLN2 (Cross et al., 1994; Stuart and Wittenberg, 1994). Cln1/2-CDKs trigger S phase and budding.
Cln3-CDKs phosphorylate Whi5 (Costanzo et al., 2004; de Bruin et al., 2004), triggering nuclear export of this transcriptional inhibitor and allowing SBF-dependent transcription to begin and Cln1/2-CDKs to accumulate. This sets in motion a positive feedback loop in which Cln1/2 CDKs further phosphorylate Whi5, promoting its nuclear export and hence SBF-meditated transcription of CLN1 and CLN2 (Skotheim et al., 2008). Once cells have accumulated enough Cln-CDK activity, proteins critical for bud formation and initiation of DNA replication are phosphorylated, driving entry into the cell cycle (Bloom and Cross, 2007). Pathways parallel to CLN3 also promote entry into the cell cycle. BCK2 promotes passage through START in parallel to CLN3 by inducing CLN1/2 transcription by an unknown mechanism (Epstein and Cross, 1994; Di Como et al., 1995).
Activation of the Cln3-CDK cascade is controlled by macromolecule biosynthesis rates (reviewed in Turner et al., 2012). Cell growth controls cell cycle progression by influencing the critical size, which is the volume at which cells enter the cell cycle (Rupes, 2002). In general, slow-growing cells enter the cell cycle at smaller volumes than cells growing at faster rates (Jorgensen and Tyers, 2004; Ferrezuelo et al., 2012). In other words, a higher growth rate leads to an increase in critical cell size. How growth rate controls the G1 cell cycle machinery is poorly understood. So far, only one mechanism—translational regulation of Cln3—has been described by which growth rate affects the G1 cell cycle machinery (Polymenis and Schmidt, 1997). However, additional mechanisms must exist that link growth rate to cell cycle entry, as the consequences of interfering with this CLN3 regulatory mechanism are subtle (Polymenis and Schmidt, 1997). Whatever these additional mechanisms are, it is clear that Cln-CDKs must be the target, as modulating Cln-CDK activity affects the critical cell size. For example, overexpression of any of the G1 cyclins (CLN1, CLN2, or CLN3) leads to a “small-cell” phenotype, whereas their deletion causes a “large-cell” phenotype (Tyers et al., 1992, 1993).
We previously constructed a series of haploid budding yeast strains that are disomic for one or two chromosomes (henceforth disomes; Torres et al., 2007). All strains were found to exhibit proliferation defects compared with a wild-type strain. Analysis of cell cycle progression of aneuploid yeast strains released from a pheromone-induced G1 arrest showed that most disomes exhibit a delay in CLN2 expression and cell cycle entry (Torres et al., 2007). Here we further characterize the defects underlying the G1 delay in these strains. We find that most of the disomes (10 of 14) exhibit a growth defect during G1. Entry into the cell cycle is also delayed in 10 of 14 strains, resulting in an increase in critical cell size that correlates with the degree of aneuploidy. Our analyses further show that a defect in G1 cyclin accumulation underlies the G1 delay of disomic strains, which can be suppressed by supplying cells with high levels of CLN2. Our results indicate that aneuploidy causes a G1 delay in most strains analyzed by interfering with cell growth and/or the activation of the Cln3-CDK cascade.
RESULTS
G1 is extended in most disomic yeast strains
The 20 disomic budding yeast strains we previously generated (Torres et al., 2007) share a number of phenotypes, prominent among them a delay in entry into S phase after release from an α-factor pheromone-induced G1 arrest. Sixteen of 20 aneuploid yeast strains exhibited a delay in bud formation and initiation of DNA replication, ranging from 10 to 20 min (Torres et al., 2007). Treatment of cells with pheromone inhibits cell cycle progression, but cell growth continues, disrupting the coordination of cell growth and division. Thus pheromone block-release experiments do not allow one to determine whether cell growth or cell cycle entry (or both) is impaired in aneuploid yeast cells.
To characterize the effects of aneuploidy on cell growth and cell cycle entry, we isolated small, unbudded cells using centrifugal elutriation and examined their growth and cell cycle entry properties. We chose 2 aneuploid yeast strains for this analysis that did not exhibit a G1 delay upon pheromone release (strains disomic for chromosomes II and V) and 12 strains that showed cell cycle entry delays after release from an α-factor arrest (strains disomic for chromosomes IV, VIII, X, XI, XII, XIII, XIV, XV, XVI, VIII + XIV, XI + XV, and XI + XVI; Supplemental Figure S1). Consistent with our previous studies (Torres et al., 2007), strains disomic for chromosomes II and V did not exhibit a cell cycle entry delay as judged by the time to bud formation after isolation of isovolumetric populations of wild-type and disomic cells (Supplemental Figure S1, A and C). Cell cycle entry was delayed in all other disomic yeast strains tested, with delays ranging from ∼5 min for disome XIII to ∼110 min for disome IV. We conclude that most of the disomic yeast strains tested are delayed in cell cycle entry.
Critical cell size is increased in many disomic strains
A delay in cell cycle entry can be caused by a cell cycle defect that culminates in a delay in the accumulation of Cln-CDK activity, slowed growth, or a combination of both. Cell cycle entry delays caused by defects in the cell cycle machinery promoting the G1–S transition result in an increase in critical cell size (Rupes, 2002). We found that 10 of 14 aneuploid strains analyzed showed an increase in critical cell size, defined by the modal cell volume corresponding to half-maximal budding (Figure 1, A–N, and Table 1). This increase in critical size ranged from 3 fl for disome VIII + XIV to 22 fl for disome XI + XV. Of interest, the increase in critical size correlates with the size of the additional chromosome (Figure 1O), suggesting that some aspect of aneuploidy proportional to the amount of additional genetic material contributes to the increase in critical size.
FIGURE 1:

Cells carrying an extra chromosome delay entry into the cell cycle by increasing the critical size for budding. Wild-type (A–N; A11311, filled circles) and disomes (open circles) II (A; A6865), IV (B; A12687), V (C; A14479), VIII (D; A13628), X (E; A21986), XI (F; A13771), XII (G; A12694), XIII (H; A21987), XIV (I; A13979), XV (J; A12697), XVI (K; A12700), XI + XV (L; A12691), XI + XVI (M; A12699), and VIII + XIV (N; A15615) were grown at 30°C in selective medium supplemented with 2% raffinose. Small, unbudded cells were isolated by centrifugal elutriation and released into the cell cycle at 30°C in YEPD. Time points were taken every 15 min to measure cell volume and the percentage of budded cells. (O) Correlation between the critical size for budding and the size of the extra chromosome in the disome. The critical size (shown as percentage of wild-type critical size for each experiment) is positively correlated with the size of the extra chromosome (r2 = 0.41, p = 0.019). Disome XII was excluded from the correlation analysis due to variations in ribosomal DNA copy number, which preclude determination of the exact chromosome size.
TABLE 1:
Critical sizes and growth constants of disomic cells.
| Strain | Critical size (fl)a | Critical size, percentage of wild type | Exponential growth constant, k (min−1)a | Exponential growth constant, percentage of wild type |
|---|---|---|---|---|
| Dis II | 35 (38) | 92 | 0.006144 (0.005882) | 104 |
| Dis IV | 53 (39) | 136 | 0.004667 (0.006939) | 67 |
| Dis V | 33 (40) | 83 | 0.006101 (0.007391) | 83 |
| Dis VIII | 46 (38) | 121 | 0.006339 (0.007433) | 85 |
| Dis X | 40 (35) | 114 | 0.006894 (0.006931) | 99 |
| Dis XI | 55 (40) | 138 | 0.005967 (0.006944) | 86 |
| Dis XII | 53 (38) | 139 | 0.004160 (0.005239) | 79 |
| Dis XIII | 40 (40) | 100 | 0.004738 (0.005839) | 81 |
| Dis XIV | 41 (36) | 114 | 0.006343 (0.007126) | 89 |
| Dis XV | 52 (39) | 133 | 0.005213 (0.005098) | 102 |
| Dis XVI | 36 (38) | 95 | 0.005558 (0.007879) | 71 |
| Dis XI + XV | 60 (38) | 158 | 0.006480 (0.007471) | 87 |
| Dis XI + XVI | 54 (37) | 146 | 0.005835 (0.008001) | 73 |
| Dis VIII + XIV | 42 (39) | 108 | 0.006196 (0.006460) | 96 |
| Diploid | 70 (38) | — | — | — |
aValues in parentheses are the haploid wild-type results for each experiment.
To determine whether the delay in cell cycle entry was proportional to the amount of additional DNA or proportional to other factors dependent on chromosome size such as the amount of yeast gene products produced from the additional chromosomes, we examined the critical sizes of yeast strains containing human DNA carried by yeast artificial chromosomes (YACs). We do not know whether transcription occurs from the human DNA; however, due to the fundamentally different splicing mechanisms in yeast and mammals, any mRNA produced from the YAC is likely to produce few, if any, functional gene products. This allowed us to examine the effect of excess chromosomal DNA on G1–S phase progression, without excess gene products.
Introduction of an 850-, 670-, or 620-kb YAC did not delay cell cycle entry as judged by budding (Figure 2). We conclude that additional functional yeast chromosomes, but not chromosome-sized amounts of DNA that do not produce yeast gene products, cause an increase in critical size. This increase in critical size is proportional to the size of the additional chromosome and thus the amount of additional genes, as chromosomes in yeast are densely packed with genes.
FIGURE 2:
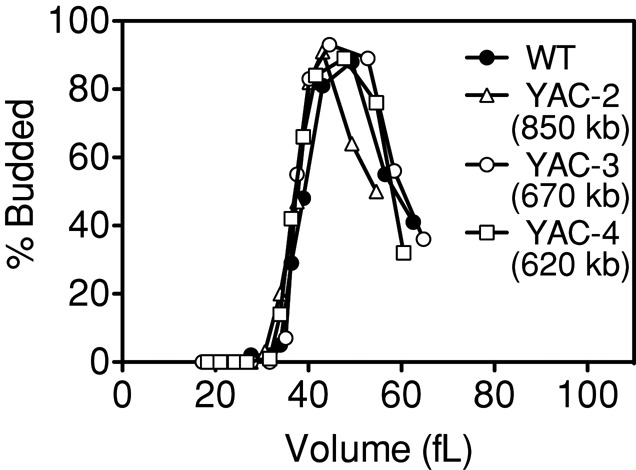
Yeast artificial chromosomes carrying human DNA do not cause an increase in critical size. Wild-type (A11311, filled circles), YAC-2 (A17392, 850 kb, open triangles), YAC-3 (A17393, 670 kb, open circles), and YAC-4 (A17394, 620 kb, open squares) cells were grown at 30°C in selective medium supplemented with 2% raffinose. Small, unbudded cells were isolated by centrifugal elutriation and released into the cell cycle at 30°C in YEPD. Time points were taken every 15 min to measure cell volume and the percentage of budded cells.
Cell volume accumulation in G1 is slowed in aneuploid yeast strains
Following elutriated cells as they progress through G1 also allowed us to assess the effects of disomy on cell growth during G1, monitored by cell volume accumulation. This was of interest because slow growth can delay entry into the cell cycle. For example, cells lacking Sfp1, a transcription factor required for ribosome biogenesis (Fingerman et al., 2003), exhibit a severe G1 delay (Jorgensen et al., 2002; Hoose et al., 2012). sfp1Δ cells obtained by centrifugal elutriation take a longer time to enter the cell cycle than wild-type cells as judged by bud formation (Supplemental Figure S2A; Jorgensen and Tyers, 2004; Hoose et al., 2012). Cell volume measurements during G1 show that sfp1Δ cells have a cell volume accumulation rate ∼50% of wild type when G1 time points (<20% budded) were fit to an exponential function and a critical size smaller than wild type, consistent with other reports (Supplemental Figure S2, B–D; Jorgensen et al., 2002; Hoose et al., 2012).
To determine whether a growth defect contributes to the G1 delay observed in aneuploid cells, we examined rates of volume increase of aneuploid and euploid cells during G1. We isolated small, unbudded cells using centrifugal elutriation and monitored cell volume as a function of time. Of the 14 aneuploid strains analyzed, we found that 10 exhibited a defect in volume accumulation (Figure 3 and Supplemental Figure S3). This is easily seen when size distributions of wild-type and aneuploid cells of the same volume are compared with size distributions after growth in rich medium for 60 min (Figure 3, B, D, F, and H).
FIGURE 3:

Cells carrying an extra chromosome show a decrease in growth rate during G1. (A–H) Wild-type (A–H; A11311, black), disome IV (A, B; A12687, red), disome XIV (C, D; A13979, red), disome XV (E, F; A12697, red), and disome XVI (G, H; A12700, red) cells were grown at 30°C in selective medium supplemented with 2% raffinose. Small, unbudded cells were isolated by centrifugal elutriation and released into the cell cycle at 30°C in YEPD. Time points were taken every 15 min to monitor cell volume. G1 time points (<20% budded cells in the population) were fitted to an exponential function to determine growth parameters. (B, D, F, H) Cell size distributions for elutriated wild-type (black) and disomic cells (red) of the same volume and after 1 h of growth in YEPD medium. (I) Distribution of growth constants for disomes II (A6865), IV (A12687), V (A14479), VIII (A13628), X (A21986), XI (A13771), XII (A12694), XIII (A21987), XIV (A13979), XV (A12697), XVI (A12700), XI + XV (A12691), XI + XVI (A12699), and VIII + XIV (A15615) are shown as the percentage of the wild-type (A11311) growth constant for each experiment. Disomes IV, XVI, and XI + XVI (red) show growth rates <75% of wild type; disomes V, VIII, XI, XII, XIII, XIV, and XI + XV (yellow) show growth rates 75–90% of wild type; and disomes II, X, XV, and VIII + XIV (green) show growth rates 90–110% of wild-type.
To determine the growth rate during G1, we fit the plots of volume increase versus time to exponential functions, restricting this analysis to time points in which <20% of the cells in the population were budded. Growth rates were reduced in 10 of 14 aneuploid strains; this reduction is best observed when the growth rate is shown as a percentage of the wild-type control (Figure 3I and Table 1). Three strains (disomes IV, XVI, and XI + XVI) showed growth rates of <75% of wild type (Figure 3I, red); seven strains (disomes V, VIII, XI, XII, XIII, XIV, and XI + XV) exhibited growth rates between 75 and 90% of wild type (Figure 3I, yellow); and four strains (disomes II, X, XV, and VIII + XIV) grew as well as wild-type cells (Figure 3I, green). The decreases in growth rates of aneuploid strains were significant (p = 0.0007, paired Student's t test); however, the extent of the growth defect did not correlate with the size of the additional chromosome (Supplemental Figure S3K).
The growth properties of disome XVI cells are particularly notable, as the delay in bud formation observed in this strain is entirely due to a defect in cell volume accumulation. Critical cell size was not affected in disome XVI, yet budding was delayed for almost 40 min (Table 1, Figure 1K, and Supplemental Figure S1K). Cell volume measurements showed that growth was impaired in disome XVI cells (Figure 3, G and H), providing an explanation for the delay in bud formation. It is possible that the additional copy of CLN2 located on chromosome XVI masks any cell cycle defect, as G1 cyclin levels are rate limiting for cell cycle entry (Futcher, 1996). In summary, our results indicate that most aneuploid strains analyzed show a reduced growth rate in G1. In contrast to the increased critical size observed in aneuploid cells, the severity of the cell volume accumulation defect is not correlated with the amount of additional DNA (Supplemental Figure S3K). These findings suggest that gene-specific effects, and not general features of aneuploidy, are responsible for the cell volume accumulation defect seen in the disomic strains.
Decreased growth rates in aneuploid cells are not due to gross amino acid biosynthesis defects
Our data show that aneuploid yeast strains exhibit both growth defects and cell cycle entry delays. We decided to first characterize the growth defect in more detail. To determine whether the G1 growth defect was due to a lack of amino acids, we measured pools of free intracellular amino acids in aneuploid cells. We analyzed sfp1Δ cells for comparison, as this mutant is able to synthesize amino acids but grows slowly due to defects in ribosome biogenesis (Fingerman et al., 2003).
To measure intracellular amino acid pools, we grew cells in medium supplemented with the essential amino acids for these strains (lysine, leucine, tryptophan, and methionine). Levels of the amino acids alanine, asparagine, aspartate, glycine, histidine, isoleucine, phenylalanine, proline, serine, threonine, tyrosine, and valine, as well the intermediates of the TCA cycle, were quantified using time-of-flight mass spectrometry. Intracellular amino acid pools were not lower in disomic strain IV, VIII, XI, XV, or XVI (Figure 4), indicating that amino acid abundance (at least of the amino acids measured) was not affected in aneuploid strains. In fact, disome IV showed consistently higher levels of most amino acids (except aspartate and isoleucine) and TCA cycle intermediates. Increased amino acid levels in disome IV cells may be related to the significant proliferation defect of this disome, as this phenotype is also seen in the sfp1Δ strain, which proliferates slowly (Figure 4R).
FIGURE 4:

Amino acids and organic acid levels are not altered in aneuploid cells. (A–R) Metabolomic analysis of wild-type (A11311), sfp1Δ (A3009), and disomes IV (A12687), VIII (A13628), XI (A13771), XV (A12697), and XVI (A12700). Cells were grown in synthetic medium supplemented with the necessary nutrients for growth (see Materials and Methods). Metabolites were extracted, separated by gas chromatography, and quantified by time-of-flight mass spectrometry. Error bars, SEM. n ≥ 5 for metabolites (A–Q), and n = 4 for doubling time (R). (S) Overview of TCA cycle.
Consistent with the conclusion that free amino acids are not limiting in aneuploid cells is the observation that aneuploid cells do not exhibit a starvation response (Supplemental Figure S4). GCN4 encodes a transcription factor that controls the expression of 30 amino acid biosynthetic genes (Hinnebusch, 2005). Its abundance is translationally regulated; upon amino acid starvation, GCN4 translation is increased (Hinnebusch, 2005). We monitored a GCN4-LacZ reporter construct (Hinnebusch, 1985) by LacZ activity in the absence or presence of amino acid starvation induced by the addition of 3-amino-1,2,4-triazole (3-AT), a competitive inhibitor of an intermediate step in histidine synthesis. In the absence of 3-AT, all disomes tested (IV, VIII, XI, XV, and XVI) showed similar levels of LacZ activity to the euploid control (Supplemental Figure S4, gray bars). In the presence of 3-AT, disomic cells exhibited an increase in LacZ activity due to GCN4-LacZ translational up-regulation, consistent with the euploid control (Supplemental Figure S4, white bars). Therefore we conclude that the disomes analyzed do not exhibit a starvation response under normal growth conditions and are not defective in eliciting a starvation response. Thus the slower growth rate seen in aneuploid cells is not the result of limiting amounts of amino acids but is likely due to decreased rates of biomass production.
Effects of disomy XVI on translation
Next we examined whether defects in translation are responsible for the growth defects observed in the disomic yeast strains. For this analysis we chose disome XVI, as this strain exhibits one of the most dramatic growth defects of the disomes yet does not show a cell cycle entry delay as judged by critical cell size measurements. Incorporation studies with [35S]methionine did not reveal any significant differences between wild-type and disome XVI cells (data not shown), yet we were able to detect defects in [35S]methionine incorporation in sfp1Δ cells (data not shown), which exhibit a severe growth defect (Jorgensen et al., 2002; Hoose et al., 2012); Supplemental Figure S2). Although a decrease in growth rate of disome XVI was detected by cell volume measurements (Figure 3 and Table 1), changes were not evident when translation was examined using polysome profiling (Figure 5A). These results indicate that this disomic strain does not suffer from dramatic translation defects.
FIGURE 5:
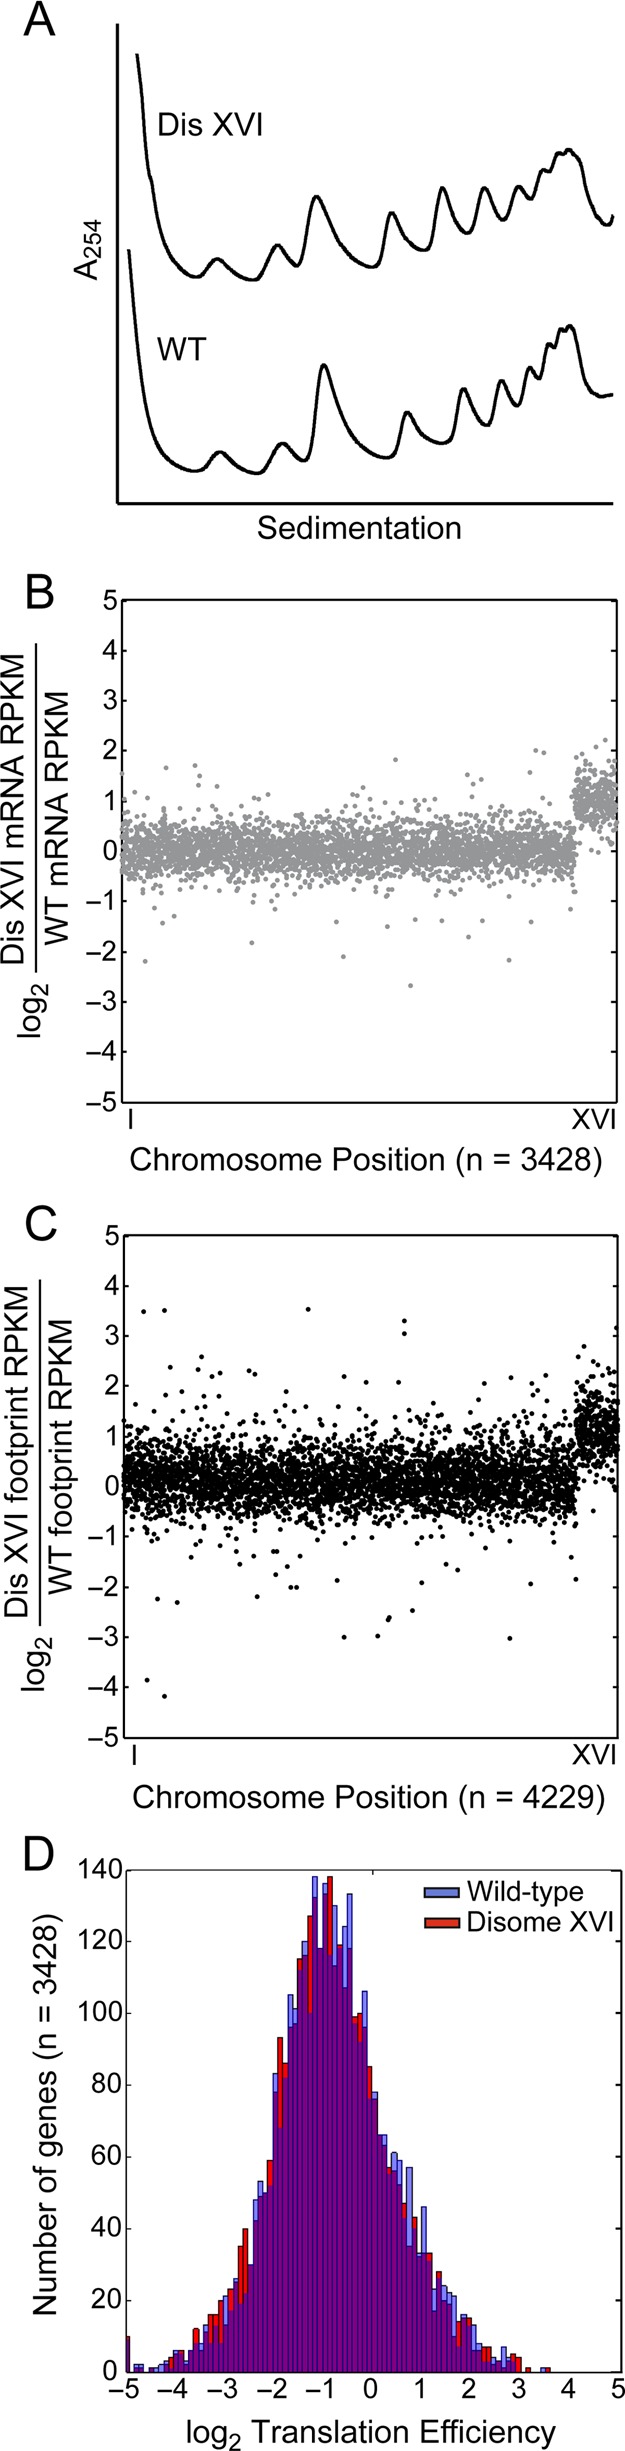
Translational efficiency is not altered in disome XVI. (A) Polysome profiles of wild-type (A22361) and disome XVI (A12700) cells. (B–D) Analysis of translation in wild-type (A11311) and disome XVI (A12700) cells. (B) The log2 ratio of disome XVI to wild-type mRNA RPKM values is shown with the x-axis representing genes in rank order by chromosomal location. Genes included have 128 raw counts between the wild-type and disomic strains. (C) The log2 ratio of disome XVI to wild-type ribosome footprint RPKM values is shown with the x-axis representing genes in rank order by chromosomal location. Genes included have 128 raw counts between the wild-type and disomic strains. (D) Translation efficiency [TE = (ribosome footprint RPKM)/(mRNA RPKM)] was calculated for each gene with at least 128 summed raw counts between mRNA and footprints in both the disomic and wild-type strains. log2 TE values are represented as a histogram.
Because disome XVI cells did not show major translation defects by polysome profiling or [35S]methionine incorporation, we measured translation efficiency in this strain to determine whether translation efficiencies of individual genes were altered. Consistent with previous studies (Torres et al., 2007, 2010), we found that disome XVI cells have twice the amount of mRNA of genes located on chromosome XVI as wild-type cells (Figure 5B), and these additional mRNAs are translated, as judged by their association with ribosomes (Figure 5C). Of importance, we observed no major shifts in relative translation efficiency between wild-type and disome XVI cells (Figure 5D). In summary, our data indicate that many disomic yeast strains exhibit a subtle growth defect that is detected only by cell volume measurements. Given that all chromosomes are efficiently translated in disome XVI cells, we conclude that the decreased growth rate of this disome is not due to major translational defects or changes in translation efficiencies of individual genes.
Aneuploid cells exhibit delays in the transcriptional program governing the G1–S transition
Most disomic yeast strains are defective in cell cycle entry, having a cell volume larger than that of wild type at the time of budding (Figure 1 and Table 1). We next wanted to determine the basis for this defect. The genetic program governing entry into the cell cycle culminates in the expression of the G1 cyclins CLN1 and CLN2 (Dirick et al., 1995). To determine whether the increased cell volume of disomic cells at the time of budding was due to a defect in cyclin expression, we examined CLN2 mRNA levels in disomes IV, XI, and XV, which have larger critical sizes than wild-type cells (Figure 1, B, F, and J). Small, unbudded cells were isolated by centrifugal elutriation, and CLN2 mRNA levels were measured as a function of cell volume. These analyses showed that transcription of CLN2 occurred at a larger cell volume in the three disomic strains tested than in wild-type cells (Figure 6, A, B, and D). Maximal CLN2 transcription occurred at 42, 48–50, and 43 fl in disome IV, XI, and XV cells, respectively, whereas CLN2 levels were maximal in wild-type cells at a size of 26–35 fl. We conclude that CLN2 transcription occurs at a larger cell volume in disome IV, XI, and XV strains. This finding is consistent with our previous studies of CLN2 expression in disomic strains released from a pheromone-induced G1 arrest, which also revealed delays in CLN2 transcription (Torres et al., 2007).
FIGURE 6:
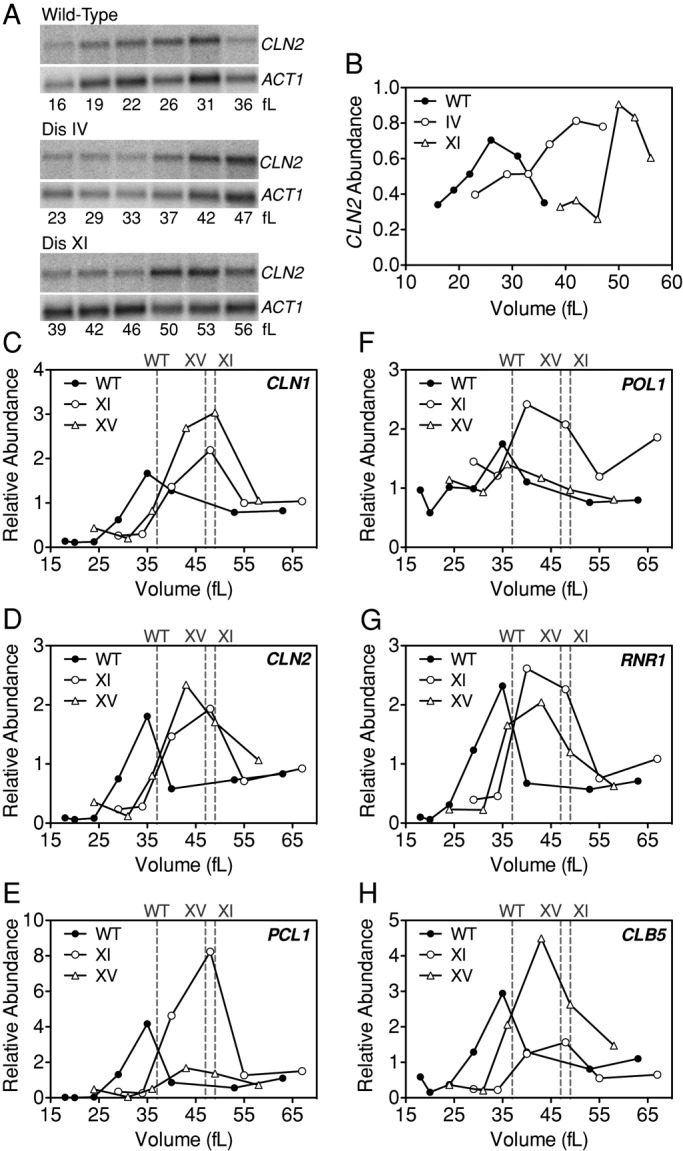
Transcription of CLN2 and other SBF and MBF targets is delayed in disomes IV, XI, and XV. Disomic and wild-type cells were grown at 30°C in selective medium supplemented with 2% raffinose to mid–log phase. Small, unbudded cells were isolated by centrifugal elutriation and released into the cell cycle at 30°C in YEPD. Samples were taken to measure RNA levels and cell volume. (A, B) CLN2 RNA levels were examined in wild-type (A11311), disome IV (A12687), and disome XI (A13771) cells. ACT1 was used as a loading control. (B) Quantification of CLN2 levels in A normalized by ACT1. (C–H) RNA levels of the SBF targets CLN1 (C), CLN2 (D), and PCL1 (E) and of the MBF targets POL1 (F) RNR1 (G), and CLB5 (H) were determined by real-time reverse transcription-PCR in wild-type (C–H; A11311, filled circles), disome XI (C–H; A28266, open circles), and disome XV (C–H; A27930, open triangles). Transcript levels were normalized to ACT1 levels. Dashed lines indicate the critical sizes (modal volume at half-maximum of budding) for each strain.
SBF and MBF, two transcription factor complexes with overlapping specificities, control transcription of ∼200 genes important for events in late G1 and S phase (Ferrezuelo et al., 2010). SBF and MBF targets are cell cycle regulated, peaking at the G–S transition (Futcher, 2002). To determine whether the entire G1–S transcriptional program was delayed in aneuploid cells with a G1 delay, we analyzed the expression of three SBF targets (CLN1, CLN2, and PCL1) and three MBF targets (POL1, CLB5, and RNR1) in disomes XI and XV as a function of cell volume. Peak expression of all SBF and MBF targets tested occurred at a larger cell volume in both disomic strains (Figure 6, C–H), suggesting that SBF and MBF activation is delayed in these aneuploid strains.
Xbp1 is a stress-induced transcriptional repressor that can inhibit transcription of G1 cyclins, delaying cell cycle entry under stressful conditions (Mai and Breeden, 1997, 2000). Deletion of XBP1 had no significant effect on the critical size of wild-type or disome VIII and XI cells (Supplemental Figure S5), suggesting that inhibition of cyclin expression by Xbp1 is not causing the G1 delay seen in the disomes. We conclude that the SBF and MBF transcription program is delayed in disomic yeast cells, and this delay is not caused by Xbp1-mediated inhibition of G1 cyclin expression.
The SBF and MBF transcriptional program is delayed, suggesting that aneuploidy interferes with the G1–S transition upstream of CLN2 expression; however, this does not exclude the possibility of aneuploidy also interfering with entry into S phase at a step following CLN1/2 expression. To address this possibility, we examined whether overexpression of CLN2, which is known to accelerate entry into the cell cycle (reviewed in Turner et al., 2012), suppresses the increase in critical size of cells disomic for chromosome IV, VIII, or XI. CLN2 was overexpressed from the galactose-inducible GAL1-10 promoter for 1 h, and then small, unbudded cells were isolated by centrifugal elutriation. Because cells were grown in medium supplemented with raffinose and galactose as the carbon source, euploid cells expressing wild-type levels of CLN2 budded at a smaller critical size of 29 fl (Figure 7A). As expected, overexpression of CLN2 reduced the critical size of cells: wild-type cells overexpressing CLN2 exhibited a critical size of 22 fl (Figure 7B and Supplemental Table S1). Overexpression of CLN2 suppressed the cell cycle entry defect of disomes IV, VIII, and XI (Figure 7B), with critical sizes of 19, 20, and 25 fl compared with critical sizes of 34, 44, and 50 fl, respectively, for those not overexpressing CLN2. We conclude that the increase in critical size in aneuploid cells is due to a delay in CLN2 expression.
FIGURE 7:
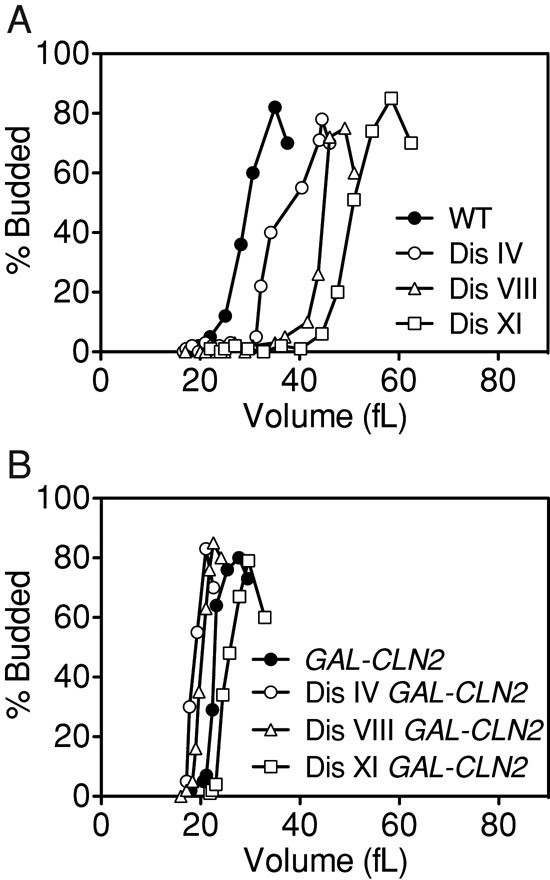
Overexpression of CLN2 suppresses the critical size increase in disomes IV, VIII, and XI. Wild-type (B; A25475, filled circles), disome IV (B; A25477, open circles), disome VIII (B; A25476, open triangles), and disome XI (B; A25474, open squares) cells carrying a GAL-CLN2 construct and wild-type (A; A11311, filled circles), disome IV (A; A12687, open circles), disome VIII (A; A13628, open triangles), and disome XI (A; A13771, open squares) cells lacking the construct were grown to mid–log phase in selective medium supplemented with 2% raffinose and induced for 1 h with 2% galactose. Small, unbudded cells were isolated by centrifugal elutriation and released at 30°C in YEP medium containing 2% galactose + 2% raffinose. Samples were taken every 15 min to determine cell volume and the percentage of budded cells.
Whi5 nuclear exit is delayed in aneuploid cells
SBF, the transcription factor complex that promotes CLN1/2 expression, is composed of Swi4 and Swi6 and is negatively regulated by the transcriptional inhibitor Whi5. Whi5 binds to Swi4/6 at the promoters of genes required for the G1–S transition, inhibiting transcription (Costanzo et al., 2004; de Bruin et al., 2004). In G1, Cln3-CDKs phosphorylate Whi5, promoting its export from the nucleus (Costanzo et al., 2004; de Bruin et al., 2004). In wild-type cells, Whi5–green fluorescent protein (GFP) exits the nucleus just before budding. In three disomes tested (IV, XI, and XV), Whi5-GFP protein levels were not dramatically altered and Whi5-GFP nuclear exit occurred, as in wild type, just before budding (Figure 8). However, both budding and Whi5-GFP nuclear exit were delayed compared with the euploid control (Figure 8 and Supplemental Table S1). A fourth aneuploid strain, disome XVI, exhibits a growth defect but not a critical size increase (Figure 1K, Supplemental Figure S1K, and Table 1); as expected, Whi5 nuclear exit also occurred just before budding in this strain, and Whi5-GFP levels were not dramatically altered. We conclude that the relationship between Whi5 nuclear exit and budding is not altered in aneuploid cells; however, the entire program of Whi5 nuclear exit, SBF/MBF activation, and budding is delayed in the disomic strains analyzed.
FIGURE 8:
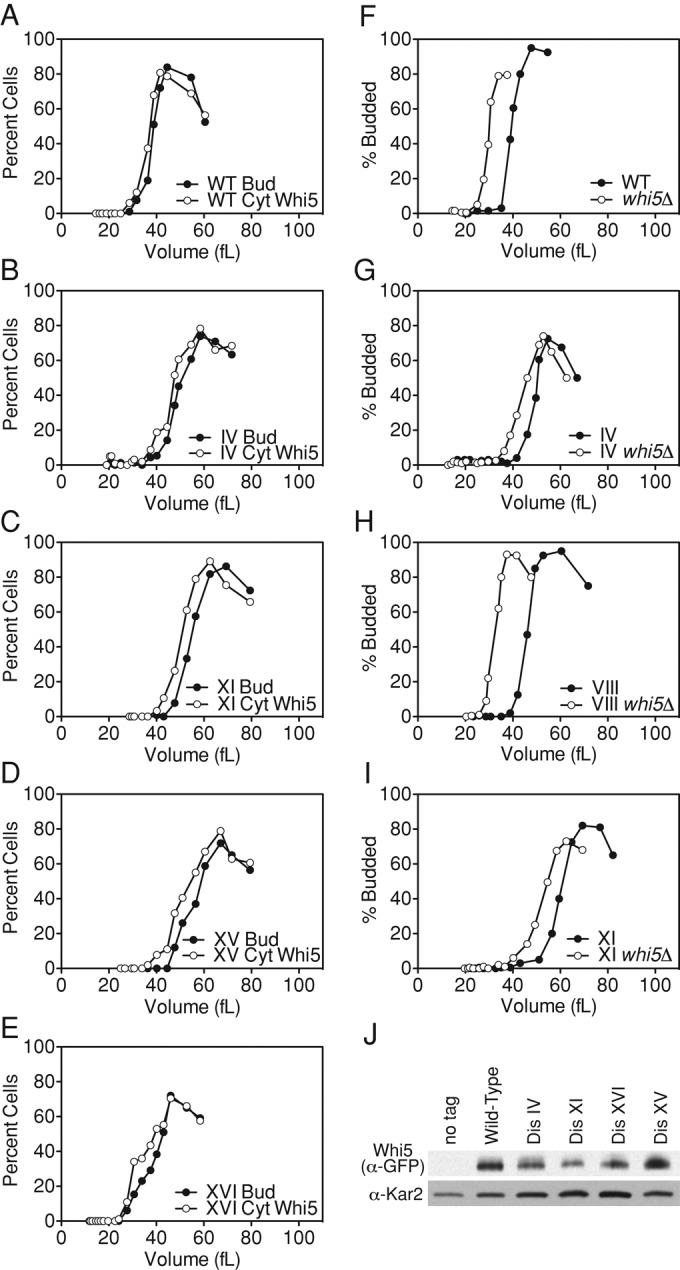
Nuclear exit of Whi5 is delayed in disomes IV, XI, XV, and XVI, but deletion of WHI5 does not suppress the budding delay of disomes IV, VIII, and XI. (A–E) Wild-type (A; A25877), disome IV (B; A25879), disome XI (C; A31515), disome XV (D; A31516), and disome XVI (E; A25880) cells containing Whi5-GFP were grown at 30°C in selective medium supplemented with 2% raffinose. Small, unbudded cells were isolated by centrifugal elutriation and released into the cell cycle at 30°C in YEPD. Time points were taken every 15 min to monitor budding, Whi5-GFP localization, and cell volume. Bud, budding; Cyt, cytoplasmic Whi5. (F–I) Wild-type (F; A25479, open circles), disome IV (G; A25481, open circles), disome VIII (H; A25480, open circles), and disome XI (I; A25482, open circles) with WHI5 deleted and wild-type (F; A11311, filled circles), disome IV (G; A12687, filled circles), disome VIII (H; A13628, filled circles), and disome XI (I; A13771, filled circles) cells with functional WHI5 were grown in selective medium supplemented with 2% raffinose. Small, unbudded cells were isolated by centrifugal elutriation and released at 30°C in YEPD. Time points were taken every 15 min to determine cell volume and the percentage of budded cells. (J) Wild-type (A25877), disome IV (A25879), disome XI (A31515), disome XV (A31516), and disome XVI (A25880) cells were grown at 30°C in YEPD, and Whi5-GFP protein levels were detected by Western blot analysis. Disome XV (A31516) contains one copy of Whi5-GFP and one untagged copy of Whi5, as WHI5 is located on chromosome XV. Wild-type cycling cells (A2587) were used as a no-tag control.
To further investigate the misregulation of START control in disomic cells, we examined the consequences of WHI5 deletion in disomes IV, VIII, and XI. The critical size of wild-type cells is 39 fl, but when WHI5 is deleted the critical size decreases to 30 fl (Figure 8F). Deletion of WHI5 did not suppress the critical size increase in aneuploid cells; it affected wild-type and disomic cells similarly, decreasing the critical size by 6–13 fl (Figure 8, F–I, and Supplemental Table S1). Taken together, our data indicate that the timing of Whi5 nuclear exit is delayed in the disomic strains analyzed, but time of budding is also perturbed through parallel pathways. Perhaps disomy IV, VIII, and XI interfere with the positive feedback loop regulating Whi5 nuclear export, alter SBF/MBF activity, or affect parallel pathways.
Accumulation of Cln3 is delayed in disome VIII and XI cells
Whi5 export from the nucleus is promoted by Cln3-CDKs. To determine whether lower Cln3 protein levels could be responsible for the delayed exit of Whi5 from the nucleus in the disomic yeast strains, we measured Cln3-13Myc levels in elutriated cells. Cln3 protein levels fluctuated significantly during G1 in wild-type cells. Cln3 protein levels were low in small G1 cells, accumulated as cells reached a size of 21 fl, and declined shortly before cells entered the cell cycle (Figure 9A). This fluctuation in protein levels was not due to changes in CLN3 RNA levels (Figure 9A), indicating that posttranscriptional mechanisms are responsible for Cln3 protein fluctuations. The CLN3-13MYC allele is hypermorphic, causing a decrease in critical size from 38 to 31 fl in wild-type cells (Figure 9A). This is most likely because the C-terminal tag stabilizes the protein by interfering with degradation of Cln3, which is mediated by the PEST sequences located in the C-terminus of the protein (Tyers et al., 1992). Thus the fluctuations in untagged Cln3 are likely to be, if anything, more dramatic.
FIGURE 9:
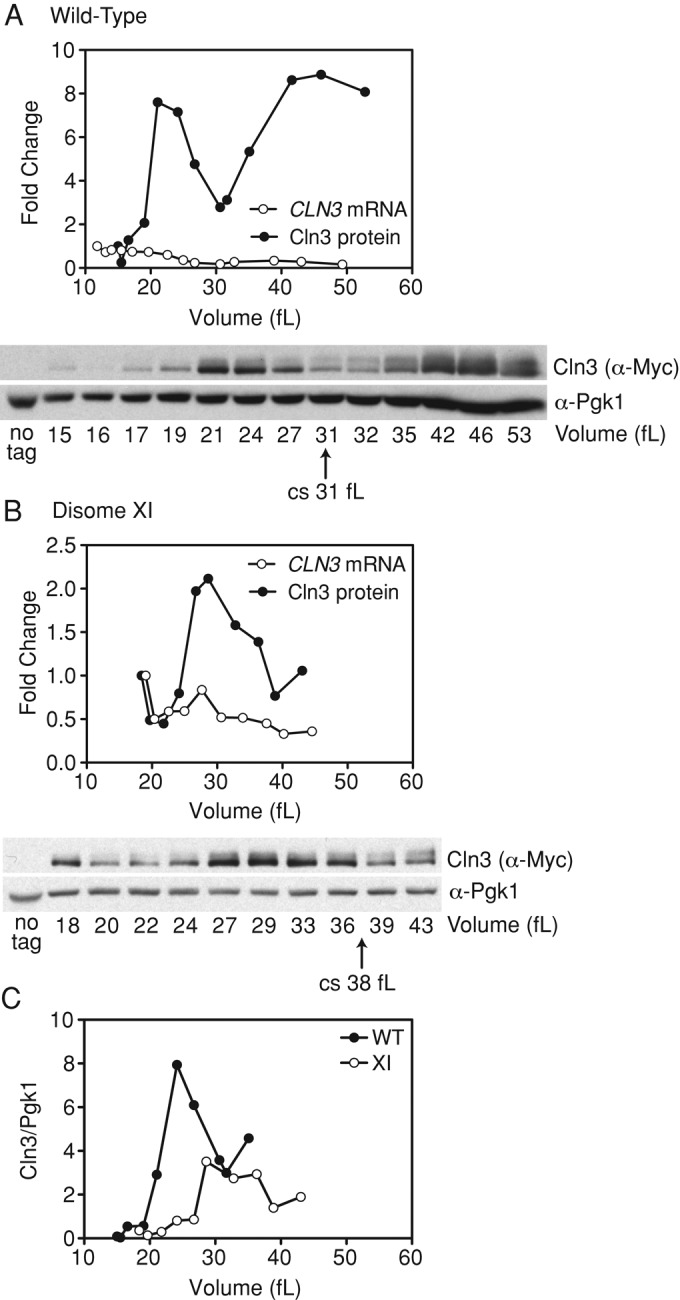
Cln3 accumulation is delayed in disome XI. Wild-type (A,C; A33692) and disome XI (B,C; A33694) cells were grown at 30°C in selective medium supplemented with 2% raffinose. Small, unbudded cells were isolated by centrifugal elutriation and released into the cell cycle at 30°C in YEPD. Time points were taken every 15 min to determine the percentage of budded cells, cell volume, and Cln3 protein levels. In separate experiments, wild type (A) and disome XI (B) were elutriated as described and samples were taken every 15 min to determine the percentage of budded cells, cell volume, and CLN3 RNA levels by reverse transcription-PCR. CLN3 protein and RNA levels are presented as fold changes from the first time point and plotted as a function of cell volume to demonstrate that Cln3 protein but not CLN3 RNA levels fluctuate significantly during G1. Cln3 protein levels were normalized to Pgk1, and CLN3 RNA levels were normalized to ACT1. Wild-type cycling cells (A2587) were used as a no-tag control for the Western blots. The arrow underneath the blot marks the critical size (cs). (C) Wild-type and disome XI Cln3 protein levels from the experiments in A and B were quantified and normalized to Pgk1 levels. The Western blot used for quantification is not shown. This analysis shows that overall Cln3 protein levels are comparable between wild-type and disome XI strains.
Overall Cln3 levels were comparable between wild-type and disomic strains, but Cln3 protein levels peaked at a larger volume in both disome VIII and XI cells as compared with wild-type (Figure 9 and Supplemental Figure S6). This finding indicates that Cln3 translation and/or stability is affected in these disomic strains. The effect of the CLN3-13MYC allele on the critical sizes of the two disomic yeast strains was variable. The basis of this variability is unclear (Figure 9B and Supplemental Figure S6A). We conclude that the delay of START in disome VIII and XI cells is due at least in part to a delay in the accumulation of Cln3 protein.
Aneuploidy impairs cell cycle entry in parallel to BCK2
Cln3-CDK activity is not essential for cell cycle entry, indicating that parallel pathways exist that activate Cln1/2-CDKs (Cross, 1988; Nash et al., 1988). Bck2 is one such factor; cells lacking BCK2 are large and exhibit a delay in CLN1 and CLN2 transcription (Di Como et al., 1995). In addition, deletion of BCK2 causes lethality or severe growth retardation in cells lacking CLN3 (Epstein and Cross, 1994; Di Como et al., 1995). To determine whether aneuploidy interferes with cell cycle entry through BCK2, we examined the critical size of disomic cells lacking BCK2. If aneuploidy inhibits cell cycle entry through mechanisms that function in parallel to BCK2, we expect disomes lacking this gene to exhibit an increased critical size. If aneuploidy delays G1 by disrupting BCK2 function, the effects of combining aneuploidy and a BCK2 deletion should not be additive.
Small, unbudded cells were isolated by centrifugal elutriation, and budding was measured as a function of volume. In wild-type cells, deletion of BCK2 caused an increase in critical size of ∼11% (Figure 10A and Supplemental Table S1). Deletion of BCK2 had a greater effect on the disomic strains than the wild-type strain, causing increases in critical size ranging from 29 to 46% in the disomes tested (Figure 10, B–E, and Supplemental Table S1). A greater increase in critical size in the disomes upon deletion of BCK2 suggests that disomic strains depend more on the BCK2 pathway for cell cycle entry than do wild-type cells. This conclusion is consistent with our data suggesting that the Cln3-CDK/Whi5/SBF pathway is impaired in disomic cells. Taken together, our results indicate that aneuploidy affects entry into the cell cycle in at least two ways: aneuploidy elicits a growth defect and causes a cell cycle entry delay that is due to a delay in Cln3 accumulation.
FIGURE 10:
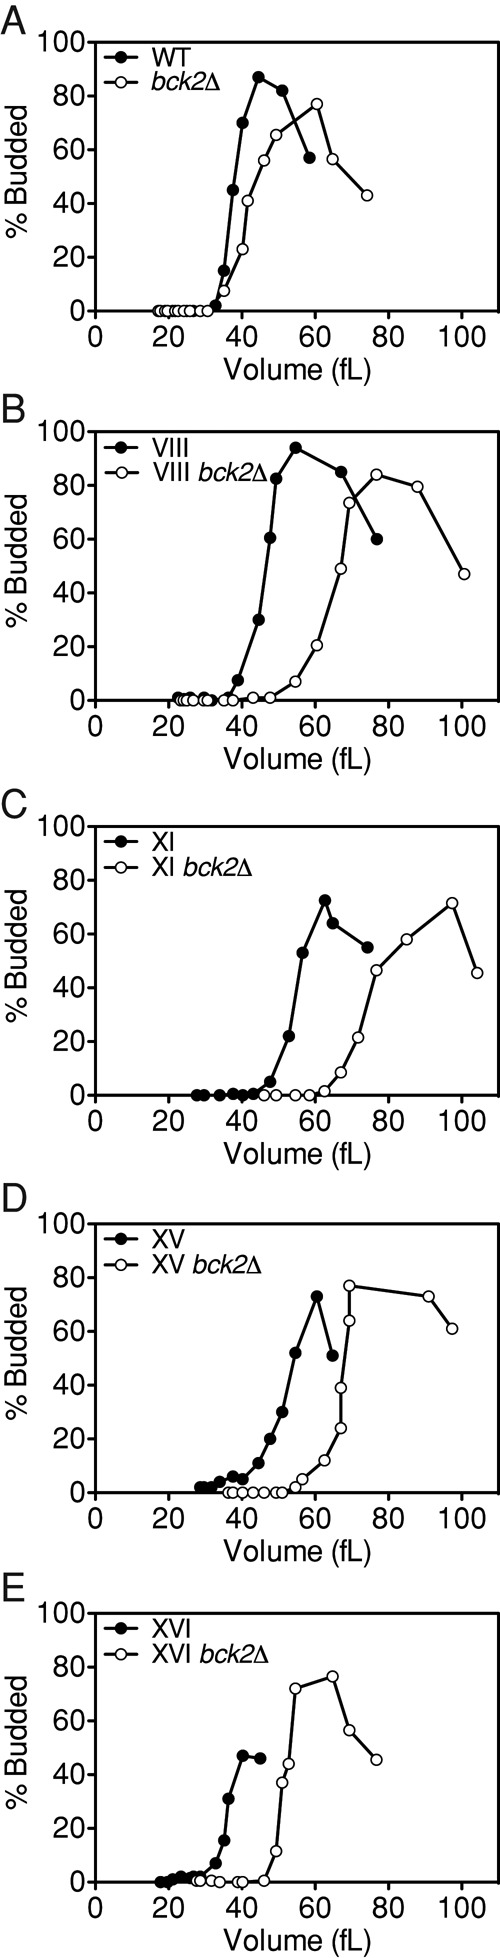
Deletion of BCK2 exacerbates the G1 delay in disomic yeast cells. Wild-type (A; A31519, open circles), disome VIII (B; A26163, open circles), disome XI (C; A26162, open circles), disome XV (D; A31520, open circles), and disome XVI (E; A26161, open circles) lacking BCK2 and wild-type (A; A11311, filled circles), disome VIII (B; A13628, filled circles), disome XI (C; A13771, filled circles), disome XV (D; A12697, filled circles), and disome XVI (E; A12700, filled circles) with functional BCK2 were grown at 30°C in selective medium supplemented with 2% raffinose. Small, unbudded cells were isolated by centrifugal elutriation and released into the cell cycle at 30°C in YEPD. Time points were taken every 15 min to determine cell volume and the percentage of budded cells. Experiments for strains containing BCK2 are the same experiments as in Figure 1 and are shown here for comparison; strains were not run in parallel with the bck2Δ strains.
Many progeny of triploid meioses exhibit a G1 delay
The strategy we used to create the disomic yeast strains is limited in that only low-complexity aneuploidies (gains of one or two chromosomes) can be obtained (Torres et al., 2007). To determine whether yeast strains with more complex aneuploidies also exhibit a G1 delay, we induced triploid strains to undergo meiosis. In such meioses progeny are generated with a range of karyotypes: haploid, diploid, and aneuploidies ranging from 1N + X to 2N − X. Nearly all aneuploid strains created in this manner are highly unstable (Pavelka et al., 2010; St. Charles et al., 2010; Sheltzer et al., 2011), but, we reasoned, could be cultured for brief periods of time to determine whether they also exhibit a G1 delay.
The viability of spores obtained from triploid meioses was very low, as expected (Parry and Cox, 1970; St. Charles et al., 2010). The few colonies that did grow up exhibited a wide range of proliferation rates. On the basis of our previous studies, we assume that progeny obtained from these meioses with wild-type or near wild-type proliferation rates are either euploid or harbor aneuploidies of chromosomes with little effect on cell proliferation, such as chromosome I (Torres et al., 2007), whereas slow-growing progeny harbor aneuploidies of (presumably multiple) chromosomes that cause significant growth impairment.
DNA content analysis revealed that many of the progeny of triploid meioses exhibit a G1 delay (Figure 11). This G1 delay correlated remarkably well with proliferation rates as observed by growth on solid medium (Figure 11). Spores 1-1–1-3 obtained from triploid parent 1 grew very well and exhibited a DNA content profile very similar to that of the parent (Figure 11, B–E). Spores 1-4–1-7 grew poorly and showed an increase in G1 cells (Figure 11, F–I). Similar results were obtained with progeny from triploid parent 2. The percentage of cells in G1 was very low in exponentially growing cultures of this strain, the reason for which is unknown. It was nevertheless evident that in the aneuploid progeny, the G1 delay correlated with growth ability. Spore 2-1 grew well and exhibited a cell cycle distribution close to that of the parent (Figure 11K); cultures of spores that grew poorly (spores 2-2–2-6) showed an increase in G1 cells (Figure 11, L–P). We conclude that many aneuploid yeast strains obtained as offspring of triploid meioses also exhibit a G1 delay.
FIGURE 11:

Progeny of triploid meioses exhibit a G1 delay. MATa/a/α (B; triploid parent 1, A6424) and MATa/α/α (J; triploid parent 2, A6425) cells were induced to sporulate, and tetrads were dissected. Individual colonies were picked after 1 wk and grown to exponential phase in YEPD medium to determine DNA content (C–I; A6424 progeny; K–P; A6425 progeny). FL2-H detection thresholds were adjusted for each strain so that the cell population was within the linear detection range of the instrument. Plus signs indicate proliferation rates on solid medium, with +++ representing proliferation rates close or equal to wild-type controls and fewer plus signs indicating poorer proliferation rates. A haploid strain (A2587) is shown in A.
DISCUSSION
We investigated the basis of the G1 delay observed in many disomic yeast strains to understand how aneuploidy alters the regulatory networks controlling the G1–S phase transition. Two aspects of G1 regulation appear to be affected: cell growth and entry into the cell cycle. Thus the disomic yeast strains are unique in that they grow slowly, and yet, unlike most slow-growing mutants, they must reach a larger critical size to pass through START.
Most of the disomic strains show a growth defect during G1 as measured by cell volume accumulation (Figure 3 and Supplemental Figure S3). This growth defect is not nearly as dramatic as that seen in mutants impaired in ribosome biogenesis or protein synthesis (Supplemental Figure S2; Jorgensen et al., 2002; Hoose et al., 2012), but nevertheless, the defect is readily observed by cell volume measurements. However, it should be noted that we did not detect any defects in global protein synthesis as judged by polysome profiles or [35S]methionine incorporation (Figure 5A; C.G., unpublished observations). These observations raise the possibility that the disomic cells are defective in cell volume accumulation but not protein synthesis, which would imply that these aneuploid cells must be denser than euploid cells. We favor the idea that the defect in cell volume accumulation reflects an overall defect in macromolecule biosynthesis, but the defect is too subtle to be detected by methods such as [35S]methionine incorporation and polysome profiling.
Our investigation of the basis for the cell volume accumulation defect of the disomic yeast strains indicates that it does not stem from diminished amino acid pools (Figure 4) or a constitutively active amino acid starvation response (Supplemental Figure S4) or from shifts in translation efficiency (Figure 5A). Instead, we propose that macromolecule biosynthesis and/or other aspects of cell growth are hampered in aneuploid cells. One explanation for this growth defect is that particular genes present on the additional chromosome(s) in aneuploid cells may be causing slow growth. For instance, additional copies of key regulators of growth processes such as macromolecule biosynthesis, vesicle fusion, protein sorting, and/or energy production could lead to a slowing of growth. In this scenario, the reason for the growth defect is different in each aneuploid strain. It is also possible that slow growth is caused by a feature common to all aneuploidies, such as an increase in the number of gene products due to the extra chromosome(s). Previous studies showed the additional chromosomes to be actively transcribed and translated in the disomic strains (Torres et al., 2007, 2010). Therefore it is possible that an increased burden on the transcription and translation machinery hampers cell growth. This scenario predicts that the growth defect correlates with the amount of additional translation that occurs in the disomes. This is not what we observe, as the growth defect in the disomes does not correlate with the size of the additional chromosome (Supplemental Figure S3K). Therefore we favor the idea that imbalances in individual proteins critical for cell growth hamper cell volume accumulation in the disomic strains.
The delay in cell cycle entry (as judged by a delay in bud formation) observed in the disomes was more pronounced than the growth defect, which led us to investigate this phenotype in more detail. Of the 14 aneuploid strains studied, 10 showed increased critical size. The following observations points toward a common origin of the cell cycle entry defects observed in the disomes:
The cell cycle entry delay correlated with the size of the additional chromosome (Figure 1 and Table 1).
All disomes analyzed, namely disomes IV, XI, and XV, exhibit a delay in CLN2 mRNA accumulation (Figure 6, A, B, and D).
The increase in critical size of all disomes analyzed (disomes IV, VIII, and XI) is suppressed by high levels of CLN2 (Figure 7).
Whi5 exit from the nucleus was delayed in all disomes studied (disomes IV, XI, and XV; Figure 8).
The accumulation of Cln3 is delayed in all disomes analyzed (disomes VIII and XI; Figure 9 and Supplemental Figure S6).
If the detailed characterization of a subset of disomic strains is representative of all disomic strains exhibiting a cell cycle entry defect, our data point toward Cln3 accumulation being affected by aneuploidy.
How does aneuploidy interfere with Cln3 accumulation and/or other aspects of cell cycle entry? Are these G1 processes affected by changes in copy number of specific proteins or features common to all disomies? Consistent with the former idea are the critical size increases observed in disomes VIII, XIV and VIII + XIV. Whereas the single disomes exhibit increases in critical size of 8 fl (disome VIII) and 5 fl (disome XIV), the double disome shows only a 3-fl increase in critical size compared with wild-type cells (compare Figure 1, D, I, and N). This finding suggests that the cell cycle entry delay in the individual disomes is caused by a defined number of imbalanced gene products that can be suppressed by providing a surplus of gene products located on another chromosome. In this model, the correlation between increased critical size and size of the additional chromosome would be explained by genes affecting cell cycle entry being distributed more or less evenly across the yeast genome. Moriya et al. (2006) identified all yeast genes whose increased dosage affects cell proliferation. It will be interesting to determine which of these, when present at two copies, affect cell cycle entry.
Although single gene imbalances could contribute to the delay in cell cycle entry, our data also indicate that a response to a common feature of disomy is responsible for the cell cycle entry delay observed in many disomic strains. The critical size increase in the disomes correlates with the size of the additional chromosome (Figure 1O), and all disomes analyzed appear to show a similar defect in the molecular pathway governing START (see earlier discussion). An increase in the amount of DNA is not responsible for the G1 delay in the disomes, as YACs containing human DNA do not cause an increase in critical size. A previous study suggested that increasing the number of SBF-binding sites delays cell cycle entry because they titrate Cln3 molecules (Wang et al., 2009). We analyzed the distribution of SBF-binding sites in the yeast genome as published in Ferrezuelo et al. (2010) and found them to be evenly distributed across the genome (data not shown). It is thus possible that Cln3 titration by SBF-binding sites contributes to the G1 delay observed in the disomes. Whereas an increase in SBF-binding sites could contribute to the G1 delay in the disomes, our analyses point toward delayed Cln3 protein accumulation as the major defect in at least disomes VIII and XI. We do not know whether CLN3 translation and/or Cln3 stability is affected in the aneuploid strains. Protein synthesis rates affect CLN3 translation (Polymenis and Schmidt, 1997), and so aneuploidy could, via its effects on macromolecule biosynthesis, affect Cln3 synthesis. Aneuploidy could also affect Cln3 stability. Recently the two ubiquitin ligases SCF-Cdc4 and SCF-Grr1 were identified as being responsible for regulating Cln3 stability (Landry et al., 2012). It will be interesting to determine whether aneuploidy affects Cln3 ubiquitination by these ligases.
Many stresses cause a G1 arrest or delay (Herrero et al., 2003). It was suggested that aneuploidy causes proteotoxic and energy stress in yeast and mouse cells (Torres et al., 2007, 2010; Tang et al., 2011). These or other stresses elicited by aneuploidy could elicit a transient G1 delay by interfering with Cln3 accumulation. Indeed, proteotoxic stress induced by heat shock causes a G1 delay (Johnston and Singer, 1980), which, like the G1 delay seen in the disomic yeast strains, can be suppressed by CLN2 overexpression (Rowley et al., 1993). Whether and how aneuploidy and other cellular stresses antagonize Cln3 accumulation are important questions that remain to be addressed.
Is the G1 delay that we observe in many of the disomes also seen in other models of aneuploidy? Our study of the progeny of triploid meioses suggests that many of the poorly growing and thus presumably highly aneuploid yeast strains show a significant G1 delay that is detectable in exponentially growing cells. A study of aneuploid fission yeast cells created by triploid meioses showed that these cells also exhibit a delay in G1 during germination (Niwa et al., 2006), but the cause of the G1 delay is not known. Mouse embryonic fibroblasts trisomic for chromosome 1, 13, 16, or 19 (Williams et al., 2008) and trisomy 21 human fibroblasts (Segal and McCoy, 1974) exhibit cell proliferation defects, but the basis of this proliferation defect has not been explored. Thus whether a conserved effect on cell cycle entry exists in aneuploid cells of different species remains to be established. However, a common transcriptional response reminiscent of the budding yeast environmental stress response (indicative of cellular stress and slowed proliferation) is observed in aneuploid yeast, Arabidopsis, mouse, and human cells (Sheltzer et al., 2012). It is tempting to speculate that aneuploidy, like many other cellular stresses, affects cell proliferation by delaying cells in G1. Determining the molecular mechanisms underlying the effects of aneuploidy on progression through G1 will be an important aspect of understanding how aneuploidy affects cell physiology.
MATERIALS AND METHODS
Yeast strains, plasmids, and growth conditions
All yeast strains are derivatives of W303 and are described in Supplemental Table S2. Yeast strains were generated and manipulated as described previously (Guthrie and Fink, 1991). The GCN4-LacZ construct (Hinnebusch, 1985) was integrated at the URA3 locus. Cells were grown at 30°C in yeast extract/peptone (YEP) or in synthetic medium containing G418 at 0.2 mg/ml, supplemented with 2% raffinose, 2% raffinose plus 2% galactose, or 2% glucose (YEPD).
Elutriation
Cells were grown in 1–2 l of synthetic medium supplemented with 2% raffinose at 30°C. Cells were collected by centrifugation and resuspended in 30 ml of YEP without sugar. Cells were sonicated to break clumps and kept at 4°C for the duration of the elutriation. A Beckman elutriation rotor JE 5.0 (Beckman Coulter, Brea, CA) was chilled to 4°C and equilibrated with YEP (no sugar) at 2400 rpm. Cells were loaded into the rotor at a pump speed of ∼14 ml/min and allowed to equilibrate for 15–20 min at a rotor speed of 2400 rpm and a pump speed of ∼14 ml/min. The pump speed was increased until small, unbudded cells exited the elutriation chamber. One liter was collected at that pump speed (∼20 ml/min for most strains). Pump speed settings varied slightly among experiments, as the disomic strains have different cell volumes. Elutriated cells were concentrated using a filtration apparatus and resuspended in YEPD at 30°C.
Cell volume determination
Cell volume was measured using a Beckman Coulter Multisizer 3 (Beckman Coulter). Approximately 50 μl of culture was diluted into Isoton II solution (Beckman Coulter) to give <10% saturation. Fifty thousand particles were sized for each sample. Particles <2 μm in diameter were excluded to decrease background signal and decrease the chances of counting dead cells. Cell volume distributions were smoothed with a rolling window of three bins. Modal population values were used for the plots. The critical size of a strain is defined as the modal cell volume at half-maximal budding.
Ribosome profiling and mRNA-Seq
Ribosome profiling was performed as described (Ingolia et al., 2009), with subtraction of three prominent rRNA species performed as in Brar et al. (2012). In short, cells were treated with 100 μg/ml cycloheximide to freeze ribosomes, then flash-frozen and subjected to mixer-mill lysis. Clarified extract was treated with RNase I and subjected to sucrose gradient fractionation. The 80S/monosome fraction was harvested and RNA was extracted and size selected for ribosome footprints (28–30 nucleotides [nt]). These footprints were converted into a sequencing library, which was sequenced using an Illumina GAII machine (Illumina, San Diego, CA). Sequences were aligned to the W303 genome and quantified as described (Ingolia et al., 2009). For translation efficiency (TE) analyses, calculations were only done on genes with 128 summed counts among mRNA and footprint samples, with TE = (ribosome footprint RPKM)/(mRNA RPKM), where RPKM is reads per kilobase million, a normalizing unit for gene length and total sequencing counts per lane. mRNA-Seq was also performed as described (Ingolia et al., 2009). In short, flash-frozen cells were lysed in hot acid phenol, and total RNA was extracted. A polyA selection was performed to isolate mRNA, which was fragmented to 40- to 60-nt species, which were converted into a sequencing library, sequenced, and analyzed in parallel with ribosome footprint samples.
Polyribosome profile analysis
Polysomes were prepared as described (Clarkson et al., 2010). Briefly, 250-ml cultures were grown in YEPD at 30°C to an OD600 of 0.5. Cycloheximide was added to a final concentration of 0.1 mg/ml for 3 min. Cells were pelleted by centrifugation and lysed by vortexing with zirconia/silica beads in 1× PLB (20 mM 4-(2-hydroxyethyl)-1-piperazineethanesulfonic acid–KOH, pH 7.4, 2 mM magnesium acetate, 100 mM potassium acetate, 0.1 mg/ml cycloheximide, 3 mM dithiothreitol [DTT]) and treated with RNasin Plus RNase inhibitor (Promega, Fitchburg, WI). Lysates were clarified by centrifugation, and 25 A260 units were resolved on 11-ml linear 10–50% sucrose gradients in 1× PLB by centrifugation in a Beckman SW41 rotor (Beckman Coulter) for 3 h at 35,000 rpm.
Metabolomic analysis
All strains were grown in shake flasks at 30°C and 250 rpm in defined minimal medium containing the following per liter (adapted from Verduyn et al., 1992): 5 g of KH2PO4, 0.5 g of MgSO4•7H2O, 2 g of monosodium glutamate, 1.5 mg of EDTA, 4.5 mg of ZnSO4•7H2O, 0.3 mg of CoCl2, 1 mg of MnCl2•4H2O, 0.3 mg of CuSO4•5H2O, 4.5 mg of CaCl2•2H2O, 3 mg of FeSO4•7H2O, 0.4 mg of NaMoO4•2H2O, 1 mg of H3BO3, and 0.1 mg of KI. Filter-sterilized vitamins were added separately to a final concentration per liter of the following: 0.005 mg of biotin, 0.1 mg of Ca-pantothenate, 0.1 mg of nicotinic acid, 2.5 mg of inositol, 0.1 mg of pyridoxine, 0.02 mg of p-aminobenzoic acid, and 0.1 mg of thiamine. The medium was buffered with 100 mM KH-phthalate at a pH of 5. Owing to the genetic markers in the strains, the medium was supplemented with the following compounds per liter: 0.031 g of lysine, 0.02 g of uracil, 0.24 g of leucine, 0.08 g of adenine, 0.02 g of tryptophan, 0.021 g of methionine, and 0.2 g of geneticin (G418). Cells were grown to an OD600 between 0.7 and 1.5 when metabolism of 1 ml of culture was arrested by quenching in −40°C methanol plus 10 mM ammonium acetate. After centrifugation at −9°C (3 min, 5000 rpm) the samples were stored at −80°C. Intracellular metabolites were extracted by incubation in 75% ethanol plus 10 mM ammonium acetate for 3 min at 80°C. The supernatant was dried using a vacuum centrifuge. The dried extracts were derivatized with N-tert-butyldimethylsilyl-N-methyltrifluoroacetamide for quantification. The metabolites were separated by gas chromatography and injected into a time-of-flight mass spectrometer as described in Ewald et al. (2009).
β-Galactosidase activity assay
Cell extracts and activity measurements were performed as described (Dever, 1997). Cells were grown in synthetic medium lacking histidine and supplemented with 2% glucose. Amino acid starvation was induced by the addition of 3-AT, a competitive inhibitor of an intermediate step in histidine synthesis, to a final concentration of 100 mM.
Northern blot analysis
Cells were grown at 30°C in synthetic medium supplemented with 2% raffinose, elutriated as described, and released into the cell cycle. Time points were taken until after the critical size had been reached. Total RNA was isolated as described (Cross and Tinkelenberg, 1991), and Northern blots were performed as described (Hochwagen et al., 2005). Blots were probed for CLN2 and the loading control ACT1.
Real-time reverse transcription-PCR
Approximately 2–4 OD600 units of culture were pelleted by centrifugation at 4°C (3000 rpm, 2 min). The pellet was resuspended in 1 ml of cold diethylpyrocarbonate (DEPC)-treated water, transferred to a 2-ml microfuge tube, and repelleted by centrifugation at 4°C (3000 rpm, 2 min). The pellet was flash-frozen in liquid nitrogen and stored at −80°C. To extract total RNA, ∼200 μl of glass beads, 400 μl of TES buffer (10 mM Tris, pH 7.5, 10 mM EDTA, 0.5% SDS), and 400 μl of acid phenol:chloroform (pH 4.5) were added to the cell pellet, and the tubes were vortexed for 45 min at 65°C. The phases were separated by centrifugation, and the top phase was transferred to a new tube containing 1 ml of 120 mM sodium acetate in ethanol to precipitate RNA at 4°C. Precipitates were collected by centrifugation and resuspended in 100 μl of DEPC-treated water. Total RNA was further purified using the RNeasy Mini Kit (Qiagen, Hilden, Germany), including DNase treatment, according to the manufacturer's instructions. cDNA was synthesized from 750 ng of total RNA using the SuperScript III First-Strand Synthesis SuperMix Kit (Invitrogen, Grand Island, NY) with random hexamer primers according to the manufacturer's instructions. Real-time quantitative PCRs were run using the SYBR Premix Ex Taq Perfect Real Time Kit (TaKaRa Bio, Otsu, Japan) and a Roche LightCycler 480 (Roche, Penzberg, Germany) according to manufacturer's instructions. Quantitative PCR primers are listed in Supplemental Table S3.
Western blot analysis
Approximately 2–4 OD600 units of culture were pelleted by centrifugation at 4°C (3000 rpm, 2 min). Cells were incubated at 4°C in 5% trichloroacetic acid for at least 10 min. Cell pellets were washed once with acetone and dried. Cells were lysed with glass beads in 100 μl of lysis buffer (50 mM Tris-Cl at pH 7.5, 1 mM EDTA, 2.75 mM DTT, complete protease inhibitor cocktail [Roche, Mannheim, Germany]) with a bead mill, and samples were boiled in 1× SDS loading buffer. After SDS–PAGE and transfer of proteins to a nitrocellulose membrane, proteins were detected with the following antibodies. Whi5-GFP was detected using a mouse anti-GFP antibody (JL-8 epitope; Clontech, Mountain View, CA) at a dilution of 1:1000. Cln3-13Myc was detected using a mouse anti-Myc antibody (9e10 epitope; Covance, Princeton, NJ) at a dilution of 1:600. Pgk1 was detected using a mouse anti-Pgk1 antibody (Invitrogen, Carlsbad, CA) at a 1:10,000 dilution. Kar2 was detected using a rabbit anti-Kar2 antibody (kindly provided by M.D. Rose, Princeton University, Princeton, NJ) at a dilution of 1:400,000. Quantification was performed using ImageQuant software.
Fluorescence microscopy
For Whi5-GFP imaging, cells were fixed in 4% paraformaldehyde/3.4% sucrose for 15 min and then resuspended in 0.1 M potassium phosphate (KPi, pH 6.4)/1.2 M sorbitol/1% Triton. Cells were then resuspended in 0.05 μg/ml 4′,6-diamidino-2-phenylindole in KPi/sorbitol and imaged using a Zeiss Axioplan 2 microscope (Carl Zeiss, Göttingen, Germany) and a Hamamatsu OCRA-ER digital camera (Hamamatsu, Hamamatsu, Japan).
Flow cytometric analysis
Analysis of DNA content by flow cytometry was performed as previously described (Hochwagen et al., 2005).
Supplementary Material
Acknowledgments
We thank Alan Hinnebusch for the GCN4-LacZ construct. We thank Frank Solomon and members of the Amon lab for comments on the manuscript. This work was supported by National Institutes of Health Grant GM056800 to A.A.. G.A.B. was supported by American Cancer Society Postdoctoral Fellowship 117945-PF-09-136-01-RMC, and N.T.I. was supported by National Institutes of Health P01 Award AG10770 and Ruth L. Kirschstein National Research Service Award GM080853. A.A. and J.S.W. are investigators of the Howard Hughes Medical Institute.
Abbreviation used:
- CDK
cyclin-dependent kinase
Footnotes
This article was published online ahead of print in MBoC in Press (http://www.molbiolcell.org/cgi/doi/10.1091/mbc.E12-07-0520) on March 6, 2013.
*These authors contributed equally to this work.
Present addresses: †Columbia Initiative in Systems Biology and Department of Biochemistry and Molecular Biophysics, Columbia University Medical Center, New York, NY 10032.
‡Department of Biology, Massachusetts Institute of Technology, Cambridge, MA 02139.
§Department of Embryology, Carnegie Institution for Science, Baltimore, MD 21218.
REFERENCES
- Bloom J, Cross FR. Multiple levels of cyclin specificity in cell-cycle control. Nat Rev Mol Cell Biol. 2007;8:149–160. doi: 10.1038/nrm2105. [DOI] [PubMed] [Google Scholar]
- Brar GA, Yassour M, Friedman N, Regev A, Ingolia NT, Weissman JS. High-resolution view of the yeast meiotic program revealed by ribosome profiling. Science. 2012;335:552–557. doi: 10.1126/science.1215110. [DOI] [PMC free article] [PubMed] [Google Scholar]
- Clarkson BK, Gilbert WV, Doudna JA. Functional overlap between eIF4G isoforms in Saccharomyces cerevisiae. PLoS One. 2010;5:e9114. doi: 10.1371/journal.pone.0009114. [DOI] [PMC free article] [PubMed] [Google Scholar]
- Costanzo M, Nishikawa JL, Tang X, Millman JS, Schub O, Breitkreuz K, Dewar D, Rupes I, Andrews B, Tyers M. CDK activity antagonizes Whi5, an inhibitor of G1/S transcription in yeast. Cell. 2004;117:899–913. doi: 10.1016/j.cell.2004.05.024. [DOI] [PubMed] [Google Scholar]
- Cross FR. DAF1, a mutant gene affecting size control, pheromone arrest, and cell cycle kinetics of Saccharomyces cerevisiae. Mol Cell Biol. 1988;8:4675–4684. doi: 10.1128/mcb.8.11.4675. [DOI] [PMC free article] [PubMed] [Google Scholar]
- Cross FR, Hoek M, McKinney JD, Tinkelenberg AH. Role of Swi4 in cell cycle regulation of CLN2 expression. Mol Cell Biol. 1994;14:4779–4787. doi: 10.1128/mcb.14.7.4779. [DOI] [PMC free article] [PubMed] [Google Scholar]
- Cross FR, Tinkelenberg AH. A potential positive feedback loop controlling CLN1 and CLN2 gene expression at the start of the yeast cell cycle. Cell. 1991;65:875–883. doi: 10.1016/0092-8674(91)90394-e. [DOI] [PubMed] [Google Scholar]
- de Bruin RA, McDonald WH, Kalashnikova TI, Yates J, 3rd, Wittenberg C. Cln3 activates G1-specific transcription via phosphorylation of the SBF bound repressor Whi5. Cell. 2004;117:887–898. doi: 10.1016/j.cell.2004.05.025. [DOI] [PubMed] [Google Scholar]
- Dever TE. Using GCN4 as a reporter of eIF2 alpha phosphorylation and translational regulation in yeast. Methods. 1997;11:403–417. doi: 10.1006/meth.1996.0437. [DOI] [PubMed] [Google Scholar]
- Di Como CJ, Chang H, Arndt KT. Activation of CLN1 and CLN2 G1 cyclin gene expression by BCK2. Mol Cell Biol. 1995;15:1835–1846. doi: 10.1128/mcb.15.4.1835. [DOI] [PMC free article] [PubMed] [Google Scholar]
- Dirick L, Bohm T, Nasmyth K. Roles and regulation of Cln-Cdc28 kinases at the start of the cell cycle of Saccharomyces cerevisiae. EMBO J. 1995;14:4803–4813. doi: 10.1002/j.1460-2075.1995.tb00162.x. [DOI] [PMC free article] [PubMed] [Google Scholar]
- Epstein CB, Cross FR. Genes that can bypass the CLN requirement for Saccharomyces cerevisiae cell cycle START. Mol Cell Biol. 1994;14:2041–2047. doi: 10.1128/mcb.14.3.2041. [DOI] [PMC free article] [PubMed] [Google Scholar]
- Ewald JC, Heux S, Zamboni N. High-throughput quantitative metabolomics: workflow for cultivation, quenching, and analysis of yeast in a multiwell format. Anal Chem. 2009;81:3623–3629. doi: 10.1021/ac900002u. [DOI] [PubMed] [Google Scholar]
- Ferrezuelo F, Colomina N, Futcher B, Aldea M. The transcriptional network activated by Cln3 cyclin at the G1-to-S transition of the yeast cell cycle. Genome Biol. 2010;11:R67. doi: 10.1186/gb-2010-11-6-r67. [DOI] [PMC free article] [PubMed] [Google Scholar]
- Ferrezuelo F, Colomina N, Palmisano A, Gari E, Gallego C, Csikasz-Nagy A, Aldea M. The critical size is set at a single-cell level by growth rate to attain homeostasis and adaptation. Nat Commun. 2012;3:1012. doi: 10.1038/ncomms2015. [DOI] [PubMed] [Google Scholar]
- Fingerman I, Nagaraj V, Norris D, Vershon AK. Sfp1 plays a key role in yeast ribosome biogenesis. Eukaryot Cell. 2003;2:1061–1068. doi: 10.1128/EC.2.5.1061-1068.2003. [DOI] [PMC free article] [PubMed] [Google Scholar]
- Futcher B. Cyclins and the wiring of the yeast cell cycle. Yeast. 1996;12:1635–1646. doi: 10.1002/(SICI)1097-0061(199612)12:16%3C1635::AID-YEA83%3E3.0.CO;2-O. [DOI] [PubMed] [Google Scholar]
- Futcher B. Transcriptional regulatory networks and the yeast cell cycle. Curr Opin Cell Biol. 2002;14:676–683. doi: 10.1016/s0955-0674(02)00391-5. [DOI] [PubMed] [Google Scholar]
- Guthrie C, Fink G. Guide to yeast genetics and molecular biology. Methods Enzymol. 1991;194:1–863. [PubMed] [Google Scholar]
- Herrero E, Angeles de la Torre M, Torres J, Belli G. Regulation of G1 phase of yeast cells by stress. In: Boonstra J, editor. G1 Phase Progression. New York: Kluwer Academic/Plenum; 2003. pp. 165–186. [Google Scholar]
- Hinnebusch AG. A hierarchy of trans-acting factors modulates translation of an activator of amino acid biosynthetic genes in Saccharomyces cerevisiae. Mol Cell Biol. 1985;5:2349–2360. doi: 10.1128/mcb.5.9.2349. [DOI] [PMC free article] [PubMed] [Google Scholar]
- Hinnebusch AG. Translational regulation of GCN4 and the general amino acid control of yeast. Annu Rev Microbiol. 2005;59:407–450. doi: 10.1146/annurev.micro.59.031805.133833. [DOI] [PubMed] [Google Scholar]
- Hochwagen A, Wrobel G, Cartron M, Demougin P, Niederhauser-Wiederkehr C, Boselli MG, Primig M, Amon A. Novel response to microtubule perturbation in meiosis. Mol Cell Biol. 2005;25:4767–4781. doi: 10.1128/MCB.25.11.4767-4781.2005. [DOI] [PMC free article] [PubMed] [Google Scholar]
- Hoose SA, et al. A systematic analysis of cell cycle regulators in yeast reveals that most factors act independently of cell size to control initiation of division. PLoS Genet. 2012;8:e1002590. doi: 10.1371/journal.pgen.1002590. [DOI] [PMC free article] [PubMed] [Google Scholar]
- Ingolia NT, Ghaemmaghami S, Newman JR, Weissman JS. Genome-wide analysis in vivo of translation with nucleotide resolution using ribosome profiling. Science. 2009;324:218–223. doi: 10.1126/science.1168978. [DOI] [PMC free article] [PubMed] [Google Scholar]
- Johnston GC, Singer RA. Ribosomal precursor RNA metabolism and cell division in the yeast Saccharomyces cerevisiae. Mol Gen Genet. 1980;178:357–360. doi: 10.1007/BF00270484. [DOI] [PubMed] [Google Scholar]
- Jorgensen P, Nishikawa JL, Breitkreutz BJ, Tyers M. Systematic identification of pathways that couple cell growth and division in yeast. Science. 2002;297:395–400. doi: 10.1126/science.1070850. [DOI] [PubMed] [Google Scholar]
- Jorgensen P, Tyers M. How cells coordinate growth and division. Curr Biol. 2004;14:R1014–R1027. doi: 10.1016/j.cub.2004.11.027. [DOI] [PubMed] [Google Scholar]
- Landry BD, Doyle JP, Toczyski DP, Benanti JA. F-box protein specificity for G1 cyclins is dictated by subcellular localization. PLoS Genet. 2012;8:e1002851. doi: 10.1371/journal.pgen.1002851. [DOI] [PMC free article] [PubMed] [Google Scholar]
- Mai B, Breeden L. Xbp1, a stress-induced transcriptional repressor of the Saccharomyces cerevisiae Swi4/Mbp1 family. Mol Cell Biol. 1997;17:6491–6501. doi: 10.1128/mcb.17.11.6491. [DOI] [PMC free article] [PubMed] [Google Scholar]
- Mai B, Breeden L. CLN1 and its repression by Xbp1 are important for efficient sporulation in budding yeast. Mol Cell Biol. 2000;20:478–487. doi: 10.1128/mcb.20.2.478-487.2000. [DOI] [PMC free article] [PubMed] [Google Scholar]
- Moriya H, Shimizu-Yoshida Y, Kitano H. In vivo robustness analysis of cell division cycle genes in Saccharomyces cerevisiae. PLoS Genet. 2006;2:e111. doi: 10.1371/journal.pgen.0020111. [DOI] [PMC free article] [PubMed] [Google Scholar]
- Nash R, Tokiwa G, Anand S, Erickson K, Futcher AB. The WHI1+ gene of Saccharomyces cerevisiae tethers cell division to cell size and is a cyclin homolog. EMBO J. 1988;7:4335–4346. doi: 10.1002/j.1460-2075.1988.tb03332.x. [DOI] [PMC free article] [PubMed] [Google Scholar]
- Niwa O, Tange Y, Kurabayashi A. Growth arrest and chromosome instability in aneuploid yeast. Yeast. 2006;23:937–950. doi: 10.1002/yea.1411. [DOI] [PubMed] [Google Scholar]
- Parry EM, Cox BS. The tolerance of aneuploidy in yeast. Genet Res. 1970;16:333–340. doi: 10.1017/s0016672300002597. [DOI] [PubMed] [Google Scholar]
- Pavelka N, Rancati G, Zhu J, Bradford WD, Saraf A, Florens L, Sanderson BW, Hattem GL, Li R. Aneuploidy confers quantitative proteome changes and phenotypic variation in budding yeast. Nature. 2010;468:321–325. doi: 10.1038/nature09529. [DOI] [PMC free article] [PubMed] [Google Scholar]
- Polymenis M, Schmidt EV. Coupling of cell division to cell growth by translational control of the G1 cyclin CLN3 in yeast. Genes Dev. 1997;11:2522–2531. doi: 10.1101/gad.11.19.2522. [DOI] [PMC free article] [PubMed] [Google Scholar]
- Rowley A, Johnston GC, Butler B, Werner-Washburne M, Singer RA. Heat shock-mediated cell cycle blockage and G1 cyclin expression in the yeast Saccharomyces cerevisiae. Mol Cell Biol. 1993;13:1034–1041. doi: 10.1128/mcb.13.2.1034. [DOI] [PMC free article] [PubMed] [Google Scholar]
- Rupes I. Checking cell size in yeast. Trends Genet. 2002;18:479–485. doi: 10.1016/s0168-9525(02)02745-2. [DOI] [PubMed] [Google Scholar]
- Segal DJ, McCoy EE. Studies on Down's syndrome in tissue culture. I. Growth rates and protein contents of fibroblast cultures. J Cell Physiol. 1974;83:85–90. doi: 10.1002/jcp.1040830112. [DOI] [PubMed] [Google Scholar]
- Sheltzer JM, Blank HM, Pfau SJ, Tange Y, George BM, Humpton TJ, Brito IL, Hiraoka Y, Niwa O, Amon A. Aneuploidy drives genomic instability in yeast. Science. 2011;333:1026–1030. doi: 10.1126/science.1206412. [DOI] [PMC free article] [PubMed] [Google Scholar]
- Sheltzer JM, Torres EM, Dunham MJ, Amon A. Transcriptional consequences of aneuploidy. Proc Natl Acad Sci USA. 2012;109:12644–12649. doi: 10.1073/pnas.1209227109. [DOI] [PMC free article] [PubMed] [Google Scholar]
- Skotheim JM, Di Talia S, Siggia ED, Cross FR. Positive feedback of G1 cyclins ensures coherent cell cycle entry. Nature. 2008;454:291–296. doi: 10.1038/nature07118. [DOI] [PMC free article] [PubMed] [Google Scholar]
- St Charles J, Hamilton ML, Petes TD. Meiotic chromosome segregation in triploid strains of Saccharomyces cerevisiae. Genetics. 2010;186:537–550. doi: 10.1534/genetics.110.121533. [DOI] [PMC free article] [PubMed] [Google Scholar]
- Stuart D, Wittenberg C. Cell cycle-dependent transcription of CLN2 is conferred by multiple distinct cis-acting regulatory elements. Mol Cell Biol. 1994;14:4788–4801. doi: 10.1128/mcb.14.7.4788. [DOI] [PMC free article] [PubMed] [Google Scholar]
- Tang YC, Williams BR, Siegel JJ, Amon A. Identification of aneuploidy-selective antiproliferation compounds. Cell. 2011;144:499–512. doi: 10.1016/j.cell.2011.01.017. [DOI] [PMC free article] [PubMed] [Google Scholar]
- Torres EM, Dephoure N, Panneerselvam A, Tucker CM, Whittaker CA, Gygi SP, Dunham MJ, Amon A. Identification of aneuploidy-tolerating mutations. Cell. 2010;143:71–83. doi: 10.1016/j.cell.2010.08.038. [DOI] [PMC free article] [PubMed] [Google Scholar]
- Torres EM, Sokolsky T, Tucker CM, Chan LY, Boselli M, Dunham MJ, Amon A. Effects of aneuploidy on cellular physiology and cell division in haploid yeast. Science. 2007;317:916–924. doi: 10.1126/science.1142210. [DOI] [PubMed] [Google Scholar]
- Turner JJ, Ewald JC, Skotheim JM. Cell size control in yeast. Curr Biol. 2012;22:R350–R359. doi: 10.1016/j.cub.2012.02.041. [DOI] [PMC free article] [PubMed] [Google Scholar]
- Tyers M, Tokiwa G, Futcher B. Comparison of the Saccharomyces cerevisiae G1 cyclins: Cln3 may be an upstream activator of Cln1, Cln2 and other cyclins. EMBO J. 1993;12:1955–1968. doi: 10.1002/j.1460-2075.1993.tb05845.x. [DOI] [PMC free article] [PubMed] [Google Scholar]
- Tyers M, Tokiwa G, Nash R, Futcher B. The Cln3-Cdc28 kinase complex of S. cerevisiae is regulated by proteolysis and phosphorylation. EMBO J. 1992;11:1773–1784. doi: 10.1002/j.1460-2075.1992.tb05229.x. [DOI] [PMC free article] [PubMed] [Google Scholar]
- Verduyn C, Postma E, Scheffers WA, Van Dijken JP. Effect of benzoic acid on metabolic fluxes in yeasts: a continuous-culture study on the regulation of respiration and alcoholic fermentation. Yeast. 1992;8:501–517. doi: 10.1002/yea.320080703. [DOI] [PubMed] [Google Scholar]
- Wang H, Carey LB, Cai Y, Wijnen H, Futcher B. Recruitment of Cln3 cyclin to promoters controls cell cycle entry via histone deacetylase and other targets. PLoS Biol. 2009;7:e1000189. doi: 10.1371/journal.pbio.1000189. [DOI] [PMC free article] [PubMed] [Google Scholar]
- Williams BR, Prabhu VR, Hunter KE, Glazier CM, Whittaker CA, Housman DE, Amon A. Aneuploidy affects proliferation and spontaneous immortalization in mammalian cells. Science. 2008;322:703–709. doi: 10.1126/science.1160058. [DOI] [PMC free article] [PubMed] [Google Scholar]
Associated Data
This section collects any data citations, data availability statements, or supplementary materials included in this article.