

Abstract
The characterization of the lateral organization of components in biological membranes and the evolution of this arrangement in response to external triggers remains a major challenge. The concept of lipid rafts is widely invoked, however, direct evidence of the existence of these ephemeral entities remains elusive. We report here the use of Secondary Ion Mass Spectrometry (SIMS) to image the cholesterol-dependent cohesive phase separation of the ganglioside GM1 into nano and micro-scale assemblies in a canonical lipid raft composition of lipids. This assembly of domains was interrogated in a model membrane system composed of palmitoyl sphingomyelin (PSM), cholesterol, and an unsaturated lipid (dioleoylphosphatidylcholine, DOPC). Orthogonal isotopic labeling of every lipid bilayer component and monofluorination of GM1 allowed generation of molecule specific images using a NanoSIMS. Simultaneous detection of six different ion species in SIMS, including secondary electrons, was used to generate ion ratio images whose signal intensity values could be correlated to composition through the use of calibration curves from standard samples. Images of this system provide the first direct, molecule specific, visual evidence for the co-localization of cholesterol and GM1 in supported lipid bilayers and further indicate the presence of three compositionally distinct phases: (1) the interdomain region; (2) micrometer-scale domains (d>3 μm); and, (3) nanometer-scale domains (d=100 nm − 1 μm) localized within the micrometer-scale domains and the interdomain region. PSM-rich, nanometer-scale domains prefer to partition within the more ordered, cholesterol-rich/DOPC-poor/GM1-rich micrometer-scale phase, while GM1-rich, nanometer-scale domains prefer to partition within the surrounding, disordered, cholesterol-poor/PSM-rich/DOPC-rich interdomain phase.
INTRODUCTION
It is generally believed that certain membrane lipids and membrane-anchored proteins tend to associate in the plasma membrane and that this clustering is important for function; however, it has proven difficult to characterize this association, both because of the small size of the assemblies and their transient nature. In particular, the concept of lipid rafts1 posits that 10 – 100 nm assemblies enriched in sphingolipids, glycosphingolipids, such as the ganglioside GM1, cholesterol, and glycophosphatidylinositol (GPI)-anchored proteins2 are important for membrane function. One limitation of many experimental approaches to this problem is the inherent perturbation on the lateral organization by labels that serve to provide feedback in the form of luminescence or paramagnetic signals. Introduction of labels can change the behavior of endogenous lipids leading to ambiguity, and can be a major source of ir-reconcilable data among different laboratories using different probes. An extensive literature has evolved on the phase behavior of multicomponent lipid mixtures,3 and while this may not be directly relevant to cellular membranes, it provides a benchmark for understanding complex biological systems. However, even these studies typically involve partitioning of dyes or other labels among different phases and do not directly measure the composition of the phases. For this reason, imaging mass spectrometry, directly measuring the mass of components or isotopically labeled fragments from the components, offers an attractive alternate approach.
Optical methods have been extensively used to obtain information on lipid rafts, including indirect imaging approaches, such as single particle and fluorophore tracking,4–6 Förster resonance energy transfer (FRET),7,8 homo-FRET,9 fluorescence correlation and cross-correlation spectroscopy,10 and super-resolution techniques.11–20 These techniques use fluorescently labeled membrane components making direct comparisons between the labeled analogs and the native molecules difficult, especially in the case of the lipid components. For instance, many of the best fluorescent dyes are as large as the lipids they label, and often have charges or large hydrophobic regions that may interact with the membrane. Nonetheless, experimental observations point to the existence of nanometer scale assemblies in the plasma membrane. In particular, a stimulated emission depletion (STED) microscopy study revealed that a cholesterol-dependent phase hindered the diffusion of Atto647N-labeled sphingomyelin, ganglioside GM1, and a GPI-anchored protein within <20 nm diameter areas in the plasma membrane.17 Spin label measurements have also proven useful8,21 as have more direct imaging techniques, such as amplitude22 and frequency23–27 modulation atomic force microscopy (AFM) and electron microscopy.28
Imaging mass spectrometry offers an alternate approach. The most important advantages are that these methods are free of added labels, and direct information is obtained on the composition of membrane components that can be made quantitative in some cases. We note that such measurements are made in high vacuum, thus a great deal of effort is required to faithfully capture and preserve the sample and only snap-shots of dynamic processes can be obtained. Time-of-flight secondary ion mass spectrometry (ToF-SIMS)29–32 and matrix-assisted laser desorption/ionization (MALDI) and MALDI-ToF33,34 have been used to image the lateral organization and composition of biological tissue sections32,34 as well as model and cell membranes.29,30,33 ToF-SIMS has the advantage of high information content as large molecular fragments are detected and very high spatial resolution is possible; however, ionization efficiencies for different components vary substantially making quantification difficult, and the sensitivity of the current instruments is modest. We have advocated the use of multiple-isotope mass spectrometry35 (MIMS) using a NanoSIMS (Cameca Instruments) as an imaging tool for interrogating membrane composition.36–39 This technique requires isotopic labeling or atom exchange (e.g. with F) of membrane components but can generate molecule-specific images with high spatial resolution, high sensitivity, and high mass resolving power, and calibration samples can be used to obtain quantitative estimates of the composition of each component. The NanoSIMS uses a continuous primary ion beam of either cesium (for generating negative secondary ions) or oxygen (for generating positive secondary ions). A spatial resolution of 50 nm or better is achieved by a co-axial optical configuration where primary and secondary ion beams are co-localized per-pendicularly to the sample. Image acquisition is achieved by rastering the primary ion beam across a region of interest as illustrated in Figure 1. Secondary negative ions, including atomic ions such as 12C− and/or 13C−, 19F− (added as a label), 31P− and 32S−; or molecular ions such as CN− (12C14N−, 12C15N−, 13C14N−, and 13C15N−), CH− (12C1H−, 13C1H−, 12C2H−, and 13C2H−) and others are ejected from the sample and focused through a lens forming a secondary ion beam that is accelerated into a magnetic sector and channeled into a set of detectors (seven on the NanoSIMS 50L) according to their mass-to-charge ratio. Consequently, a set of secondary ion intensities is collected from exactly the same volume of material to obtain molecule-specific images. In contrast to most methods, the location and composition of all components can be visualized, including the correlated co-localization of components.
Figure 1. Schematic of the NanoSIMS experiments.

A cesium ion beam is rastered across a surface generating secondary ions (12C−, 13C−, 12C2H−, 19F−, 12C14N−, and 12C15N−) from the components of a supported lipid bilayer shown as a phase separated mixture of 13C-Cholesterol, 2H31-Palmitoyl Sphingomyelin (2H-PSM), 18-F-GM1, and 15N-DOPC (see Scheme 1).
In this study, secondary ion mass spectrometry was used to image the cholesterol-dependent cohesive phase separation of the ganglioside GM1 into nanometer and micrometer scale assemblies within the widely used phase separated model membrane system composed of palmitoyl sphingomyelin (PSM), cholesterol, and an unsaturated lipid. These measurements are possible because GM1, with a single F-atom at position 18 of the stearic acid chain (Scheme 1), provides a sensitive probe of its location without affecting biological functionality. As illustrated in Figure 1, the lipid bilayer whose lateral composition we wish to profile is supported on an SiO2/Si substrate. The case illustrated here is a canonical lipid raft mixture consisting of cholesterol (labeled with 13C and directly detected as 13C−, see Scheme 1), PSM (with one of the two palmitic acid chains fully labeled with 2H and detected as 12C2H−), ganglioside GM1 (mono-fluorinated = 18-F-GM1, by replacing an H atom on the terminal methyl group of the stearic acid chain with an F atom40 and detected as 19F−), and dioleoylphosphatidylcholine (DOPC, 15N-labeled38 and detected as 12C15N−; see experimental for labeling details). Ratio ion images were obtained by normalizing the 13C− and 12C2H− ion signals with the 12C− ion signal and the 19F− and 12C15N− ion signals with the 12C14N− ion signal to minimize systematic signal intensity variations that arose during the measurements. The imaging results are consistent with the formation of sub-micron domains in which cholesterol, PSM and GM1 are enriched.
Scheme 1.

Structural representatives of labeled molecules to facilitate NanoSIMS analysis of supported lipid bilayers.
MATERIALS AND METHODS
Biosynthesis of 13C-labeled cholesterol
Highly 13C enriched cholesterol is not available commercially, so an efficient system was developed to produce it for these experiments. A major effort is required to produce isotopically labeled cell membrane components in order to unambiguously identify the molecules in a lipid bilayer sample imaged by a NanoSIMS. Isotopically labeled phospholipids (i.e. 13C-DSPC and 15N-DLPC) can be synthesized by adapting conventional methods.38 However, cholesterol is much more difficult to obtain, and a substantial effort was devoted to the preparation of 13C-labeled cholesterol. Since only mammalian cells produce cholesterol naturally, although a Saccharomyces cervisiae strain has been engineered to produced cholesterol,41 human cells known to synthesize high levels of cholesterol were used. Hep G2 cells, derived from a human hepatoblastoma, are adherent cells known to synthesize triglycerides and cholesterol with many similarities to normal liver. Cholesterol biosynthesis in the presence of 13C-labeled cholesterol precursors (i.e. acetate, acetoacetate, mevalonate, or octanoate) produces a discrete spectrum of cholesterol isotopomers whose enrichment is dictated by growth conditions.42 Once synthesized, total lipid extraction, separation and purification steps are performed to isolate the 13C-cholesterol isotopomers (see Supporting Information for details). Cholesterol isolated from Hep G2 cells grown in acetate with both methyl and carboxyl carbons substituted with 13C (99%) had an isotopomer distribution ranging from zero to 27 13C atoms per cholesterol with a concomitant 13C/12C ratio of ~3.07 corresponding to an average of 20 13C atoms per cholesterol (Scheme 1 and Figure S1 in Supporting Information).43
Synthesis of 15N-DOPC
15N-DOPC was synthesized by furnishing DOPG with 15N-choline as previously described (Scheme 1).39 (See Supporting Information for details).
Synthesis of monofluorinated GM1
Monofluorinated GM1 (18-F-GM1, Scheme 1) was synthesized by coupling lyso-GM1 with the corresponding fluorinated stearic acid. Lyso-GM1 was obtained by alkaline hydrolysis of native GM144 and then treated with the N-hydroxysuccinimide (NHS) ester of the monofluorinated stearic acid to afford fluorinated GM1.40 The effect of fluorination of GM1 on its biological functions in cell membranes as well as its phase behavior properties in model membranes was interrogated by calcium signaling assays, FACS analysis, and AFM imaging of supported lipid bilayers (SLBs). (See details and Figures S2–4 in Supporting Information)
Sample Preparation for NanoSIMS
Materials
Silicon wafers (4” <100> p-type) were from Silicon Quest International. Platinum wires (d=1mm) and Texas Red 1,2-dihexadecanoyl-sn-glycero-3-phosphoethanolamine (TR-DHPE) were from Sigma-Aldrich. 2H31-Palmitoyl Sphingomyelin (2H-PSM) was from Avanti Polar Lipids Inc.
Substrates
Sample preparation is mainly dictated by the requirements of NanoSIMS analysis. Supported lipid bilayers were formed on patterned substrates.38,39 The patterning grid provides a map of the surface since the sample needs to be characterized with multiple methods requiring the same regions be found on separate instruments (typically imaging ellipsometry, fluorescence and atomic force microscopies). Chrome-patterned oxidized silicon supports were prepared with standard methods at the Stanford Nanofabrication Laboratory. Briefly, silicon wafers are thoroughly cleaned to remove trace organics and metals and the natural oxide layer is etched away. A Tylan oxidation furnace is used to thermally grow a thin silicon oxide (silica) film (~10 nm) on the silicon wafer surface. The choice of silicon oxide thickness is an optimal balance between stable lipid bilayer formation and maximal surface charge dissipation for NanoSIMS.36 A grid (25, 50, or 100 μm) pattern composed of chrome (5 nm in height, 5 μm in width) is imprinted using standard photolithography techniques. The wafers are then diced into 5mm × 5mm chips that fit into the NanoSIMS sample holder.
Preparation of Supported Lipid Bilayers
Supported lipid bilayers were formed by fusion of giant unilamellar vesicles (GUVs) onto SiO2/Si substrates. GUVs were used rather than SUVs because their formation consumes substantially less isotopically labeled lipids than SUVs produced by extrusion. Furthermore, deposition and annealing of GUVs to oxidized silicon substrates is less complex than that of SUVs allowing a much wider range of compositions to be tested. As a result, supported lipid bilayer islands, typically tens of square micrometers in average area, are deposited rather than a continuous supported lipid bilayer. As described below, this has the consequence that the supported bilayers have edges and the composition near the edge of a lipid bilayer can be atypical and is generally ignored. Briefly, lipid bilayer mixtures were prepared by mixing lipids and cholesterol dissolved in chloroform at a 2:2:1 2H-PSM:15N-DOPC:13C-Cholesterol ratio with 5 mol% 18-F-GM1 followed by the complete evaporation of chloroform using a gentle stream of N2 while vortexing and allowed to incubate for 1 h in a vacuum desiccator. The lipid mixture was redissolved in CHCl3 at a total lipid concentration of 5 mM. GUVs were made via electroswelling45 by spreading 10 μL of the lipid mixture using a Hamilton syringe to make an even coating over two platinum electrodes of a custom-made electroformation chamber followed by evaporation of CHCl3 with a gentle stream of N2 and 2 h incubation in a vacuum desiccator. The chamber was then sealed using vacuum grease with two siliconized glass slides, filled with 200 mM degassed sucrose in water (MilliQ H2O, resistivity ~18 MΩ-cm) and placed on a heating plate at 85 °C. The electrodes were then connected to a function generator producing a sine wave (amplitude of 3V, frequency of 10 Hz) for 2 h. The GUV solution was then transferred into an eppendorf tube and placed in a water bath at 85 °C for 40 min. The GUV solution was then mixed with an equal volume of pre-heated 0.73× PBS (85 °C) and 125 μL of this mixture was added over each SiO2/Si substrate and incubated for 1 h to allow the formation of lipid bilayer islands by GUV fusion into the substrate. The samples were then rinsed 3 × 1 mL degassed H2O (MilliQ, resistivity ~ 18 MΩ-cm) to remove excess GUVs. The lipid bilayer islands were thermally treated/annealed to allow the formation of separate phases that are closer to equilibrium by placing the samples in a oven at 70 oC for 30 min and cooled slowly to room temperature at a cooling rate of 5 oC/h for a total of ~9 h.
Because NanoSIMS analysis takes place in ultra high vacuum, lipid bilayer samples must be dehydrated. To preserve the lateral organization of lipid bilayers formed in an aqueous environment, techniques from freeze-fracture and cryo-EM were applied. Briefly, supported lipid bilayer samples on the NanoSIMS supports were carefully removed from their aqueous environment with tweezers, flicked once to remove excess surface water and flash-frozen by plunging quickly into liquid ethane at liquid nitrogen temperature (−196 °C). Samples were then transferred to a chamber bathed in liquid N2 and then subjected to reduced pressures (40–50 μbar) generated by an oil-free scroll pump equipped with a liquid N2 trap for at least 12 h to remove any vitreous ice. The final product was a dehydrated lipid bilayer shown to have identical features from its original hydrated state.38
To ensure the level of quality required for NanoSIMS analysis, samples were first visualized by fluorescence microscopy (See Figure S5 in Supporting Information) to establish the overall quality of the freeze-drying process and locate the membrane patches for NanoSIMS imaging. Fluorescence is not used here to establish the phase behavior of the lipid bilayer. A low concentration of a fluorescently labeled lipid (i.e. 0.05 mol% TR-DHPE) added to the lipid mixture allows for the visualization of supported lipid bilayers by a Nikon Eclipse 80i epifluorescence microscope equipped with an An-dor Clara camera.
Secondary Ion Mass Spectrometry
SIMS imaging was performed using the NanoSIMS 50L instrument at Stanford University. The measurements were made in `Images' analysis selection mode using a ~2 pA 133Cs+ primary ion beam (with an approximate 8% conversion based on the detection 28Si− secondary ions from a Si wafer) focused to a ~100 nm diameter spot and rastered over sample areas that were 20 μm × 20 μm to 50 μm × 50 μm. The images consisted of 10 replicate scans (i.e. it requires at most ten frames to burrow through the entire lipid bilayer based on the depletion of molecule-specific secondary ions, including 13C−, 12C2H−, 19F−, and 12C15N−) of 512 × 512 pixels with a dwell time of 1 ms/pixel. Secondary ion intensities for 12C−, 13C−, 12C2H−, 19F−, 12C14N−, and 12C15N− were collected simultaneously in Multicollection mode. Mass resolving powers of ~8900 and ~5600 were used to separate isobaric interferences: 12C2H− from 13C1H− and 12C1H2− at mass 14 and 12C15N− from 13C14N− at mass 27, respectively (See Figure S6 in Supporting Information). Samples were also simultaneously imaged using secondary electrons.
Image analysis
Data analysis was performed using the open source software Open MIMS, which is an Image J (v. 1.44o, National Institutes of Health, USA) plugin. The NanoSIMS secondary ion intensities for 13C− and 12C2H− were normalized to 12C− while 19F− and12C15N− were normalized to 12C14N− to minimize systematic signal intensity variations that arose during the measurements. For qualitative (i.e. visualization) purposes only, each ratio image was smoothed (binned) by replacing the pixel value with the average of its 3 × 3 neighboring pixels for noise reduction while the original image was used for all quantitative analyses.
Standard Samples for Calibration of Lipid & Cholesterol Content
For each isotopically labeled lipid bilayer component, a set of standard samples that systematically varied in isotopic enrichment was employed for calibration. The concentration of the isotopically labeled component (i.e. 0, 20, 40, 60, 80, 100 mol%) was varied through the addition of the corresponding unlabeled component (i.e. cholesterol added to 13C-cholesterol, PSM added to 2H-PSM, GM1 added to 18-F-GM1, and DOPC added to 15N-DOPC) while keeping the total lipid/cholesterol content the same. For each component, the desired mixtures were dissolved in chloroform and spread over SiO2/Si substrates. Ion intensity ratios (i.e. 13C−/12C−, 12C2H− /12C−, 19F−/12C14N−, and 12C 15N−/12C 14N−) were calculated for each mixture by counting, in `Isotopes' analysis selection mode, all 12C−, 13C−, 12C 2H−, 19F−, 12C 14N−, and 12C 15N− secondary ions generated using a ~ 2pA 133Cs+ primary ion beam scanned 12 times over a 20 μm × 20 μm area (256 × 256 pixels) with a beam dwell time of 1 ms/pixel. At least three separate ion intensity ratios per standard sample were obtained and plotted against the molar percent composition of the labeled component, and the best-fit line with regression bands were determined (See Figure S7 and Table S1–S2 in Supporting Information).
Quantitative Analysis of Lipid Content
A two-step calculation was used to estimate the percent molar concentration of each component within regions of interest. First, the calibration curves described above were used to correlate the ratio of intensity values (13C−/12C−, 12C2H−/12C−, 19F−/12C14N−, and 12C15N−/12C14N−) collected from a specific region of the bilayers to the percent molar composition of the labeled component. Second, the composition within a region of interest was normalized such that the total lipid content was 100 mol%. The uncertainty in the percent molar composition was estimated from the uncertainty in the ratio (from Poisson counting statistics) and the uncertainty in the best fit-line of the calibration curve (from regression bands, see Figures S8–S12 and Table S3–S5 in Supporting Information).
RESULTS
NanoSIMS imaging of micro- and nanoscale lipid bilayer phases
Figure 2 shows a 40 × 40 μm2 NanoSIMS image of a freeze-dried lipid bilayer formed by the deposition and annealing of a GUV composed of 2:2:1 2H-PSM:15N-DOPC:13C-Cholesterol with 5 mol% 18-F-GM1 onto an SiO2/Si substrate, highlighting each of the four components based on the isotope or fluorine label, along with a secondary electron image. The secondary electron image immediately shows contrast between the lipid bilayer and the underlying oxidized silicon substrate. Furthermore, it shows contrast within the lipid bilayer indicating the presence of distinct phases with different electron densities. The molecule-specific images provide direct evidence for the co-localization of cholesterol and GM1 into micrometer-scale phases and PSM and DOPC into the interdomain region surrounding the GM1/cholesterol-rich, micrometer-scale phases. Furthermore, the PSM image indicates formation of nanometer-scale phases within the GM1/cholesterol-rich micrometer-scale phases. The composition of both the micrometer-scale phases and the interdomain region appear to contradict the general consensus that these phases are expected to be PSM/cholesterol-rich and DOPC-rich, respectively. However, the formation of nanometer-scale phases within the GM1/cholesterol-rich micrometer-scale phases further supports the lipid raft hypothesis both in composition (i.e. GM1/PSM/choleterol-rich compared to the surrounding phase) and length-scale. The sharp and fractal phase boundaries observed in the PSM image suggests a gel-liquid interface. However, the cholesterol image shows smooth and rounded phase boundaries that extend further into the interdomain region suggesting a liquid-liquid interface. The GM1 image shows formation of nanometer scale phases within the interdomain region while both the cholesterol and GM1 images suggest the accumulation of these components into nanometer scale phases at the lipid bilayer edge.
Figure 2.

NanoSIMS images of a freeze-dried supported lipid bilayer formed by the fusion of a giant unilamellar vesicle composed of 2:2:1 2H-Sphingomyelin:15N-DOPC:13C-Cholesterol with 5 mol% 18-F-GM1 to an SiO2/Si substrate highlighting each component by isotopic or fluorine label along with a secondary electron image. Grayscale bar in secondary electron image represents secondary electron counts. Color bars in molecule-specific images represent percent molar composition from quantitative analysis.
In order to perform compositional analysis of the phase separated lipid bilayer shown in Figure 2, phase boundaries were first defined using an ion intensity threshold value. Since the PSM image provided the best contrast between all the observed phases, the 12C2H− ion image was used to classify three major compositionally distinct phases (Figure 3A): (1) the interdomain region (light gray); (2) the micrometer scale domains (d > 3 μm, gray), and (3) the nanometer scale domains (d ≈ 100 nm – 1 μm, black) localized within the micrometer scale domains. Nanometer-scale domains were also observed in the interdomain region (Figure 3B, black) and at the edge of the lipid bilayers (Figure 3B, gray) and were resolved using the 19F− ion, GM1-specific image. Quantitative compositional analysis of these regions of interest was possible through the use of calibration curves from standard samples.
Figure 3.

Maps of regions of interest within the lipid bilayer from Figure 2 highlighting (A) three compositionally distinct phases corresponding to: (1) Interdomain region (light gray); (2) micrometer-scale Domains 1, 2, and 3 (gray); and, (3) nanometer-scale domains (black) localized within the micrometer-scale domains (referred to as “Included” Domains); and (B) nanometer-scale domains localized within the interdomain region (black) and the edge (gray) of the lipid the bilayer (referred to as “Excluded” and “Peripheral” Domains, respectively).
The overall composition (± uncertainty) of the lipid bilayer in Figure 3 (i.e. light gray, gray, and black regions in Figure 3A) was determined by SIMS to be 21.7 ± 3.6 mol% cholesterol, 56.2 ± 4.6 mol% PSM, 4.2 ± 1.7 mol% GM1 and 17.9 ± 2.1 mol% DOPC (labeled All in Figure 4). The final composition determined from quantitative SIMS analysis was significantly different for PSM and DOPC and relatively similar for cholesterol and GM1 compared to the initial composition of the lipid mixture used to prepare the GUV (i.e. 19 mol% cholesterol, 38 mol% PSM, 5 mol% GM1, and 38 mol% DOPC). Analysis of an additional 10 GUV lipid bilayers (see Table S6 and Figures S13–S16 in supporting information) suggests that the average composition (± one SD) of this GUV population is 23.5 ± 4.1 mol% Cholesterol, 45.4 ± 12.4 mol% PSM, 13.8 ± 10.9 mol% GM1, and 17.3 ± 2.9 mol% DOPC (see Table S6 in Supporting Information), indicating significant GUV-to-GUV compositional variation. This further suggests that the lipid bilayers appear, on average, to be predominantly depleted in DOPC and would suggest a preferential adsorption of GUVs with a lowered DOPC content. However, preliminary work on simpler lipid mixtures suggests that cholesterol, and not DOPC, content is a major factor affecting the adsorption of GUVs while a small amount of PSM (>5mol%) can help improve the adsorption efficiency.46 Based on ternary phase diagrams (without GM1), the compositional variation from GUV-to-GUV is such that two GUV populations, one in a two-phase regime and the other in a three-phase regime, would be expected. The discrepancy between the initial composition of the lipid mixture used to prepare the GUVs and the measured composition of the supported lipid bilayers by quantitative SIMS analysis might be the result of lipid demixing prior to GUV electroformation47 (presumably as a result of GUV electroformation from a dry versus damp lipid film). Baykal-Caglar et al.47 showed that the average cholesterol content in a multicomponent GUV population prepared using the method reported here had a standard deviation of 4 mol% in close agreement with our studies (4.1 mol%). The estimated compositional variation in their studies was based on imaging a GUV population by fluorescence microscopy and recording the temperature at which the phase behavior of each GUV changed from a phase separated state to a single-phase state and calculating the average temperature ± one SD. Furthermore, the calibration curves are based on chemically homogeneous mixtures, i.e. labeled molecule mixed with its unlabeled counterpart, and there may be effects from other chemically-distinct components in a heterogeneous mixture. As a result, our quantitative compositional analysis is only an estimate of the actual composition. Furthermore, in a control GUV lipid bilayer sample also prepared with a 2:2:1 2H-Sphingomyelin:15N-DOPC:13C-Cholesterol but without 18-F-GM1 revealed a final composition by quantitative SIMS analysis of 29.6 ± 3.8 mol% cholesterol, 57.5 ± 3.5 mol% PSM, 0.8 ± 1.9 mol% GM1 and 12.1 ± 2.2 mol% DOPC. The final composition determined by SIMS analysis of the control sample is in close agreement with that of the sample with GM1, except for the very low GM1 content measurement falling just below the detection limit for 18-F-GM1 (see Table S2 in Supporting Information).
Figure 4.
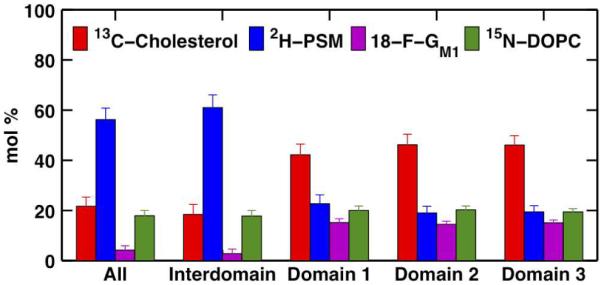
Quantitative compositional analysis of the entire lipid bilayer (All); the interdomain region (Interdomain, light gray region in Figure 3A); and, the three micrometer-scale domains (Domains 1, 2, and 3 in order of increasing size, gray regions in Figure 3A).
The cholesterol-rich, micrometer-scale domains (labeled Domains 1, 2, and 3 in order of increasing size in Figure 4 and colored gray in Figure 3) were surrounded by a cholesterol-poor, interdomain region (labeled Interdomain in Figure 4 and colored light gray in Figure 3) with an averaged difference of 26 mol% between the two phases. Interestingly, these cholesterol-rich micrometer-scale domains correspond to PSM-poor regions while the surrounding interdomain corresponds to a PSM-rich region with an averaged difference of 40 mol% between the two phases. Furthermore, these micrometer-scale domains were also found to have an average of 12 mol% more GM1 than the interdomain region. Consequently, the micrometer-scale domains constitute a cholesterolrich/PSM-poor/GM1-rich phase whereas the interdomain region constitutes the opposite, i.e. a cholesterol-poor/PSM-rich/GM1-poor phase. Even though DOPC does not appear to be homo-geneously distributed throughout the lipid bilayer, the very low molar percent difference between the micrometer-scale domains and the interdomain region (~2 mol%) suggests that both phases have surprisingly similar DOPC content with the exception of few regional compositional inhomogeneities localized especially at the boundary of the micrometer-scale domains where DOPC appears to have been depleted.
As seen in Figure 2, a complex phase separation process occurred in which the micrometer-scale domains, the interdomain region, and the edge of the lipid bilayer displayed phase-separated, nanometer scale (d < 1 μm) assemblies referred to as “included” (d = 379 ± 229 nm), “excluded” (d = 271 ± 136 nm), and “peripheral” (d = 435 ± 203 nm) domains, respectively (histograms Figure 5A, B and C, respectively). Similar behavior was recently reported in a frequency modulated (FM)-AFM study showing that the diameter of domains in a DOPC/Cholesterol/PSM-containing supported lipid bilayer is typically in the 500 nm to 3000 nm range.26 The appearance of nanometer scale assemblies inside and outside the micrometer scale, Lo domains is also consistent with an AFM-imaging study48 on the appearance of nanometer-scale domains within micrometer-scale domains and the interdomain region at the higher GM1 molar percent content also used here.
Figure 5.
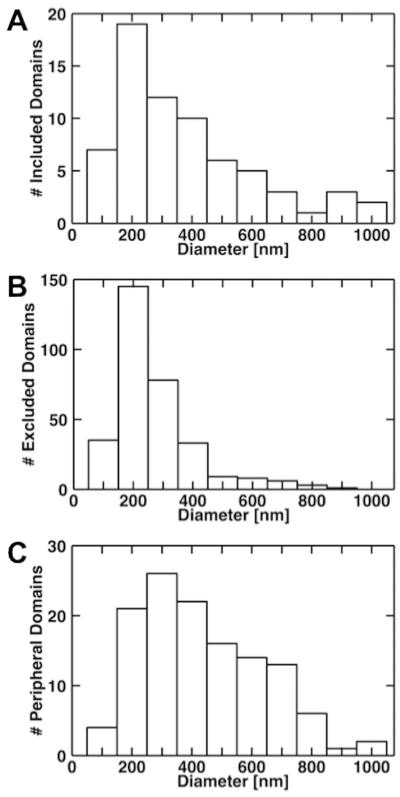
Size distributions of the nanometer-scale domains localized within the micrometer-scale domains, the interdomain region, and the edge of the lipid bilayer referred to as included (A), excluded (B), and peripheral domains (C), respectively.
The excluded (Figure 3B, black) and peripheral (Figure 3B, gray) domains resolved here were identified using the 19F−ion, GM1-specific image. A total of 68, 318, and 125 nanometer-scale domains were resolved within the micrometer-scale domains, the interdomain region, and the edge of the lipid bilayer, respectively. The nanometer-scale domains localized at the periphery of the lipid bilayer were often highly inter-connected making it difficult to resolve individual domains using a single criterion. As a result, the agglomeration of nanometer scale phases into larger assemblies accounts for the larger sizes observed in the size distribution histogram. Quantitative compositional analysis (Figure 6) suggests that: (1) the included nanodomains have similar cholesterol, more PSM, and less GM1 and DOPC content than the micrometer-scale domains; (2) the excluded nanodomains have similar cholesterol and DOPC content, less PSM, and more GM1 than the interdomain region; and (3) the peripheral domains have more cholesterol and GM1, less PSM and DOPC than the interdomain region. Because peripheral domain formation is not only dictated by phase separation processes (which include the effect of the support) but also by lipid bilayer edge effects they are omitted from further discussion on phase separation processes. Consequently, the included nanodomains are referred to as PSM-rich in relation to the micrometer scale domains whereas the excluded nanodomains are referred to as GM1-rich in relation to the interdomain region.
Figure 6.

Quantitative compositional analysis of the nanometer-scale domains localized within the micrometer-scale domains, the interdomain region, and the edge of the lipid bilayer referred to as included, excluded, and peripheral domains, respectively.
Co-localization of membrane components
Figure 7 shows the co-localization image for pairs of membrane components in the lipid bilayer depicted in Figure 2. Co-localization images are generated by calculating the square root of the product between the normalized, molecule-specific images given by
where S1,2, x, xmax, and xmin represent score value between membrane components 1 and 2, pixel value, maximum pixel value, and minimum pixel value, respectively. Normalization of the molecule-specific images allowed comparison between all binary images using a single score scale. Score values above 0.3 indicate high co-localization, while score values below 0.3 indicate low co-localization.
Figure 7.

Co-localization of lipid bilayer components. The color bar represents co-localization score values. Score values less than 0.3 indicate low co-localization and more than 0.3 indicate high co-localization (see text).
Figure 7 indicates high co-localization of cholesterol and sphingomyelin at the boundary of micrometer-scale phases (Domains 1, 2, and 3) extending approximately 1.5 μm into the interdomain region (referred to as “domain boundary region”). Cholesterol and sphingomyelin also co-localize within the nanometer scale phases localized within these micrometer-scale domains (Included Domains) and the nanometer scale phases at the periphery of the lipid bilayer (Peripheral Domains). Furthermore, Figure 7 indicates high co-localization of cholesterol and ganglioside GM1 within domains 1, 2, and 3 and the domain boundary region; and, the nanometer-scale phases at the periphery of the lipid bilayer (Peripheral Domains). It also indicates high co-localization of cholesterol and DOPC at the domain boundary region. Figure 7 also indicates high co-localization of sphingomyelin and ganglioside GM1 within the interdomain region, the included, excluded and peripheral domains. It also indicates high co-localization of sphingomyelin and DOPC within the interdomain region and the nanometer scale phases within the interdomain region (i.e. Excluded domains). Lastly, Figure 7 indicates high co-localization between ganglioside GM1 and DOPC within the excluded domains.
DISCUSSION
Monofluorinated 18-F-GM1 mimics native GM1 in live cell and model membranes
Fluorine substitution is a useful strategy for providing contrast in NanoSIMS imaging since it is easily resolved from isobaric interferences (i.e. 18O1H− at mass 19), the high electron affinity of fluorine leads to particularly high sensitivity, and it affords minimal background. However, it is important to confirm that fluorine substitution does not affect the biological and physical properties of the labeled molecule.
Fluorine substitution for hydrogen atoms has been widely used to modify biologically active molecules in bioorganic and medicinal chemistry.49–58 Monofluorination on the hydrocarbon chain of lipids has been proven to exhibit minimal effect on its biophysical properties.59 We designed and synthesized single fluorine labeled gangliosides for the detection of assemblies in which such molecules participate. Fluorine and hydrogen are isoteric, therefore we expect that substitution with a single fluorine atom at position 18 should not significantly alter the physical properties of the molecule.60 Nonetheless, we evaluated the biological behavior of 18-F-GM1 compared to native GM1. The ability of 18-F-GM1 to trigger Ca2+ influx was interrogated in Jurkat cells and found to be similar to that induced by native GM1 (see Figure S2 in Supporting Information). Furthermore, the incorporation of 18-F-GM1 into mammalian cell surfaces and recognition by cholera toxin B subunit (CTB) was confirmed by flow cytometry (See Figure S3 in Supporting Information). The incorporation levels of 18-F-GM1 into CHO-K1 cells were found to be similar to native GM1. In addition, the biophysical properties and phase behavior of 18-F-GM1 were analyzed by AFM in phase separated SLBs and shown to mirror native GM1 (See Figure S4 in Supporting Information).
On the other hand, there have been studies on multilamellar vesicles composed of monofluorinated DPPC (F-DPPC, with a single F-atom at position 16 of the palmitic acid chain) mixed with native DPPC that have shown the appearance of an interdigitated monolayer phase, presumably as the result of strong interactions between the headgroup of a lipid and the highly polar fluorine atom at the methyl terminus of the sn-2 chain of another lipid, to be concentration dependent. This effect becomes more apparent at concentrations higher than 30 mol% F-DPPC61 and addition of cholesterol has been shown to inhibit formation of this interdigitated monolayer phase.61 Based on these studies, we do not expect the formation of an interdigitated phase in our system since only 5 mol% of a mono-fluorinated GM1 and as much as 19 mol% cholesterol were incorporated into the GUVs. In addition, AFM imaging results (see Figure S4 in Supporting Information) showed no evidence of an interdigitated monolayer phase as determined from membrane thickness measurements showing height values that span an entire lipid bilyer as opposed to half a lipid bilayer characteristic of an interdigitated monolayer phase.63 Taken together, there is no evidence of an interdigitated monolayer phase in our system. Therefore, we conclude that substitution of a single hydrogen atom with fluorine at position 18 on the stearic acid chain of GM1 does not significantly disturb the physical behavior of the molecule within lipid membranes when incorporated at low molar percentages.
Furthermore, our SIMS imaging results indicate that GM1 assembly into micrometer scale phases is strongly cholesterol dependent. On the other hand, GM1 assembly into nanometer scale phases is likely dictated by interactions between the oligosaccharide headgroups. The latter assessment is based on Langmuir monolayer studies that showed the condensing effect of the oligosaccharide headgroup in GM1-containing monolayers and further showed, in contrast, that 18:0 ceramide (essentially GM1 without its headgroup) or 18:0 ceramide EO16 (with the polyethylene chain modeling the bulky oligosaccharide headgroup in GM1)-containing monolayers do not induce condensation.64
In sum, the AFM, FACS, and Ca2+ signaling assay data show that a terminally monofluorinated GM1, 18-F-GM1, has similar biophysical and biological properties as native GM1 and serves as a non-perturbing proxy for the native ganglioside GM1 that is ideally suited for NanoSIMS experiments. Interestingly, when a GM1 analogue with fluorine substitution in the middle of the stearic acid chain at position 12 was used to form SLBs, separation between gel and Ld phases was different (See Figure S17 in Supporting Information). This is presumably the result of a change in tilt angle leading 12-F-GM1 to behave differently in model membranes.59
GM1 and cholesterol co-localize within liquid ordered micrometer-scale phases
The molecule-specific images obtained from NanoSIMS analysis of a phase separated lipid bilayer presented in Figures 2 and 3 illustrate the presence of complex phases at the micro- and nanometer scales. The micrometer scale phase behavior of our system was first characterized, prior to SIMS imaging, by fluorescence microscopy using a small amount of a fluorescent lipid (0.05 mol% TR-DHPE) that preferentially partitions into disordered phases. Fluorescence microscopy images (see Figure S5 in Supporting Information) revealed the formation of micrometer scale, Lo domains with low fluorescence intensity (FI) values surrounded by an Ld, interdomain region with high FI values. Often a differential partitioning of the fluorophore in the region spanning a few micrometers from the edge into the lipid bilayer was also observed with medium FI values; this was attributed to edge effects, an inevitable consequence of the sample preparation, and these edges were avoided in discussions of phase separation processes. The observation of micrometer scale phase coexistence reported here is consistent with phase diagrams developed from fluorescence microscopy imaging of a canonical lipid raft mixture at room temperature that places a 2:2:1 PSM:DOPC:Cholesterol-containing GUV in a two-phase regime corresponding to Lo domains, presumably sphingomyelin and cholesterol-rich, surrounded by an Ld interdomain region, presumably phosphatidycholine-rich and cholesterol poor.65–67 Furthermore, AFM imaging on the incorporation of the ganglioside GM1 into the canonical lipid raft mixture at low molar percentages (<5 mol%) suggested the preferential partitioning of GM1 into these Lo domains that are presumably sphingomyelin and cholesterol-rich.48 The SIMS images presented here provide, for the first time, direct evidence for the co-localization of GM1 and cholesterol, and show that GM1 partitions instead into Lo, cholesterol-rich/PSM-poor domains surrounded by an Ld, PSM-rich interdomain region.
Formation of nanometer scale phases – comparisons with other data
GM1 has been used as a raft marker in many studies, where it is visualized by using a derivative that has a fluorophore on one of the fatty acid chains,68 by binding a fluorescently labeled CTB subunit,69,70 or by AFM, exploiting the subtle height difference associated with the oligosaccharide headgroup.48,71 Each method introduces a different set of issues, and, unfortunately, precisely the same set of lipid mixtures and conditions are rarely used, making comparisons difficult. Furthermore, the direct, quantitative analysis of complex phases is not possible without molecule-specific information of the sort provided by imaging mass spectrometry. In the following discussion we draw on this and other literature to the extent possible to help interpret our data.
The appearance of three distinct phases within the lipid bilayer shown in Figure 3 is consistent with previous studies on fluorescence intensity, anisotropy, and lifetimes of trans-Parinaric acid (tPA)-containing giant multilamellar vesicles (GPMVs) at room temperature that places this same mixture (i.e. 2:2:1 PSM:DOPC:Cholesterol) in a three-phase regime corresponding to Ld, Lo, and gel phases.72 However, the SIMS studies provide unique quantitative compositional analysis of these phases that could only be inferred indirectly in earlier measurements. Yuan et al. (2002) imaged the distribution of GM1 (at 1 and 5 mol%) in a 1:1:1 DOPC/sphingomyelin/cholesterol-containing lipid monolayer on mica using AFM47 and showed the formation of small (40–100 nm) GM1-rich domains localized within the more ordered, micrometer scale, presumably PSM/cholesterol-rich domain phase at the lower GM1 content and also within the surrounding, less-ordered, DOPC-rich interdomain phase at the higher GM1 content. Their observations48 of height differences between nanometer-scale phases and the surrounding region using AFM is qualitatively consistent with our observations of compositional variations using NanoSIMS data. At the higher GM1 content, both methods revealed three main regions corresponding to: (1) a more ordered, micrometer-scale domain phase, (2) a surrounding, less ordered, interdomain phase, and (3) nanometer scale phases localized within phases 1 and 2. However, qualitative and quantitative SIMS analysis presented in Figure 4 & 5 on the composition of these phases revealed that PSM-rich, nanometer-scale domains preferred to partition within the more ordered, cholesterol-rich/PSM-poor/GM1-rich phase, while GM1-rich, nanometer-scale domains preferred to partition within the surrounding, disordered, cholesterol-poor/PSM-rich/GM1-poor interdomain phase. Since phase behavior is dictated by composition, temperature and pressure on a surface (i.e. including substrate and lipid bilayer edge effects), differences in these parameters may account for the observed differences between their system and ours.
Compositional analysis of the GM1-specific image suggests that GM1 prefers partitioning into both micro- and nanometer scale ordered phases that are surrounded by a disordered phase. The observation of GM1 partitioning into micrometer scale ordered phases is consistent with previous studies. However, there is little and often contradicting evidence supporting its localization within a distributed, nanometer scale phase. A fluorescence microscopy and fluorescence correlation spectroscopy (FCS) study using DiIC18 and CTB-Alexa488 as probes69 showed the preferential partitioning of GM1 into Lo, micrometer scale domains and no indication of an additional, subresolution microdomain structure within these visible domains. In contrast, fluorescence microscopy imaging of native membranes showed no visible micrometer scale phase separation yet FCS analysis showed anomalous diffusion supporting a subresolution structure of small phases dispersed in a continuous phase and limited mobility suggesting its restriction to nanometer scale assemblies that are associated with the cytoskeleton.69 Furthermore, a fluorescence microscopy study70 using DiIC12 and CTB-Alexa488 as probes suggested that CTB binding to the membranes, and not the coa-lescence of pre-existing nanoscale structures, is responsible for creating new phases. On the other hand, an AFM study71 provided convincing evidence for the presence of pre-existing GM1-rich nanoscale (10–60 nm in size) structures at GM1 concentrations above 0.5 mol% in POPC lipid bilayers. The direct SIMS imaging of the lateral distribution of GM1 within a model membrane composed of a lipid raft mixture suggests that GM1 associates with cholesterol-dependent, micrometer-scale ordered phases as well as cholesterol-independent, nanometer scale ordered phases, both dispersed in a liquid disordered, PSM-rich interregion.
The appearance of nanometer scale assemblies and their agglomeration into micrometer scale clusters within the phase separated lipid bilayer presented in Figure 2 is consistent with a recent NanoSIMS imaging study on the cholesterol-dependent phase separation of a ternary lipid bilayer mixture composed of 1:1 15N-DLPC:2H-DSPC with various amounts of cholesterol ranging from 0 to 19 mol%, where cholesterol was not imaged, suggesting the agglomeration of gel-phase, DSPC-rich nanoscopic domains into micrometer-scale clusters at the highest cholesterol content.73 It should be noted that domain sizes are dictated by the thermal history of the sample.74 In the system presented in this paper, heated (T > 70 °C) GUVs were fused to SiO2/Si substrates at rt and incubated for 30 min followed by incubation at 70 °C for 30 min and cooled to rt at a rate of 5 °C/h. This slow cooling treatment is meant to minimize the formation of kinetically trapped regions and allow instead for a phase separation process that is closer to equilibrium.
CONCLUSION
The direct observation of lipid rafts in mammalian cell membranes has been of interest since they were first described75 and assigned important biological roles.76 We have developed a direct method to visualize the spatial organization and preferential partitioning of a monofluorinated derivative of GM1 with cholesterol by NanoSIMS in a canonical lipid raft mixture. As judged by functional and biophysical assays, 18-F-GM1 recapitulates the properties of native GM1 and serves as a minimally perturbed proxy. 18-F-GM1 was examined in the context of a quaternary mixture of lipids in SLBs by NanoSIMS. Quantitative image analysis demonstrates preferential co-localization of GM1 with cholesterol in lipid bilayers, without the need for staining or modification with labels. Furthermore, the SIMS imaging also affords detailed information for all components, such as the co-localization of PSM and DOPC within the interdomain region, which has not been reported using AFM and other techniques. Although the lateral resolution of NanoSIMS is modest compared to AFM, it reveals molecule specific information of the lateral organization. These studies set the stage for comparing the behavior of a wide variety of previously postulated membrane assemblies including lipid rafts in cellular membranes. Studies along these lines are underway in our laboratories.
Supplementary Material
ACKNOWLEDGMENT
MML and SGB are particularly grateful to Dr. Peter Weber at the Lawrence Livermore National Laboratory for initial training on the NanoSIMS 50 at Livermore. MML and SGB thank the Khosla Lab at Stanford University for access to their cell culturing facilities; the Stanford University Mass Spectrometry facilities for help with the analysis of 13C labeled cholesterol isotopomers; Charles Hitzman at the Stanford Nanocharacterization Laboratory for instrument support on the NanoSIMS 50L.
Funding Sources This work was supported in part by the National Institutes of Health (GM069630 to SGB, GM65500 and CA125033 to KK), and the National Science Foundation Biophysics Program (SGB). MML was supported by a Ruth L. Kirschstein NRSA Postdoctoral Fellowship. The Cameca NanoSIMS 50L at the Stanford Nano Shared Facilities is supported by the National Science Foundation (0922648). The ESI–MS and NMR facilities at Tufts are supported by the National Science Foundation (0320783 and 0821508).
Footnotes
Supporting Information Biosynthesis of 13C-cholesterol isotopomers (Figure S1); synthesis of 15N-DOPC; synthesis of monofluorinated GM1 (Scheme S1); Calcium Signaling Assay (Figure S2); FACS (Figure S3); AFM (Figure S4); Fluorescence Microscopy Imaging (Figure S4); SIMS high mass resolving spectra (Figure S5); calibration curves from standard samples for quantitative SIMS analysis (Figure S6 and Table S1–S2); Quantitative and Error analysis of regions of interest in Figure 2 (Figures S7–12 and Table S3–S5); SIMS imaging and quantitative analysis of additionl GUV lipid bilayers (Table S6 and Figure S13–24); and, NanoSIMS images of a lipid bilayer composed of another monofluorinated GM1 (12-F-GM1) analogue (Figure S25). This material is available free of charge via the Internet at http://pubs.acs.org.
Author Contributions All authors have given approval to the final version of the manuscript.
The authors declare no competing financial interest.
REFERENCES
- (1).Lingwood D, Simons K. Science. 2010;327:46–50. doi: 10.1126/science.1174621. [DOI] [PubMed] [Google Scholar]
- (2).Hancock JF. Nat. Rev. Mol. Cell Biol. 2006;7:456–462. doi: 10.1038/nrm1925. [DOI] [PMC free article] [PubMed] [Google Scholar]
- (3).Feigenson GW. Biochim. Biophys. Acta. 2009;1788:47–52. doi: 10.1016/j.bbamem.2008.08.014. [DOI] [PMC free article] [PubMed] [Google Scholar]
- (4).Dietrich C, Yang B, Fujiwara T, Kusumi A, Jacobson K. Biophys. J. 2002;82:274–284. doi: 10.1016/S0006-3495(02)75393-9. [DOI] [PMC free article] [PubMed] [Google Scholar]
- (5).Schütz GJ, Kada G, Pastushenko VP, Schindler H. EMBO J. 2000;19:892–901. doi: 10.1093/emboj/19.5.892. [DOI] [PMC free article] [PubMed] [Google Scholar]
- (6).Pralle A, Keller P, Florin EL, Simons K, Hörber JK. J. Cell Biol. 2000;148:997–1008. doi: 10.1083/jcb.148.5.997. [DOI] [PMC free article] [PubMed] [Google Scholar]
- (7).Varma R, Mayor S. Nature. 1998;394:798–801. doi: 10.1038/29563. [DOI] [PubMed] [Google Scholar]
- (8).Heberle FA, Wu J, Goh SL, Petruzielo RS, Feigenson GW. Biophys. J. 2010;99:3309–3318. doi: 10.1016/j.bpj.2010.09.064. [DOI] [PMC free article] [PubMed] [Google Scholar]
- (9).Bader AN, Hoetzl S, Hofman EG, Voortman J, van Bergen en Henegouwen PMP, van Meer G, Gerritsen HC. Chemphyschem. 2011;12:475–483. doi: 10.1002/cphc.201000801. [DOI] [PubMed] [Google Scholar]
- (10).Sezgin E, Schwille P. Cold Spring Harbor Perspectives in Biology. 2011;3:9803. doi: 10.1101/cshperspect.a009803. [DOI] [PMC free article] [PubMed] [Google Scholar]
- (11).Sharonov A, Hochstrasser RM. Proc. Natl. Acad. Sci. U.S.A. 2006;103:18911–18916. doi: 10.1073/pnas.0609643104. [DOI] [PMC free article] [PubMed] [Google Scholar]
- (12).Giannone G, Hosy E, Levet F, Constals A, Schulze K, Sobolevsky AI, Rosconi MP, Gouaux E, Tampé R, Choquet D, Cognet L. Biophys. J. 2010;99:1303–1310.10. doi: 10.1016/j.bpj.2010.06.005. [DOI] [PMC free article] [PubMed] [Google Scholar]
- (13).Sun Y, Wallrabe H, Booker CF, Day RN, Periasamy A. Biophys. J. 2010;99:1274–1283. doi: 10.1016/j.bpj.2010.06.004. [DOI] [PMC free article] [PubMed] [Google Scholar]
- (14).Betzig E, Patterson GH, Sougrat R, Lindwasser OW, Olenych S, Bonifacino JS, Davidson MW, Lippincott-Schwartz J, Hess HF. Science. 2006;313:1642–1645. doi: 10.1126/science.1127344. [DOI] [PubMed] [Google Scholar]
- (15).Hess ST, Girirajan TPK, Mason MD. Biophys. J. 2006;91:4258–4272. doi: 10.1529/biophysj.106.091116. [DOI] [PMC free article] [PubMed] [Google Scholar]
- (16).Rust MJ, Bates M, Zhuang X. Nat. Methods. 2006;3:793–795. doi: 10.1038/nmeth929. [DOI] [PMC free article] [PubMed] [Google Scholar]
- (17).Eggeling C, Ringemann C, Medda R, Schwarzmann G, Sandhoff K, Polyakova S, Belov VN, Hein B, Middendorff von, C., Schönle A, Hell SW. Nature. 2009;457:1159–1162. doi: 10.1038/nature07596. [DOI] [PubMed] [Google Scholar]
- (18).Sahl SJ, Leutenegger M, Hilbert M, Hell SW, Eggeling C. Proc. Natl. Acad. Sci. U.S.A. 2010;107:6829–6834. doi: 10.1073/pnas.0912894107. [DOI] [PMC free article] [PubMed] [Google Scholar]
- (19).Mueller V, Ringemann C, Honigmann A, Schwarzmann G, Medda R, Leutenegger M, Polyakova S, Belov VN, Hell SW, Eggeling C. Biophys. J. 2011;101:1651–1660. doi: 10.1016/j.bpj.2011.09.006. [DOI] [PMC free article] [PubMed] [Google Scholar]
- (20).van den Bogaart G, Meyenberg K, Risselada HJ, Amin H, Willig KI, Hubrich BE, Dier M, Hell SW, Grubmüller H, Diederichsen U, Jahn R. Nature. 2011;479:552–555. doi: 10.1038/nature10545. [DOI] [PMC free article] [PubMed] [Google Scholar]
- (21).Ge M, Field KA, Aneja R, Holowka D, Baird B, Freed JH. Biophys. J. 1999;77:925–933. doi: 10.1016/S0006-3495(99)76943-2. [DOI] [PMC free article] [PubMed] [Google Scholar]
- (22).Giocondi MC, Vié V, Lesniewska E, Goudonnet JP, Le Grimellec C. J. Struct. Biol. 2000;131:38–43. doi: 10.1006/jsbi.2000.4266. [DOI] [PubMed] [Google Scholar]
- (23).Fukuma T, Jarvis S. Rev Sci Instrum. 2006;77:043701. [Google Scholar]
- (24).Fukuma T, Higgins MJ, Jarvis SP. Biophys. J. 2007;92:3603–3609. doi: 10.1529/biophysj.106.100651. [DOI] [PMC free article] [PubMed] [Google Scholar]
- (25).Loh S-H, Jarvis SP. Langmuir. 2010;26:9176–9178. doi: 10.1021/la1011378. [DOI] [PubMed] [Google Scholar]
- (26).Sheikh KH, Jarvis SP. J. Am. Chem. Soc. 2011;133:18296–18303. doi: 10.1021/ja2068142. [DOI] [PubMed] [Google Scholar]
- (27).Sheikh KH, Giordani C, Kilpatrick JI, Jarvis SP. Langmuir. 2011;27:3749–3753. doi: 10.1021/la104640v. [DOI] [PubMed] [Google Scholar]
- (28).Yu JJ, Fischman DA, Steck TL. J. Supramol. Struct. 1973;1:233–248. doi: 10.1002/jss.400010308. [DOI] [PubMed] [Google Scholar]
- (29).Prinz C, Höök F, Malm J, Sjövall P. Langmuir. 2007;23:8035–8041. doi: 10.1021/la7004634. [DOI] [PubMed] [Google Scholar]
- (30).Popov J, Vobornik D, Coban O, Keating E, Miller D, Francis J, Petersen NO, Johnston LJ. Langmuir. 2008;24:13502–13508. doi: 10.1021/la8007552. [DOI] [PubMed] [Google Scholar]
- (31).Benabdellah F, Seyer A, Quinton L, Touboul D, Brunelle A, Laprévote O. Anal Bioanal Chem. 2010;396:151–162. doi: 10.1007/s00216-009-3031-2. [DOI] [PubMed] [Google Scholar]
- (32).Saleem M, Galla H-J. Biochim. Biophys. Acta. 2010;1798:730–740. doi: 10.1016/j.bbamem.2009.10.011. [DOI] [PubMed] [Google Scholar]
- (33).Yang Y-L, Xu Y, Straight P, Dorrestein PC. Nat. Chem. Biol. 2009;5:885–887. doi: 10.1038/nchembio.252. [DOI] [PMC free article] [PubMed] [Google Scholar]
- (34).Snel MF, Fuller M. Anal. Chem. 2010;82:3664–3670. doi: 10.1021/ac902939k. [DOI] [PubMed] [Google Scholar]
- (35).Lechene C, Hillion F, McMahon G, Benson D, Kleinfeld AM, Kampf JP, Distel D, Luyten Y, Bonventre J, Hentschel D, Park KM, Ito S, Schwartz M, Benichou G, Slodzian G. J. Biol. 2006;5:20. doi: 10.1186/jbiol42. [DOI] [PMC free article] [PubMed] [Google Scholar]
- (36).Galli Marxer C, Kraft ML, Weber PK, Hutcheon ID, Boxer SG. Biophys. J. 2005;88:2965–2975. doi: 10.1529/biophysj.104.057257. [DOI] [PMC free article] [PubMed] [Google Scholar]
- (37).Kraft ML, Fishel SF, Marxer CG, Weber PK, Hutcheon ID, Boxer SG. Applied Surface Science. 2006;252:6950–6956. [Google Scholar]
- (38).Kraft ML, Weber PK, Longo ML, Hutcheon ID, Boxer SG. Science. 2006;313:1948–1951. doi: 10.1126/science.1130279. [DOI] [PubMed] [Google Scholar]
- (39).Boxer SG, Kraft ML, Weber PK. Annu Rev Biophys. 2009;38:53–74. doi: 10.1146/annurev.biophys.050708.133634. [DOI] [PubMed] [Google Scholar]
- (40).Liu Z, Kumar K. Synthesis. 2010;2010:1905–1908. [Google Scholar]
- (41).Shivapurkar R, Souza CM, Jeannerat D, Riezman H. J. Lip. Res. 2011;52:1062–1065. doi: 10.1194/jlr.D014209. [DOI] [PMC free article] [PubMed] [Google Scholar]
- (42).Kelleher JK, Kharroubi AT, Aldaghlas TA, Shambat IB, Kennedy KA, Holleran AL, Masterson TM. Am. J. Physiol. 1994;266:E384–95. doi: 10.1152/ajpendo.1994.266.3.E384. [DOI] [PubMed] [Google Scholar]
- (43).Cholesterol label alternatives suitable for SIMS imaging included 2H, 18O, and 19F. However, each presented issues that led us to pursue 13C as the label of choice. 2H7-Cholesterol is commercially available but conflicts with other deuterated molecules of interest (i.e. 2H31-PSM in these studies); 18O-Cholesterol was synthesized and tested but signal to noise was poor even after 18O-depletion of the SiO2/Si substrates (Mary Kraft and SGB, unpublished), and 19F-Cholesterol is commercially available but it conflicts with other fluorinated molecules of interest (i.e. 19F-GM1 in these studies) and its biophysical properties were drastically different from native cholesterol at the high molar concentrations used in these studies.
- (44).Schwarzmann G, Sandhoff K. Methods in enzymology. 1987;138(26):319–341. doi: 10.1016/0076-6879(87)38028-0. [DOI] [PubMed] [Google Scholar]
- (45).Angelova MI, Soleau S, Meleard P, Faucon J-F, Bothorel P. Springer Proc. Phys. 1992;66:178–182. [Google Scholar]
- (46).Our data (Monica Lozano & SGB, not published) suggests that GUVs (prepared under the same conditions as those described here) composed of 90–95mol% 15N-DOPC and 5–10mol% 18-F-GM1 adsorb to the substrates just as effectively as those described in this paper. So, it is unlikely that DOPC alone is responsible for the apparent lowered adsorption efficiency. Preliminary results also indicate that the addition of 13C-Cholesterol (10, 20, and 30mol%) to a 15N-DOPC/5mol% 18-F-GM1 lipid mixture prevents GUVs from adsorbing to the substrates. However, in another control, the addition of a small amount of 2H-PSM (8mol% 2H-PSM, 16mol% 13C-Cholesterol, 5mol% 18-F-GM1 and 71mol% 15N-DOPC vs 16mol% 13C-Cholesterol, 5mol% 18-F-GM1, and 79mol% 15N-DOPC) induces the adsorption of GUVs but in a less effective manner as those compositions described in this paper.
- (47).Baykal-Caglar E, Hassan-Zadeh E, Saremi B, Huang J. Biochim. Biophys. Acta. 2012;1818(11):2598–2604. doi: 10.1016/j.bbamem.2012.05.023. [DOI] [PubMed] [Google Scholar]
- (48).Yuan C, Furlong J, Burgos P, Johnston L. Biophys. J. 2002;82:2526–2535. doi: 10.1016/S0006-3495(02)75596-3. [DOI] [PMC free article] [PubMed] [Google Scholar]
- (49).Muller K, Faeh C, Diederich F. Science. 2007;317:1881–1886. doi: 10.1126/science.1131943. [DOI] [PubMed] [Google Scholar]
- (50).Berger R, et al. Chem. Soc. Rev. 2011;40:3496–3508. doi: 10.1039/c0cs00221f. [DOI] [PubMed] [Google Scholar]
- (51).Yoder NC, Kumar K. Chem. Soc. Rev. 2002;31:335–341. doi: 10.1039/b201097f. [DOI] [PubMed] [Google Scholar]
- (52).Meng H, Krishnaji ST, Beinborn M, Kumar K. J. Med. Chem. 2008;51(22):7303–7307. doi: 10.1021/jm8008579. [DOI] [PMC free article] [PubMed] [Google Scholar]
- (53).Meng H, Kumar K. J. Am. Chem. Soc. 2007;129:15615–15622. doi: 10.1021/ja075373f. [DOI] [PubMed] [Google Scholar]
- (54).Tang Y, Ghirlanda G, Petka WA, Nakajima T, DeGrado WF, Tirrell DA. Angewandte Chemie-International Edition. 2001;40:1494–1496. [PubMed] [Google Scholar]
- (55).Tang Y, Ghirlanda G, Vaidehi N, Kua J, Mainz DT, Goddard WA, DeGrado WF, Tirrell DA. Biochem. 2001;40:2790–2796. doi: 10.1021/bi0022588. [DOI] [PubMed] [Google Scholar]
- (56).Niemz A, Tirrell DA. J. Am. Chem. Soc. 2001;123:7407–7413. doi: 10.1021/ja004351p. [DOI] [PubMed] [Google Scholar]
- (57).Naarmann N, Bilgicer B, Meng H, Kumar K, Steinem C. Angewandte Chemie-International Edition. 2006:452588–2591. doi: 10.1002/anie.200503567. [DOI] [PubMed] [Google Scholar]
- (58).Bilgicer B, Kumar K. Proc. Natl. Acad. Sci. U.S.A. 2004;101:15324–15329. doi: 10.1073/pnas.0403314101. [DOI] [PMC free article] [PubMed] [Google Scholar]
- (59).O'Hagan D. Chem Commun. 1997;7:645–652. [Google Scholar]
- (60).Dunitz JD. ChemBiochem. 2004;5:614–621. doi: 10.1002/cbic.200300801. [DOI] [PubMed] [Google Scholar]
- (61).Smith EA, van Gorkum CM, Dea PK. Biophys. Chem. 2010;147:20–27. doi: 10.1016/j.bpc.2009.12.005. [DOI] [PubMed] [Google Scholar]
- (62).Smith EA, Wang W, Dea PK. Chem. Phys. Lipids. 2012;165:151–159. doi: 10.1016/j.chemphyslip.2011.12.006. [DOI] [PubMed] [Google Scholar]
- (63).Sanii B, Szmodis AW, Bricarello DA, Oliver AE, Parikh AN. J Phys Chem B. 2010;114:215–219. doi: 10.1021/jp908585u. [DOI] [PubMed] [Google Scholar]
- (64).Frey SL, Chi EY, Arratia C, Majewski J, Kjaer K, Lee KYC. Biophys. J. 2008;94:3047–3064. doi: 10.1529/biophysj.107.119990. [DOI] [PMC free article] [PubMed] [Google Scholar]
- (65).Koenig B, Kruger S, Orts W, Majkrzak C, Berk N, Silverton J, Gawrisch K. Langmuir. 1996;12:1343–1350. [Google Scholar]
- (66).Veatch SL, Keller SL. Phys. Rev. Lett. 2005;94:148101. doi: 10.1103/PhysRevLett.94.148101. [DOI] [PubMed] [Google Scholar]
- (67).Marsh D. Biochim. Biophys. Acta. 2009;1788:2114–2123. doi: 10.1016/j.bbamem.2009.08.004. [DOI] [PubMed] [Google Scholar]
- (68).Nakagawa T, Tani M, Kita K, Ito M. J Biochem. 1999;126:604–611. doi: 10.1093/oxfordjournals.jbchem.a022492. [DOI] [PubMed] [Google Scholar]
- (69).Bacia K, Scherfeld D, Kahya N, Schwille P. Biophys. J. 2004;87:1034–1043. doi: 10.1529/biophysj.104.040519. [DOI] [PMC free article] [PubMed] [Google Scholar]
- (70).Hammond AT, Heberle FA, Baumgart T, Holowka D, Baird B, Feigenson GW. Proc. Natl. Acad. Sci. U.S.A. 2005;102:6320–6325. doi: 10.1073/pnas.0405654102. [DOI] [PMC free article] [PubMed] [Google Scholar]
- (71).Shi J, Yang T, Kataoka S, Zhang Y, Diaz AJ, Cremer PS. J. Am. Chem. Soc. 2007;129:5954–5961. doi: 10.1021/ja069375w. [DOI] [PMC free article] [PubMed] [Google Scholar]
- (72).Nyholm TKM, Lindroos D, Westerlund B, Slotte JP. Langmuir. 2011;27:8339–8350. doi: 10.1021/la201427w. [DOI] [PubMed] [Google Scholar]
- (73).Anderton CR, Lou K, Weber PK, Hutcheon ID, Kraft ML. Biochim. Biophys. Acta. 2011;1808:307–315. doi: 10.1016/j.bbamem.2010.09.016. [DOI] [PubMed] [Google Scholar]
- (74).Goksu EI, Vanegas JM, Blanchette CD, Lin W-C, Longo ML. Biochim. Biophys. Acta. 2009;1788:254–266. doi: 10.1016/j.bbamem.2008.08.021. [DOI] [PubMed] [Google Scholar]
- (75).Simons K, Van Meer G. Biochemistry. 1988;387:6197–6202. doi: 10.1021/bi00417a001. [DOI] [PubMed] [Google Scholar]
- (76).Simons KK, Ikonen EE. Nature. 1997;387:569–57. doi: 10.1038/42408. [DOI] [PubMed] [Google Scholar]
Associated Data
This section collects any data citations, data availability statements, or supplementary materials included in this article.