

This study addresses how active transcription may be concentrated into localized foci—transcription factories—in the nucleus. Here, Ghamari et al. follow transcription steps in living cells derived from CDK9-mCherry knock-in mice. They show that transcription factories operate in mammalian cells and that transcription initiation and elongation steps take place in different compartments. Their findings suggest a modified transcription factory model whereby genes form nuclear foci at the initiation step, but transcription moves out of these foci during elongation.
Keywords: transcription factory, RNA polymerase II, live imaging
Abstract
Transcription steps are marked by different modifications of the C-terminal domain of RNA polymerase II (RNAPII). Phosphorylation of Ser5 and Ser7 by cyclin-dependent kinase 7 (CDK7) as part of TFIIH marks initiation, whereas phosphorylation of Ser2 by CDK9 marks elongation. These processes are thought to take place in localized transcription foci in the nucleus, known as “transcription factories,” but it has been argued that the observed clusters/foci are mere fixation or labeling artifacts. We show that transcription factories exist in living cells as distinct foci by live-imaging fluorescently labeled CDK9, a kinase known to associate with active RNAPII. These foci were observed in different cell types derived from CDK9-mCherry knock-in mice. We show that these foci are very stable while highly dynamic in exchanging CDK9. Chromatin immunoprecipitation (ChIP) coupled with deep sequencing (ChIP-seq) data show that the genome-wide binding sites of CDK9 and initiating RNAPII overlap on transcribed genes. Immunostaining shows that CDK9-mCherry foci colocalize with RNAPII-Ser5P, much less with RNAPII-Ser2P, and not with CDK12 (a kinase reported to be involved in the Ser2 phosphorylation) or with splicing factor SC35. In conclusion, transcription factories exist in living cells, and initiation and elongation of transcripts takes place in different nuclear compartments.
Transcription by RNA polymerase II (RNAPII) is a multistep process, starting with the association of its inactive hypophosphorylated form. It is phosphorylated at the Ser5 and Ser7 positions of the C-terminal domain (CTD), at initiation of transcription, by cyclin-dependent kinase 7 (CDK7) that is part of the TFIIH complex (Glover-Cutter et al. 2009; Larochelle et al. 2012). RNAPII then pauses in the promoter-proximal region, requiring the action of P-TEFb (CDK9 in conjunction with cyclin T1, T2, or K) to phosphorylate the second serine (Ser2) of the CTD (Peterlin and Price 2006; Brookes and Pombo 2009; Fuda et al. 2009; Nechaev and Adelman 2011). A major interest in the field of transcription regulation has been to know how this process is organized in the cell nucleus, after the pioneering observations in the early 1990s; the labeled nascent transcripts were visualized in fixed cells to show that transcription by RNAPII is localized to limited sites in the nucleus (Jackson et al. 1993; Wansink et al. 1993). These localized sites of transcription, which colocalized with foci of active RNAPII, were subsequently termed “transcription factories” (Iborra et al. 1996a). Since then, transcription factories have been studied in fixed cells by a number of groups (Osborne et al. 2004, 2007; Ragoczy et al. 2006; Mitchell and Fraser 2008; Ferrai et al. 2010; Schoenfelder et al. 2010b). However, the transcription factory model received serious skepticism from critics who raised the concern that fixation could cause artificial aggregation of RNAPII molecules. Since then, many efforts have been directed toward revealing the factories in living cells by tagging RNAPII with a fluorescent tag. This, however, remained unsuccessful, probably because all forms of RNAPII were labeled, clouding the observations. To nevertheless track active RNAPII in living cells, we decided to monitor factories by tracking CDK9, a transcription factor that is associated with active RNAPII. We were particularly interested in this factor because it is associated with the “Ldb1” transcription factor complex, which binds to a distal regulatory region that interacts with the region of the gene where the initiated polymerase is paused (Stadhouders et al. 2012). CDK9 phosphorylates RNAPII-Ser5P and a number of other factors to allow transcriptional elongation (Marshall et al. 1996; Peterlin and Price 2006; Yamada et al. 2006). We first determined the genome-wide binding of CDK9, total RNAPII, initiating RNAPII (Ser5P), and elongating RNAPII (Ser2P). These data showed that CDK9 colocalizes with initiating RNAPII-Ser5P in the promoter region. Next, to visualize the CDK9/RNAPII complex in living cells, we tagged CDK9 with the fluorescent protein mCherry using homologous recombination in mouse embryonic stem (mES) cells and generated a knock-in mouse with these cells. Live imaging of CDK9-mCherry using spinning-disk confocal microscopy (SDCM) shows distinctive fluorescent spots in different tissues isolated from the knock-in mouse. Time-lapse imaging of foci shows that they are very stable over a number of hours, even though fluorescence recovery after photobleaching (FRAP) of the CDK9-mCherry foci showed that the foci are highly dynamic in exchanging CDK9 molecules.
To study the relative localization of initiating and elongating RNAPII with CDK9-mCherry foci, we performed immunofluorescent staining experiments of a number of proteins involved in transcription initiation, elongation, and splicing. This showed that CDK9-mCherry foci overlap with initiating RNAPAII-Ser5P but not with elongating RNAPII-Ser2P, indicating that CDK9-mCherry foci indeed mark active transcription foci and that initiating and elongating RNAPII do not overlap in the transcription factories, leading to the conclusion that the different transcription steps are compartmentalized in mammalian cells.
Results
CDK9 and RNAPII-Ser5P co-occupy the promoter-proximal region of transcribed genes
To determine whether CDK9 is a representative protein of RNAPII transcription factories, we first determined the genome-wide occupancy of CDK9 and the overlap of CDK9 with two active forms of RNAPII (initiating and elongating) by chromatin immunoprecipitation (ChIP) coupled with deep sequencing (ChIP-seq) in our model cell line (mouse erythroid leukemia [MEL] cells), in which we previously determined the genome-wide binding sites of the Ldb1 complex containing CDK9 (Fig. 1A; Soler et al. 2010). This included the interaction of the distal Ldb1-binding regulatory regions with the pause site of RNAPII in the myb gene (Stadhouders et al. 2012). The data (Fig. 1B) show that the binding pattern of CDK9 is similar to RNAPII-Ser5P, with the highest enrichment in the 5′ end of genes, which decreases over the coding region up to the 3′ end. In contrast, RNAPII-Ser2P enrichment shows the highest peaks in the 3′ end, with a low level of enrichment throughout the genes. A different but also important observation is that CDK9 binding also occupies the regulatory regions of genes where the erythroid-specific Ldb1 transcription complex binds, confirming our previous results (Soler et al. 2010). Based on the high overlap of CDK9 and RNAPII-Ser5P at gene promoters and the general requirement of CDK9 for transcription by RNAPII (Chao and Price 2001; Rahl et al. 2010), we conclude that CDK9 is a good marker to image RNAPII transcription foci in living cells.
Figure 1.

CDK9 and RNAPII co-occupy the promoter-proximal region of transcribed genes. (A) Clustering of RNAPII (left) and CDK9 (right) binding in a window of ±1 kb relative to the transcription start site (TSS) of 6618 expressed genes in erythroid cells. This analysis shows five different classes of expressed genes. In 90% of the genes (classes I, II, and III), the pattern of binding of the two proteins relative to the TSS is very similar. In 3% of genes (class IV), a high level of RNAPII but a low level of CDK9 was detected. Seven percent of genes (class V) did not show significant binding of RNAPII and CDK9. (B) Binding of CDK9, RNAPII-Ser5P, and RNAPII-Ser2P on two representative genes. CDK9 and RNAPII-Ser5P co-occupy the promoter-proximal region, whereas RNAPII-Ser2P is enriched in the 3′ ends of genes.
Generation of a mouse expressing CDK9-mCherry and imaging primary cells
In order to image transcription foci in living cells, we generated a fluorescently labeled CDK9 by knocking in mCherry into the CDK9 gene by homologous recombination in mES cells (Fig. 2A,B). A correctly targeted clone (Fig. 2C) was used to generate chimeras that were bred to generate heterozygous and homozygous CDK9-mCherry mice, showing that the tagged protein is fully functional.
Figure 2.
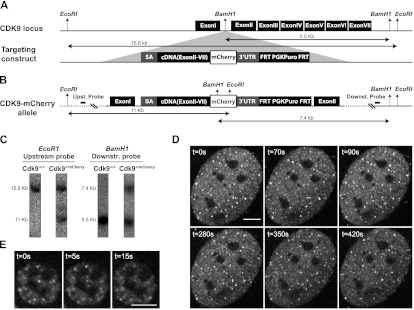
Generation of a CDK9-mCherry knock-in mouse and imaging of primary cells. (A) The CDK9 locus was targeted with a construct consisting of upstream and downstream homology arms flanking a DNA fragment that has a splice acceptor, cDNA (exon II–VII), fused in-frame to mCherry, followed by a stop codon, the 3′ untranslated region (UTR( of the Cdk9 gene, and the puromycin selection marker flanked by FRT sequences. The insert was recombined into a unique BamH1 site in the intron I of Cdk9 gene. (B) The targeted (CDK9-mCherry) allele is shown with restriction sites and the corresponding fragment sizes. Probes for Southern blot analysis are located outside the targeting arms (distances are not scaled). (WT) Wild type; (Puro) puromycin. (C) Southern blot of a correctly targeted clone. Upstream and downstream probes were hybridized with DNA digested with EcoRI and BamH1, respectively. Unprocessed in vivo images of primary MEFs (D) and fetal liver cells (E) isolated from a knock-in CDK9-mCherry mouse. The real-time unprocessed movies are shown in Supplemental Movies S2 and S3. Bar, 5 μm.
We imaged the targeted heterozygous CDK9-mCherry mES cells using a spinning-disk confocal microscope. We could detect a distinct pattern of fluorescent spots, also referred to as foci, in the nucleus (Supplemental Movie S1). Next, we imaged cells of primary tissues, mouse embryonic fibroblasts (MEFs) (Supplemental Movie S2), erythroid (fetal liver) cells (Supplemental Movie S3), neuronal (Supplemental Movie S4) cells, and adult liver (Supplemental Movies S5) cells isolated from the knock-in mice. In all of these cells and most clearly in the very flat MEFs, we observed very distinct CDK9-mCherry fluorescent foci, as were earlier observed in mES cells. Short time-lapse imaging of MEFs and fetal liver cells showed that these foci are positionally stable (although some occasionally moved into a different optical plane) (Fig. 2D,E; Supplemental Movie S2). Imaging the MEF foci over a long period of time showed that they were stable even after 3.5 h of imaging (Fig. 3A–K). Interestingly, the erythroid cells often contained some larger foci that appear as aggregates of smaller foci (Supplemental Movie S6, three-dimensional [3D] animation). The fluorescent pattern of CDK9-mCherry localization in living primary cells is similar to previous reports on the punctate localization of transcription factories in fixed cell lines (Jackson et al. 1993; Wansink et al. 1993; Iborra et al. 1996b; Osborne et al. 2004; Ragoczy et al. 2006; Mitchell and Fraser 2008; Ferrai et al. 2010; Schoenfelder et al. 2010b).
Figure 3.

Long time-lapse live imaging shows stable CDK9-mCherry foci. Stabilized and deconvolved image projection of 3D stacks of a CDK9-mCherry MEF cell. (A–H) Various time frames show CDK9-mCherry foci. (Arrowheads) Example of two large foci that remain stable during a period of 3.5 h. (I) Overlay of all time frames shown in A–H. (J,K) Movement of two large CDK9-mCherry foci positioned at the arrowheads as seen in A–H over a period of 3.5 h.
CDK9 foci colocalize with RNAPII-Ser5P but not with RNAPII-Ser2P
Our ChIP-seq data, together with previous reports on active RNAPII occupancy (Komarnitsky et al. 2000; Rahl et al. 2010), show that RNAPII-Ser5P and CDK9 mostly occupy the promoter region of genes and that RNAPII-Ser2P mostly occupies the 3′ end. The phosphorylated RNAPII foci have already been mapped to transcription factories (Osborne et al. 2004; Ragoczy et al. 2006; Eskiw et al. 2008; Mitchell and Fraser 2008; Ferrai et al. 2010; Schoenfelder et al. 2010a), and we checked whether they colocalize with the CDK9-mCherry. We performed immunostaining experiments to determine the colocalization of CDK9-mCherry foci with RNAPII-Ser5P and RNAPII-Ser2P. MEFs derived from the knock-in mouse were fixed and immunostained with specific antibodies against the RNAPII-Ser5P (3E8) (Fig. 4A) and RNAPII-Ser2P (3E10) (Fig. 4D; Chapman et al. 2007). To be able to determine the exact difference in colocalization of the two different protein-staining patterns, we measured the colocalization of the two proteins by determining the percentage of volume that has an overlap in fluorescence. To that end, the CDK9-mCherry staining was volume-rendered into red objects, and the RNAPII-Ser5P or RNAPII-Ser2P signals were volume-rendered into green objects (Fig. 4B,C,E,F). Colocalization was determined as the percentage of volume of an active RNAPII (green) object that overlaps a CDK9 (red) object.
Figure 4.

CDK9 foci colocalize with RNAPII-Ser5P but not with RNAPII-Ser2P. Deconvolved optical slice of a CDK9-mCherry MEF cell immunostained for RNAPII-Ser5P (A) or RNAPII-Ser2P (D). Volume-rendered images of A (B) and D (E) and zoom in C and F of insets of B and E. (G) Normalized frequency distribution of all of the colocalizing objects of RNAPII-Ser2P (gray line) and RNAPII-Ser5P (black line) with CDK9-mCherry. Bars show the percentage of noncolocalized staining. Bar, 4 μm.
The normalized frequency distribution of the RNAPII-Ser5P colocalizing objects (Fig. 4G) showed a broad range of volume colocalization values for 83% of the signals, with a high average value of 41%. The remaining 17% of the RNAPII-Ser5P foci showed no colocalization (Fig. 4G, bars). A detailed analysis of these noncolocalizing foci showed that these were predominantly the very small foci in the nucleus.
The same analysis was done for the RNAPII-Ser2P (Fig. 4G). A significant increase in signals that show no colocalization was found (26%). Those foci that show overlap have a low percentage of volume colocalization, with an average value of 23%. The frequency distribution graph does not show a secondary peak of large foci with a high percentage of colocalization, as observed with the RNAPII-Ser5P. This indicates that RNAPII-Ser2P resides in a vicinity close to RNAPII-Ser5P/CDK9 foci.
CDK9 foci remain in the absence of transcription
It has been shown that transcription factories remain present after inhibition of transcription by heat shock (Mitchell and Fraser 2008). We therefore examined whether CDK9-mCherry foci (Supplemental Fig. S1A) also remain present in the absence of transcription by using the transcription initiation inhibitor α-amanitin (initiation inhibitor) (Supplemental Fig. S1B) and two transcription elongation inhibitors: 5,6-dichloro-1-β-D-ribofuranosylbenzimidazole (DRB) (Supplemental Fig. S1C) and flavopiridol (Supplemental Fig. S1D). The inhibition was performed for a period of 3 h. Immunostaining of RNAPII-Ser2P after inhibition showed that the RNAPII-Ser2P signal was reduced to very low or nondetectable levels, confirming that the inhibition was efficient. Supplemental Figure S1 shows that the CDK9-mCherry foci remain present despite the block of transcription, in agreement with the previous report that transcription factories remain in the absence of transcription.
CDK9 foci do not colocalize with CDK12 and SC35 domains
CDK12 has been reported to also have RNAPII-Ser2 kinase activity, similar to CDK9, and thus could potentially be involved in activating RNAPII and early stages of transcription. It has also been reported to be involved in RNA splicing and was found to occupy active genes on polytene chromosomes of Drosophila (Bartkowiak et al. 2010; Kohoutek and Blazek 2012). However, immunostaining of the CDK12 in CDK9-mCherry MEFs (Fig. 5A,B) shows no colocalization of the two proteins. Most of the CDK12 fluorescent spots (65%) have no overlap at all. In the remaining 35% of the spots, the percentage of colocalization volume is low (average Vco-loc = 34%). In contrast, high colocalization was observed with Hexim1 (Fig. 5C,D), a general RNAPII transcription inhibitor, which was earlier seen to sequester P-TEFb in a large inactive 7SK snRNP complex, preventing RNAPII phosphorylation and subsequent transcriptional elongation (Yik et al. 2003; Michels et al. 2004). CDK9-mCherry also colocalizes with cyclin T1, which forms a complex with CDK9 (Fig. 5E,F; Baumli et al. 2008). This confirms that the CDK9 foci colocalize with foci of the initiated RNAPII and that CDK12 is not likely to be a part of a transcription factory but still can be involved in the later stages of transcription/splicing.
Figure 5.

CDK9 foci colocalize with Hexim1 and cyclin T1 but not with CDK12 and SC35. Deconvolved optical slice of CDK9-mCherry MEF cells derived from a CDK9-mCherry knock-in mouse. Cells were immunostained for CDK12 (A), Hexim1 (C), cyclin T1 (E), or SC35 (G). (B,D,F,H) Graphs show the percentage of noncolocalized staining (green bars) and the normalized frequency distribution of all colocalizing objects (gray line graphs) (see also the Material and Methods).
SC35 domains (or nuclear speckles) are sites where proteins involved in mRNA metabolism are present. They are not involved in the active RNA transcription process itself but are proposed to be important as dynamic “hubs,” facilitating expression of highly active genes. It is thought that SC35 speckles act like a “bridge” “spanning” nuclear space from the gene's newly synthesized transcripts to the “stored” proteins involved in mRNA post-transcription processing (Spector and Lamond 2011). It was reported that CDK9 was present in a vicinity close to SC35 domains and showed little or no colocalization with these domains (Herrmann and Mancini 2001). Immunostaining of nuclear speckles with anti-SC35 antibody confirms that the nuclear speckles do not colocalize with CDK9-mCherry foci (Fig. 5G,H) but are indeed in a vicinity close to the distinctive CDK9-mCherry foci.
The immunostaining analysis agreed with the results obtained by the ChIP-seq above (Fig. 1B), showing that CDK9 generally coincides with RNAPII-Ser5P at the 5′ end of genes. Furthermore, colocalization analysis of RNAPII-Ser2P and RNAPII-Ser5P (Chapman et al. 2007) with CDK9-mCherry also confirmed that these two forms of RNAPII do not colocalize (Fig. 4). Transcription factories are also not colocalizing with CDK12 (Fig. 5A,B) or nuclear speckles (Fig. 5G,H), domains where post-transcriptional proteins are housed. We therefore conclude that transcriptional initiation and elongation steps occupy different compartments in the nuclear space.
CDK9-mCherry foci mark active transcription sites
It has been shown by fluorescence in situ hybridization (FISH) of primary RNA combined with immunostaining of active RNAPII that transcripts of active genes colocalize with RNAPII factories (Osborne et al. 2004; Ragoczy et al. 2006; Schoenfelder et al. 2010b), although others have reported that these transcripts colocalize with the splicing machinery next to transcription factories (Brown et al. 2008). This suggests that initiation and pausing would take place in the factory and splicing outside the factory. In addition, several groups have reported that the 5′ and 3′ ends of genes interact with each other (Tan-Wong et al. 2012). To confirm that CDK9-mCherry foci indeed mark active transcription sites, we mildly fixed (to retain mCherry fluorescence) the primary erythroid cells and used these for primary RNA-FISH experiments (van de Corput and Grosveld 2001; de Krom et al. 2002).
First, we hybridized digoxygenin-labeled intron and exon probes specific for α-globin (Fig. 6A–C) and β-globin (Fig. 6 D,E). Both globin genes are short and abundantly expressed in erythroid cells and would be expected to partially overlap with the CDK9-mCherry foci. As shown in Figure 6, C and F, this is indeed the case. We therefore conclude that the CDK9 foci mark active sites of transcription. However the globin genes are very small (∼2 kb) and hence do not provide a good resolution with the considerable amplification to detect the primary RNA. We therefore analyzed a much larger gene expressed in MEFs; namely, the collagen type IVα1 (Col4a1) gene, of which the primary transcript of 114 kb contains 52 exons and, after splicing, results in a 6.6-kb functional mRNA. We chose intron probes that were located ∼900 base pairs (bp) from the 5′ end region and 1500 bp from the 3′ end region of the primary transcript/gene with a gap of 111 kb between the two probes. The distance between the 5′ and 3′ ends of the primary transcripts should be resolvable by confocal microscopy, and it would be expected that most of the signals would be outside the foci (being spliced) but that a small proportion (transcript initiation and possibly termination) would overlap or be very close to the CDK9 foci. The results for the 5′ and 3′ probes are very similar in that most signals are outside the CDK9 foci, but some overlap with the foci (Supplemental Fig. S2A–N), suggesting that elongation is outside the CDK9-marked transcription factories, which would agree with the CDK9-mCherry/ser5/ser2 colocalization results. However it should be noted that it is not known how quickly and how far the primary transcript moves away from the template while its transcription is still in progress; i.e., the large primary RNA does not allow drawing a conclusion about the localization of the transcribing template DNA.
Figure 6.

CDK9 foci mark transcription sites. Confocal image projection of a 3D image stack of RNA-FISH-stained fetal liver cells isolated from a CDK9-mCherry knock-in 14.5-d-post-coitum (dpc) embryo. β-Globin (A–C) and α-globin (D–F) RNA staining (A,D) with CDK9-mCherry fluorescence (B,E). Overlay images (C,F) show a large overlap of globin transcripts and CDK9-mCherry fluorescence in the nucleus.
CDK9-mCherry molecules are dynamically recruited to transcription factories
Transcription factories have been shown in fixed cells, and the dynamics of any of their components have never been addressed. To understand how dynamic CDK9-mCherry exchange within the transcription factories, we performed FRAP experiments. By bleaching mCherry fluorescence and measuring the recovery of the fluorescence after bleaching, the exchange of CDK9-mCherry within the stable foci can be measured. FRAP experiments showed that the CDK9-mCherry signal recovered very fast, with a 50% fluorescent recovery of <2 sec after bleaching (Fig. 7A,B; Supplemental Movie S7), indicating that although the foci have a stable position, the exchange of CDK9-mCherry is very rapid, suggesting that CDK9-mCherry is continuously recruited to the transcription factories.
Figure 7.
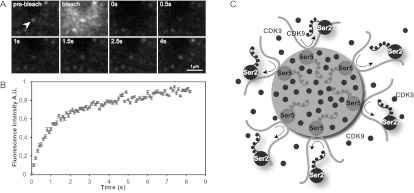
CDK9 is dynamically recruited to transcription factories. FRAP of CDK9-mCherry foci in MEFs. (A) Stills of the live imaging to show the rapid exchange of CDK9. (B) Plot of the average of recovery after bleaching of seven FRAP measurements (±SEM) (AU) Arbitrary units. The real-time movie is shown in Supplemental Movie S5. (C) A model of transcription; gene promoters are loaded with RNAPII-Ser5P (Ser5 light gray) in factories. Elongating RNAPII-Ser2P (Ser2, dark gray) moves to the adjacent nuclear space when it becomes phosphorylated at Ser2 by CDK9. Filled circles represent CDK9, which, together with RNAPII-Ser5P (light gray), is enriched in the factory. CDK9 is also present outside the factory and is exchanged quickly.
Discussion
Our data have a number of important implications. We show that CDK9 colocalizes with initiated RNAPII and localizes in vivo to a limited number of discrete foci in the nuclei of different cell types. This provides the first in vivo verification of the original transcription factory proposal that was based on the observation that labeled nascent transcripts in fixed cells are present in a limited number of clusters (Jackson et al. 1993; Wansink et al. 1993; Iborra et al. 1996a). The transcription factory model was reinforced by data showing the colocalization of transcribed genes from different chromosomes to RNAPII-Ser5P foci (Osborne et al. 2004; Mitchell and Fraser 2008; Schoenfelder et al. 2010b).
In agreement with earlier studies showing the difference between CDK9 and CDK12 (Bartkowiak et al. 2010), we show in this study that CDK9-mCherry foci overlap with the initiating RNAPII-Ser5P and much less so with the elongating RNAPII-Ser2P and other markers of RNA processing, suggesting that the elongating RNAPII moves out of the transcription factory where initiation takes place. The in situ hybridization for globin transcripts indicates that the CDK9-mCherry foci indeed indicate sites of transcription. However, these are short transcripts, and the resolution is insufficient to determine their exact overlap. We repeated this experiment with a much longer gene/primary RNA (114 kb Col4α1). which shows that the RNA is largely outside the CDK9-mCherry foci, which would agree with the observation by Brown et al. (2008) showing that active genes colocalize with the splicing machinery on the outside of transcription factories. However, it should be noted that the position of a long transcript does not allow a conclusion about the position of the DNA template. To obtain this type of information, one would have to follow the DNA template only, excluding the RNA transcript, which as yet is technically not feasible for us. Nevertheless, our results clearly disagree with a model that predicts that the gene is reeled through fixed RNAPII in the factory during transcription. The “fixed RNA polymerase” model postulates that initiating and elongating RNAPII reside in the same place (Papantonis et al. 2010). Direct coimmunostaining of RNAPII-Ser5P and RNAPII-Ser2P with the presently available antibodies is not feasible. However, by using CDK9-mCherry as an independent reference to localize the different forms of RNAPII, our data clearly show that these two forms of RNAPII have a different nuclear localization (Fig. 4). The data on the different localization of CDK9 at the 5′ end of the gene (initiation) and CDK12 toward the 3′ end of the gene are in agreement with those of Bartkowiak et al. (2010) suggesting that CDK9 is required to start the elongation process, whereas CDK12 is required for downstream elongation maintenance and splicing.
Thus, we propose that the different transcription steps are compartmentalized (Fig. 7C); i.e., initiation and very early elongation of different genes occur in factories, whereas transcriptional elongation through the genes occurs in a separate, adjacent nuclear space. Our data on imaging the factories for longer periods and the recent data by Noordermeer et al. (2011) looking at specific transinteractions stably taking place in so-called “jackpot” cells suggest that transcription factories, once formed, are stable, even though at least one of its components, CDK9, dynamically exchanges. This, together with the observation on colocalization of different combinations of genes in the factories in different cells (Osborne et al. 2004; Schoenfelder et al. 2010b), suggests that intrachromosomal and interchromosomal contacts are formed by chance but, once established, become stabilized in a factory. Such factories may be independently preassembled structures (Mitchell and Fraser 2008), possibly involving some sort of nucleoskeleton (Jackson and Cook 1985; Kimura et al. 1999). The factories would arise as a sum of events such as de novo nucleation of basal and specific transcription complexes on active loci and/or preferential interactions between chromatin regions. This would be the result of the physical property of large macromolecular complexes to aggregate in a self-organizing manner (Misteli 2001; Rippe 2007), resulting from a number of forces—macromolecular crowding (Minton 2006), the so called “depletion effect” (Marenduzzo et al. 2006), and hydrophobic effects (Chandler 2005)—forming a stable colloidal-like nuclear fluid that can rapidly exchange individual components such as CDK9 in the case of transcription foci.
Materials and methods
RNA sequencing and data analysis
RNA was extracted from MEL cells with the Qiagen RNeasy minikit. Sequencing was performed on the Illumina Genome Analyzer (HiSeq 2000). Raw reads were mapped with Bowtie (Langmead et al. 2009) to RefSeq transcripts based on the University of California at Santa Cruz (UCSC) mouse genome annotation (NCBI37/mm9). The number of reads for each transcript and reads per kilobase of a transcript per million mapped reads (RPKMs) were calculated and assigned to each transcript. The longest transcript was chosen as a reference gene for downstream analysis, and the highest expression value from alternative transcripts was assigned to the reference gene. Six-thousand-one hundred-twenty-eight expressed genes were selected based on RPKMs ≥10. Four-thousand-three-hundred-fifteen lowly expressed genes were selected based on RPKMs <1 and the total number of all reads in replicas <50 and >1.
ChIP-seq and data analysis
Genome occupancy of CDK9, RNAPII, RNAPII-Ser5P, and RNAPII-Ser2P was performed by ChIP-seq in the MEL cell line as described (Soler et al. 2010, 2011). CDK9 C20 antibody (Santa Cruz Biotechnology, C20, sc-484), RNA Pol II antibody (Santa Cruz Biotechnology, N20, sc899), and RNAPII-Ser5P and RNAPII-Ser2P antibodies (Chapman et al. 2007) were used for ChIP. Thirty-six-base-pair raw reads were mapped against NCBI build 37.1 of the mouse genome with ELAND (Illumina). Uniquely mapped reads were extended to 200 bp and then transformed into the genome-wide read density (coverage) with the ShortRead Bioconductor package (Morgan et al. 2009). The coverage from ChIP and IgG control was then normalized to have equal levels of background signal. The method used to normalize was modified from Peakseq (Rozowsky et al. 2009). After normalization, tracks of coverage profiles for all factors and IgG control were uploaded and visualized by the UCSC genome browser. The coverage from all factors was subtracted from the normalized coverage from the corresponding IgG controls. For colocalization analysis (Fig. 1A), RNAPII- and CDK9-binding signals were calculated for each reference gene. Genes were binned with 20 100-bp windows ±1 kb relative to the transcription start site. RNAPII and CDK9 signals were determined as the maximal signal in each window and then transformed into the standard Z-scores. The Z-score-transformed matrices from reference-expressed genes and lowly expressed genes were clustered with the K-mean clustering method (Euclidean distance). The clustering results were visualized with Java Treeview.
SDCM
All live-cell imaging experiments and FRAP measurements were carried out on a Nikon Eclipse Ti-E inverted microscope with a Nikon CFI APO TIRF 100× 1.49 NA oil objective (Nikon). The microscope was equipped with a FRAP-3D system (Roper Scientific) and Nikon's perfect focus system (Nikon) and was connected to a Yokogawa dual spinning-disc confocal scanning unit (Yokogawa, CSU-X1-A1) with a 405-491-561 triple band dichroic mirror and GFP, mCherry, and GFP/mCherry emission filters (Chroma). mCherry was excited with a 561-nm diode laser. A QuantEM 512SC EMCCD camera (Photometrics) with an imaging array of 512 × 512 pixels and 16-bit digitization was connected to the CSU via a dual view (Roper, DV2) equipped with dichroic filter 565dcxr (Chroma) and a HQ530/30m emission filter (Chroma). Images were projected onto the CCD chip of the camera via a 2.0× intermediate lens (mounted between the camera and the dual view) at a magnification of 68 nm/pixel. A stage-top heater (Tokai Hit, INUG2E-ZILCS) and a lens heater were used to keep the cells at 37°C during live imaging experiments. The microscope setup was controlled by MetaMorph 7.5 software (Molecular Devices).
Confocal laser scanning microscopy
3D image stacks were acquired on a Leica SP5 confocal laser scanning microscope (Leica) by optical sectioning using the LAS software provided with the instrument. The system was equipped with a 63× plan-apochromat oil 1.4 NA DIC objective. The pinhole diameter was set to 1 airy unit (95.5 μm). Alexa Fluor 488 and mCherry were excited with a 488-nm Argon laser and a 594-nm laser, respectively, and detected using a multitrack imaging mode using band-pass filters of 505–550 nm (Alexa 488) and 605–700 nm (mCherry). Eight-bit images with a 512 × 512-pixel frame size and 48 × 48 pixel size were acquired with a 400-Hz scan speed, 4× line averaging, and an optical sectioning of 120 nm.
FRAP
Cells were recorded using SDCM using the “stream acquisition” function with an exposure time of 100 msec. During stream acquisition, a small circular spot was bleached for 50 msec using the 491-nm laser at 100% laser power. Measurements were done using ImageJ (National Institutes of Health). A small circular region of interest (ROI) with an approximate diameter of 3 μm was selected in the center of the bleached spot. The “plot Z profile” function in ImageJ was used to measure the mean intensity within the ROI over time. To correct for acquisition bleaching, a reference ROI with the same diameter was selected in a nonbleached area. First, the values measured in the bleached ROI were divided by the values in the reference ROI. Then, the first value after the bleach pulse was subtracted from the data set. Five data points before the bleach were averaged, and this value was used to normalize the data set to 1. The values of multiple measurements in different cells were averaged, and the standard error of the mean was calculated.
Image processing
Time-lapsed and live 3D image stacks were corrected for drift and movement by cell motion, thermal drift, shaking, x-y-z translation, and axial rotation using the image stabilizer available in the Huygens Professional software version 4.0 (Scientific Volume Imaging). After image stabilization, all images were deconvolved with Huygens Professional using a theoretical point spread function for each channel and the classical maximum likelihood estimation algorithm. The signal to noise ratios and background intensities were manually determined and taken into account during the deconvolution process.
To measure the degree of colocalization, the images were loaded into the object analysis tool of the Huygens Professional software. This tool renders a distinct group of voxels that are separated from the background according to threshold segmentation criteria into a 3D object by using a surface renderer. Fluorescent signals of CDK9-mCherry were thus rendered into red objects, and the RNAPIISer5P or RNAPIISer2P was rendered into green objects. The degree of colocalization was determined by the percentage of volume of one object that overlaps with a second object: the percentage of relative volume colocalization (Vco-loc). This was calculated according to following equation: Vco-loc = (Voxoverlap/Voxtot)/100, in which Voxoverlap is the amount of voxels of object 1 that overlap with object 2, and Voxtot is the total amount of voxels of object 1. Likewise, Vco-loc was determined for CDK12, Hexim1, CyclinT1, and SC35 (Fig. 5).
Immunofluorescent staining and RNA-FISH
For immunofluorescent staining and RNA-FISH, we fixed the cells very mildly using 2% paraformaldehyde containing 0.5% Triton X-100 for 10 min at room temperature. This procedure allowed the mCherry to maintain its fluorescent ability. Immunofluorescent staining of RNAPII-Ser5P and RNAPII-Ser2P (Fig. 4) was performed as described by Schoenfelder et al. (2010b) using specific antibodies against the two active forms of RNAPII, as described by Chapman et al. (2007).
RNA-FISH was performed according to Gribnau et al. (1998) and van de Corput and Grosveld (2001). To detect highly expressed but short genes, we used α-globin- and β-globin-specific oligoprobes (Gribnau et al. 1998) to visualize mRNA in 14-d-post-coitum fetal liver cells isolated from CDK9-mCherry embryos. For the intermediately expressed long gene (114Kb Col4a1 gene), we used specific intron oligo probes located 871 bp from the 5′ end and 1527 bp from the 3′ end of the gene for primary RNA-FISH on MEFs. The gap between the 5′ and 3′ end intron probes was 111 kb (111,099 bp).
Acknowledgments
We thank Alex Maas for blastocyst injections of CDK9-mCherry ES cells and the generation of the mice. We are grateful to Sjaak Philipsen, Raymond Poot, and Niels Galjart for helpful comments. This work was supported by the EuTRACC (European Transcriptome, Regulome, and Cellular Commitment Consortium) and SyBoSS (Systems Biology of Stem Cells and Reprogramming) consortium (EU), the Dutch Academy of Sciences (KNAW [Koninklijke Nederlandse Akademie van Wetenschappen]), NGI (Netherlands Genomics Initiative [CBG {Centraal Bureau voor Genealogie}, Netherlands]), and the Deutsche Forschungsgemeinschaft Sonderforschungsbereiche/Transregio5.
Footnotes
Supplemental material is available for this article.
Article is online at http://www.genesdev.org/cgi/doi/10.1101/gad.216200.113.
References
- Bartkowiak B, Liu P, Phatnani HP, Fuda NJ, Cooper JJ, Price DH, Adelman K, Lis JT, Greenleaf AL 2010. CDK12 is a transcription elongation-associated CTD kinase, the metazoan ortholog of yeast Ctk1. Genes Dev 24: 2303–2316 [DOI] [PMC free article] [PubMed] [Google Scholar]
- Baumli S, Lolli G, Lowe ED, Troiani S, Rusconi L, Bullock AN, Debreczeni JE, Knapp S, Johnson LN 2008. The structure of P-TEFb (CDK9/cyclin T1), its complex with flavopiridol and regulation by phosphorylation. EMBO J 27: 1907–1918 [DOI] [PMC free article] [PubMed] [Google Scholar]
- Brookes E, Pombo A 2009. Modifications of RNA polymerase II are pivotal in regulating gene expression states. EMBO Rep 10: 1213–1219 [DOI] [PMC free article] [PubMed] [Google Scholar]
- Brown JM, Green J, das Neves RP, Wallace HA, Smith AJ, Hughes J, Gray N, Taylor S, Wood WG, Higgs DR, et al. 2008. Association between active genes occurs at nuclear speckles and is modulated by chromatin environment. J Cell Biol 182: 1083–1097 [DOI] [PMC free article] [PubMed] [Google Scholar]
- Chandler D 2005. Interfaces and the driving force of hydrophobic assembly. Nature 437: 640–647 [DOI] [PubMed] [Google Scholar]
- Chao SH, Price DH 2001. Flavopiridol inactivates P-TEFb and blocks most RNA polymerase II transcription in vivo. J Biol Chem 276: 31793–31799 [DOI] [PubMed] [Google Scholar]
- Chapman RD, Heidemann M, Albert TK, Mailhammer R, Flatley A, Meisterernst M, Kremmer E, Eick D 2007. Transcribing RNA polymerase II is phosphorylated at CTD residue serine-7. Science 318: 1780–1782 [DOI] [PubMed] [Google Scholar]
- de Krom M, van de Corput M, von Lindern M, Grosveld F, Strouboulis J 2002. Stochastic patterns in globin gene expression are established prior to transcriptional activation and are clonally inherited. Mol Cell 9: 1319–1326 [DOI] [PubMed] [Google Scholar]
- Eskiw CH, Rapp A, Carter DR, Cook PR 2008. RNA polymerase II activity is located on the surface of protein-rich transcription factories. J Cell Sci 121: 1999–2007 [DOI] [PubMed] [Google Scholar]
- Ferrai C, Xie SQ, Luraghi P, Munari D, Ramirez F, Branco MR, Pombo A, Crippa MP 2010. Poised transcription factories prime silent uPA gene prior to activation. PLoS Biol 8: e1000270. [DOI] [PMC free article] [PubMed] [Google Scholar]
- Fuda NJ, Ardehali MB, Lis JT 2009. Defining mechanisms that regulate RNA polymerase II transcription in vivo. Nature 461: 186–192 [DOI] [PMC free article] [PubMed] [Google Scholar]
- Glover-Cutter K, Larochelle S, Erickson B, Zhang C, Shokat K, Fisher RP, Bentley DL 2009. TFIIH-associated Cdk7 kinase functions in phosphorylation of C-terminal domain Ser7 residues, promoter-proximal pausing, and termination by RNA polymerase II. Mol Cell Biol 29: 5455–5464 [DOI] [PMC free article] [PubMed] [Google Scholar]
- Gribnau J, de Boer E, Trimborn T, Wijgerde M, Milot E, Grosveld F, Fraser P 1998. Chromatin interaction mechanism of transcriptional control in vivo. EMBO J 17: 6020–6027 [DOI] [PMC free article] [PubMed] [Google Scholar]
- Herrmann CH, Mancini MA 2001. The Cdk9 and cyclin T subunits of TAK/P-TEFb localize to splicing factor-rich nuclear speckle regions. J Cell Sci 114: 1491–1503 [DOI] [PubMed] [Google Scholar]
- Iborra FJ, Pombo A, Jackson DA, Cook PR 1996a. Active RNA polymerases are localized within discrete transcription ‘factories’ in human nuclei. J Cell Sci 109: 1427–1436 [DOI] [PubMed] [Google Scholar]
- Iborra FJ, Pombo A, McManus J, Jackson DA, Cook PR 1996b. The topology of transcription by immobilized polymerases. Exp Cell Res 229: 167–173 [DOI] [PubMed] [Google Scholar]
- Jackson DA, Cook PR 1985. Transcription occurs at a nucleoskeleton. EMBO J 4: 919–925 [DOI] [PMC free article] [PubMed] [Google Scholar]
- Jackson DA, Hassan AB, Errington RJ, Cook PR 1993. Visualization of focal sites of transcription within human nuclei. EMBO J 12: 1059–1065 [DOI] [PMC free article] [PubMed] [Google Scholar]
- Kimura H, Tao Y, Roeder RG, Cook PR 1999. Quantitation of RNA polymerase II and its transcription factors in an HeLa cell: Little soluble holoenzyme but significant amounts of polymerases attached to the nuclear substructure. Mol Cell Biol 19: 5383–5392 [DOI] [PMC free article] [PubMed] [Google Scholar]
- Kohoutek J, Blazek D 2012. Cyclin K goes with Cdk12 and Cdk13. Cell Div 7: 12. [DOI] [PMC free article] [PubMed] [Google Scholar]
- Komarnitsky P, Cho EJ, Buratowski S 2000. Different phosphorylated forms of RNA polymerase II and associated mRNA processing factors during transcription. Genes Dev 14: 2452–2460 [DOI] [PMC free article] [PubMed] [Google Scholar]
- Langmead B, Trapnell C, Pop M, Salzberg SL 2009. Ultrafast and memory-efficient alignment of short DNA sequences to the human genome. Genome Biol 10: R25. [DOI] [PMC free article] [PubMed] [Google Scholar]
- Larochelle S, Amat R, Glover-Cutter K, Sanso M, Zhang C, Allen JJ, Shokat KM, Bentley DL, Fisher RP 2012. Cyclin-dependent kinase control of the initiation-to-elongation switch of RNA polymerase II. Nat Struct Mol Biol 19: 1108–1115 [DOI] [PMC free article] [PubMed] [Google Scholar]
- Marenduzzo D, Finan K, Cook PR 2006. The depletion attraction: An underappreciated force driving cellular organization. J Cell Biol 175: 681–686 [DOI] [PMC free article] [PubMed] [Google Scholar]
- Marshall NF, Peng J, Xie Z, Price DH 1996. Control of RNA polymerase II elongation potential by a novel carboxyl-terminal domain kinase. J Biol Chem 271: 27176–27183 [DOI] [PubMed] [Google Scholar]
- Michels AA, Fraldi A, Li Q, Adamson TE, Bonnet F, Nguyen VT, Sedore SC, Price JP, Price DH, Lania L, et al. 2004. Binding of the 7SK snRNA turns the HEXIM1 protein into a P-TEFb (CDK9/cyclin T) inhibitor. EMBO J 23: 2608–2619 [DOI] [PMC free article] [PubMed] [Google Scholar]
- Minton AP 2006. How can biochemical reactions within cells differ from those in test tubes? J Cell Sci 119: 2863–2869 [DOI] [PubMed] [Google Scholar]
- Misteli T 2001. The concept of self-organization in cellular architecture. J Cell Biol 155: 181–185 [DOI] [PMC free article] [PubMed] [Google Scholar]
- Mitchell JA, Fraser P 2008. Transcription factories are nuclear subcompartments that remain in the absence of transcription. Genes Dev 22: 20–25 [DOI] [PMC free article] [PubMed] [Google Scholar]
- Morgan M, Anders S, Lawrence M, Aboyoun P, Pages H, Gentleman R 2009. ShortRead: A bioconductor package for input, quality assessment and exploration of high-throughput sequence data. Bioinformatics 25: 2607–2608 [DOI] [PMC free article] [PubMed] [Google Scholar]
- Nechaev S, Adelman K 2011. Pol II waiting in the starting gates: Regulating the transition from transcription initiation into productive elongation. Biochim Biophys Acta 1809: 34–45 [DOI] [PMC free article] [PubMed] [Google Scholar]
- Noordermeer D, de Wit E, Klous P, van de Werken H, Simonis M, Lopez-Jones M, Eussen B, de Klein A, Singer RH, de Laat W 2011. Variegated gene expression caused by cell-specific long-range DNA interactions. Nat Cell Biol 13: 944–951 [DOI] [PMC free article] [PubMed] [Google Scholar]
- Osborne CS, Chakalova L, Brown KE, Carter D, Horton A, Debrand E, Goyenechea B, Mitchell JA, Lopes S, Reik W, et al. 2004. Active genes dynamically colocalize to shared sites of ongoing transcription. Nat Genet 36: 1065–1071 [DOI] [PubMed] [Google Scholar]
- Osborne CS, Chakalova L, Mitchell JA, Horton A, Wood AL, Bolland DJ, Corcoran AE, Fraser P 2007. Myc dynamically and preferentially relocates to a transcription factory occupied by Igh. PLoS Biol 5: e192. [DOI] [PMC free article] [PubMed] [Google Scholar]
- Papantonis A, Larkin JD, Wada Y, Ohta Y, Ihara S, Kodama T, Cook PR 2010. Active RNA polymerases: Mobile or immobile molecular machines? PLoS Biol 8: e1000419. [DOI] [PMC free article] [PubMed] [Google Scholar]
- Peterlin BM, Price DH 2006. Controlling the elongation phase of transcription with P-TEFb. Mol Cell 23: 297–305 [DOI] [PubMed] [Google Scholar]
- Ragoczy T, Bender MA, Telling A, Byron R, Groudine M 2006. The locus control region is required for association of the murine β-globin locus with engaged transcription factories during erythroid maturation. Genes Dev 20: 1447–1457 [DOI] [PMC free article] [PubMed] [Google Scholar]
- Rahl PB, Lin CY, Seila AC, Flynn RA, McCuine S, Burge CB, Sharp PA, Young RA 2010. c-Myc regulates transcriptional pause release. Cell 141: 432–445 [DOI] [PMC free article] [PubMed] [Google Scholar]
- Rippe K 2007. Dynamic organization of the cell nucleus. Curr Opin Genet Dev 17: 373–380 [DOI] [PubMed] [Google Scholar]
- Rozowsky J, Euskirchen G, Auerbach RK, Zhang ZD, Gibson T, Bjornson R, Carriero N, Snyder M, Gerstein MB 2009. PeakSeq enables systematic scoring of ChIP-seq experiments relative to controls. Nat Biotechnol 27: 66–75 [DOI] [PMC free article] [PubMed] [Google Scholar]
- Schoenfelder S, Clay I, Fraser P 2010a. The transcriptional interactome: Gene expression in 3D. Curr Opin Genet Dev 20: 127–133 [DOI] [PubMed] [Google Scholar]
- Schoenfelder S, Sexton T, Chakalova L, Cope NF, Horton A, Andrews S, Kurukuti S, Mitchell JA, Umlauf D, Dimitrova DS, et al. 2010b. Preferential associations between co-regulated genes reveal a transcriptional interactome in erythroid cells. Nat Genet 42: 53–61 [DOI] [PMC free article] [PubMed] [Google Scholar]
- Soler E, Andrieu-Soler C, de Boer E, Bryne JC, Thongjuea S, Stadhouders R, Palstra RJ, Stevens M, Kockx C, van Ijcken W, et al. 2010. The genome-wide dynamics of the binding of Ldb1 complexes during erythroid differentiation. Genes Dev 24: 277–289 [DOI] [PMC free article] [PubMed] [Google Scholar]
- Soler E, Andrieu-Soler C, Boer E, Bryne JC, Thongjuea S, Rijkers E, Demmers J, Ijcken W, Grosveld F 2011. A systems approach to analyze transcription factors in mammalian cells. Methods 53: 151–162 [DOI] [PubMed] [Google Scholar]
- Spector DL, Lamond AI 2011. Nuclear speckles. Cold Spring Harb Perspect Biol 3: a000646. [DOI] [PMC free article] [PubMed] [Google Scholar]
- Stadhouders R, Thongjuea S, Andrieu-Soler C, Palstra RJ, Bryne JC, van den Heuvel A, Stevens M, de Boer E, Kockx C, van der Sloot A, et al. 2012. Dynamic long-range chromatin interactions control Myb proto-oncogene transcription during erythroid development. EMBO J 31: 986–999 [DOI] [PMC free article] [PubMed] [Google Scholar]
- Tan-Wong SM, Zaugg JB, Camblong J, Xu Z, Zhang DW, Mischo HE, Ansari AZ, Luscombe NM, Steinmetz LM, Proudfoot NJ 2012. Gene loops enhance transcriptional directionality. Science 338: 671–675 [DOI] [PMC free article] [PubMed] [Google Scholar]
- van de Corput MP, Grosveld FG 2001. Fluorescence in situ hybridization analysis of transcript dynamics in cells. Methods 25: 111–118 [DOI] [PubMed] [Google Scholar]
- Wansink DG, Schul W, van der Kraan I, van Steensel B, van Driel R, de Jong L 1993. Fluorescent labeling of nascent RNA reveals transcription by RNA polymerase II in domains scattered throughout the nucleus. J Cell Biol 122: 283–293 [DOI] [PMC free article] [PubMed] [Google Scholar]
- Yamada T, Yamaguchi Y, Inukai N, Okamoto S, Mura T, Handa H 2006. P-TEFb-mediated phosphorylation of hSpt5 C-terminal repeats is critical for processive transcription elongation. Mol Cell 21: 227–237 [DOI] [PubMed] [Google Scholar]
- Yik JH, Chen R, Nishimura R, Jennings JL, Link AJ, Zhou Q 2003. Inhibition of P-TEFb (CDK9/Cyclin T) kinase and RNA polymerase II transcription by the coordinated actions of HEXIM1 and 7SK snRNA. Mol Cell 12: 971–982 [DOI] [PubMed] [Google Scholar]