

Synopsis
This article reviews current magnetic resonance imaging techniques for imaging the lower extremity, focusing on imaging of the knee, ankle, and hip joints. Recent advancements in MRI include imaging at 7 Tesla, using multiple receiver channels, T2* imaging, and metal suppression techniques, allowing more detailed visualization of complex anatomy, evaluation of morphological changes within articular cartilage, and imaging around orthopedic hardware.
Keywords: Magnetic resonance imaging, lower extremity, cartilage, joints
Introduction
Imaging of the lower extremity provides important information about musculoskeletal tissues in both the healthy and disease states. The hip, knee, and ankle joints are frequently subjected to both acute traumatic injuries and chronic debilitating diseases such as rheumatoid arthritis or osteoarthritis (OA). The identification and evaluation of these structures is crucial for treating patients with musculoskeletal pathology; in the United States alone, over 27 million Americans are affected by OA. Arthroscopy is regarded as the gold standard for joint assessment, permitting direct visualization of intra-articular structures. However, arthroscopy is invasive, and requires a surgical procedure, therefore it is typically reserved for confirmation of the cross-sectional imaging diagnosis, and treatment of the underlying pathology. Imaging of a joint may also be performed following arthroscopy if symptoms fail to improve or recur.
MRI
MRI is perhaps the most promising imaging modality for evaluation of the lower extremity, as it provides detailed anatomic visualization of the joint, but is non-invasive and does not require the use of radiation. Therefore, this article will focus on advanced MRI techniques used to evaluate the lower extremity, particularly with regard to imaging of joints. Many studies have documented the strong correlation between arthroscopy and MR imaging of the knee (1), hip (2,3), and ankle (Figure 1). These studies encourage the use of MRI as a non-invasive means of assessing the musculoskeletal system.
Figure 1.

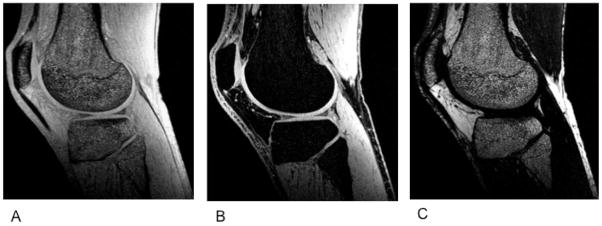
Arthroscopy remains the gold standard for direct imaging of the joint but has been well correlated with non-invasive MRI techniques. Figure 1 depicts a cartilage defect before (A) and after (B) osteochondral allograft transplant using a sagittal intermediate-weighted proton density (PD) MRI. The femoral articular cartilage is frayed and textured (arrows) before the allograft procedure (C). Post-operatively, normal and uniform cartilage morphology (arrows) is largely restored (D).
Conventional MRI
Common MRI methods include 2D or multi-slice T1-weighted, proton density (PD), and T2-weighted imaging (4). Spin echo (SE) and fast-spin echo (FSE) imaging techniques are useful in the evaluation of focal cartilage defects. Recent improvements in hardware, software, gradients, and radiofrequency (RF) coils have led to the use of fast or turbo-spin echo imaging (TSE), fat saturation and water excitation (4) to improve tissue contrast.
Advanced Tissue-Specific MRI Techniques
The soft tissues of the lower extremity include bone, tendons, ligaments, articular cartilage, fibrocartilage, and synovium. Each of these tissues can be visualized using MRI, but optimal visualization and evaluation requires careful attention to technique.
Bone
Radiography and CT scanning remain the imaging modalities of choice for evaluation of cortical bone. However, MRI plays a crucial role in the evaluation of musculoskeletal tumors and bone marrow composition in oncology patients. MRI is increasingly being used to detect subtle changes in subchondral bone composition in early OA. Features such as bone marrow edema-like lesions (BMLs), subchondral cyst-like lesions, and subchondral bone attrition are indicative of disease progression (5, 6). These types of cancellous bone abnormalities are best visualized on MRI using PD-weighted, intermediate-weighted, T2-weighted, or short tau inversion recovery and are seen as hypointense regions on T1-weighted SE images (7 – 10).
Qualitative and quantitative MR assessment of cortical bone is now possible using ultrashort echo time (uTE) imaging. A variety of different approaches have been employed, including basic uTE sequences with TEs as low as 8 us, adiabatic inversion recovery prepared UTE sequences (IR-UTE), and saturation recovery UTE sequences (11) (Figure 2).
Figure 2.
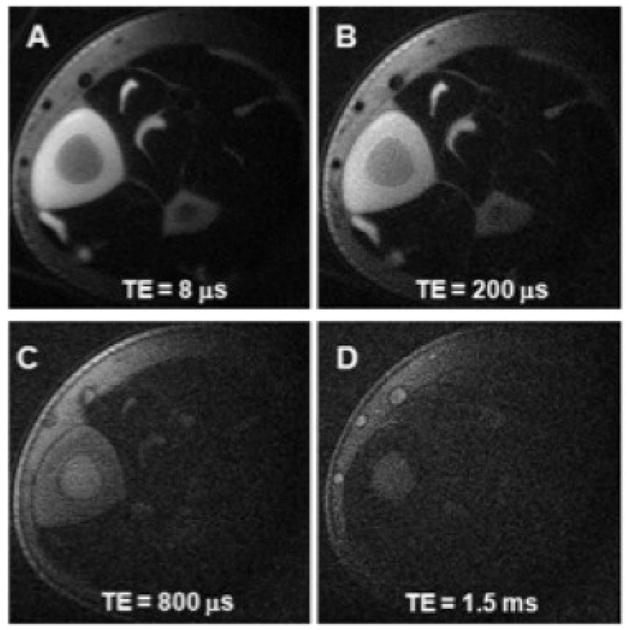
Ultrashort echo time (uTE) imaging can enhance visualization of cortical bone. Axial images depict the mid-diaphyseal tibia of a 31 year old healthy volunteer with TE delays of 8 μs, 200 μs, 800 μs, and 1.5 ms. The tibial cortex demonstrates high signal intensity at ultrashort echo times of 8 μs and μ 200 us. Image credit: Du et al., Journal of Magnetic Resonance, 2010.
Muscle
Muscle is well vascularized and has the ability to repair itself, so it is rarely imaged with the idea of surgical intervention in mind. MRI can provide a detailed depiction of skeletal musculature, and is useful in the detection of muscle pathology. Muscle typically demonstrates intermediate T1 and T2 relaxation times similar to articular cartilage. Acute muscle strains with edema manifest as high signal on T2-weighted images. Occasionally there may also be corresponding high signal on T1-weighted images, reflecting hemorrhage. Muscle atrophy often occurs in chronic disease, and may be seen as decreased muscle bulk or fatty replacement of muscle tissue. T2 mapping (12) and assessment of the apparent diffusion coefficient (ADC) may also be useful in the evaluation of muscle function and activity (Figure 3).
Figure 3.
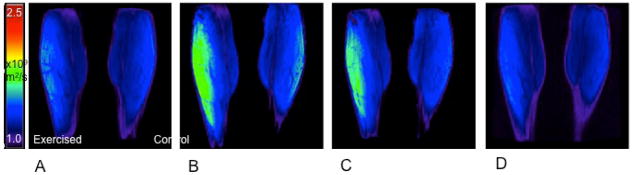
Apparent diffusion coefficient (ADC) mapping of gastrocnemius muscle using a quantitative dual echo steady state (qDESS) technique. Coronal images acquired pre-exercise (A) and immediately post-exercise (B), and at 8 minutes (C), and 16 minutes post-exercise (D) depict a transient increase in muscle diffusion in the exercised calf. Image courtesy of Lauren Shapiro, Stanford University School of Medicine.
Tendons and Ligaments
Tendons connect bone to muscle, and facilitate joint motion by transmitting large forces from muscle to bone. Ligaments connect bone to bone, thus guiding joint motion and maintaining stability. Both fibrous tissues are composed of dense, parallel collagen fibers. The ordered collagen structure and the high concentration of both free and bound water in these tissues afford unique imaging properties, particularly with regard to MRI.
Because of their highly ordered collagen structures, tendons and ligaments are characterized on MRI by short T2 relaxation times. Imaging techniques such as uTE are therefore necessary to shorten the TE and acquire visible signal in tissues of interest. Compared with conventional MRI, uTE utilizes TEs 20–50 times shorter in length (13 – 15) and measures free induction decay (FID) as soon as possible after the RF pulse. One approach to uTE utilizes half sinc pulses, nonselective pulses, selective pulses, and discrete pulses, and acquires readouts in radial or spiral methods (16). Two-dimensional acquisitions obtain a single slice or multiple slices with in-plane resolutions ranging from 0.5–0.8 mm; 3D acquisitions obtain isotropic resolutions of 0.28–0.9 mm.
In the knee, uTE has permitted evaluation of the anterior cruciate ligament (ACL), posterior cruciate ligament (PCL), lateral collateral ligament, and patellar tendon. In 2009, Rahmer et al. described the potential of uTE for assessing tissue grafts in ACL reconstruction (17). Imaging of graft material and the graft-implant interface was markedly improved in uTE images compared with conventional 3D-GRE and T1-weighted TSE images obtained at 1.5T (Figure 4). More recently, Qian et al. demonstrated the technical feasibility of imaging the human knee using uTE imaging (0.28–0.14 mm) with the acquisition-weighted stack of spirals (AWSOS) sequence at 3.0T (18). In the ACL and PCL, the ligaments appeared hyperintense, with clinically visible bundles and entheses. Similarly, the patellar tendon showed collagen bundle hyperintensity; however, it was also subject to the magic angle effect resulting from the orientation of the collagen bundles with respect to the main magnetic field.
Figure 4.
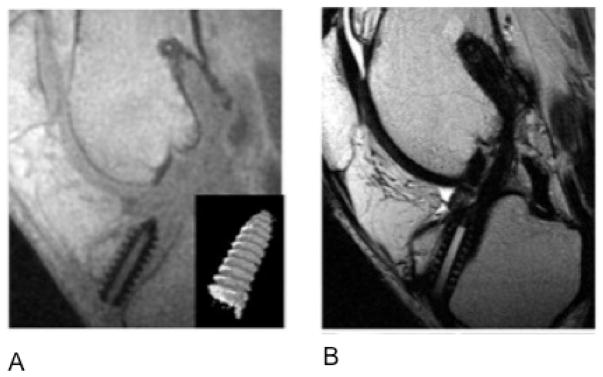
(A) Ultrashort echo time imaging (TR/TE: 8.6/0.06 msec) improves visualization of the anterior cruciate ligament graft interference screw compared with (B) standard T1-weighted turbo spin echo images (TR/TE: 500/21 ms). Image credit: Rahmer et al., JMRI, 2009.
In the ankle, uTE is frequently used to improve visualization of the Achilles tendon. Du et al. utilized a uTE T1rho sequence and obtained images of the Achilles tendon in healthy subjects at 3.0T (11). Compared with the 3D MAPSS sequence, the UTE T1rho scan improved signal and spatial resolution and signal-to-noise ratio (SNR) in the Achilles tendon (Figure 5). Additional investigations have used a combination of uTE and pointwise encoding time reduction with radial acquisition (PETRA) (19) or magnetization transfer (20) to image the Achilles tendon in vivo.
Figure 5.
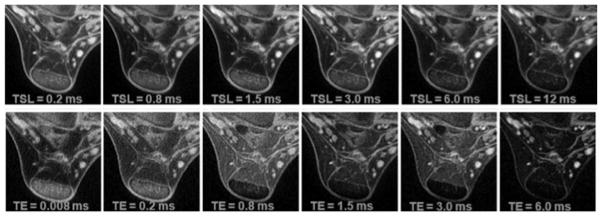
Ultrashort echo time (UTE) T1rho images of an Achilles tendon specimen using a spin-lock field of 250 show less loss of signal with increasing spin-lock times (TSL) (top row) compared with T2* imaging with increasing echo times (TE) (bottom row). Image credit: Du, 2010, MRM.
Fibrocartilage
Knee- Menisci
Despite the short T2 relaxation times in the menisci, MRI is quite sensitive for meniscal tears, since tears appear of intermediate or high signal against the low signal background of the meniscus. The sagittal plane is most frequently used to evaluate meniscal pathology, but recent studies have shown that imaging in the coronal (21, 22) or axial planes (23, 24) may improve diagnosis of specific tear types. A variety of sequences can be used for diagnostic imaging, but TEs must remain short in order to reduce scan time, improve SNR, acquire more slices per scan, and decrease susceptibility and artifact (25). Commonly used sequences include PD-weighted SE or FSE with or without fat saturation, T1-weighting, and gradient echoes (GRE) (25). PD-weighted imaging is ideal for diagnostic imaging of the menisci because it has a short TE and optimizes SNR (16). The addition of fat saturation to PD sequences is increasingly common in clinical practice (25, 27). In 2005, Blackmon et al. reported 93% sensitivity and 97% specificity for diagnosing meniscal tears using a fat-saturated conventional SE PD–weighted sequence (28).
Recent advancements in MRI have improved structural visualization of the intact meniscus. Higher field strengths (1.5 and 3.0T) improve SNR while maintaining comparable sensitivity and specificity (21, 29, 30). Parallel imaging methods use multiple channels to extend the imaging field of view without increasing scan time by exploiting the spatially-varying sensitivity profiles of the phased array coil elements. These techniques have been shown to reduce scan time by nearly 50% (31), while retaining diagnostic sensitivity, specificity, and accuracy (32). As is the case with tendons and ligaments, UTE imaging has also significantly improved MR imaging of the menisci. In particular, UTE imaging sequences permit identification of different zones within the meniscus.
In addition to structural assessment, quantitative MRI techniques such as T2 and T1rho mapping have been recently used to evaluate the physiology of the meniscus. Son et al. evaluated the spatial distribution of T2 and T1rho relaxation times, and correlated these findings with biochemical, histological, and biomechanical analyses of cadaveric meniscus specimens. The authors found that T1rho and T2 relaxation times varied significantly across meniscal regions and that both T1rho and T2 correlated significantly with each other and with the tissue water content (33).
Hip- Labrum
Femoracetabular impingement has been increasingly implicated in the development of early hip OA in young patients (34 – 36). Surgical repair or debridement of the labrum can halt these disease processes, but detection of early tissue pathology is essential. Imaging of the acetabular labrum usually consists of MR arthrography using 2D fat-saturated T1-weighted FSE sequences.
Non-contrast MRI with 2D FSE and 3D SPGR sequences, and the combination of 3D sequences and arthrography has been employed for imaging of the labrum. However, no studies to date have directly compared 3D sequences with arthrography to standard 2D fat-saturated T1-weighted FSE imaging of the labrum.
Articular Cartilage
Knee
The bulk of current literature focuses on the assessment of articular cartilage in the knee. MRI provides exquisite contrast, and enables both morphologic and physiologic imaging of articular cartilage. The most commonly used MRI techniques in morphological imaging of cartilage include spin-echo (SE) and gradient-recalled echo (GRE) sequences, 2D fast spin echo (FSE), and 3D FSE and GRE. Physiological imaging techniques such as T2 mapping, delayed gadolinium enhanced MR imaging of cartilage (dGEMRIC), T1rho mapping, sodium MRI, and diffusion-weighted imaging (DWI) provide insight into the molecular composition of the tissue.
Knee- Morphology
Information about tissue structure can be acquired using morphological assessment of cartilage. Many techniques enable imaging of fraying, fissuring, and focal or diffuse cartilage loss. Three-dimension spoiled gradient recalled echo imaging with fat suppression (3D-SPGR) is the current standard for morphological imaging of cartilage (37, 38). In 3D-SPGR, contrast similar to T1-weighted sequences is obtained by spoiling the transverse steady state with semi-random RF phase alterations. SPGR acquires nearly isotropic voxels, yielding high-resolution images with high cartilage signal and low signal from adjacent joint fluid (Figure 6). Driven equilibrium Fourier transform (DEFT), is another high quality imaging technique. Instead of using T1-weighted contrast, DEFT imaging generates contrast by exploiting the T2/T1 ratio of tissues. DEFT returns magnetization to the z-axis with a 90-degree pulse that results in enhanced signal in tissues with long T1 relaxation times. In cartilage imaging, DEFT increases synovial fluid signal and preserves cartilage signal, resulting in bright synovial fluid at a short repetition time (TR), high cartilage SNR, and improved imaging of the full cartilage thickness (39) (Figure 7). Similarly, 3D dual-echo steady-state (DESS) imaging results in high signal intensity in both cartilage and synovial fluid, which enables morphological assessment of cartilage. 3D-DESS acquires two or more gradient echoes, separates each pair of echoes with a refocusing pulse, and combines image data to obtain higher T2* weighting. 3D-DESS has been validated for clinical use (40, 41) and affords advantages such as high SNR, high cartilage-to-fluid contrast, near-isotropic sections, and reduced scan time when compared to 3D-SPGR (Figure 8). This is the sequence of choice for the Osteoarthritis Initiative (42).
Figure 6.
Sagittal IDEAL-SPGR images obtained from a healthy, 36-year old male. IDEAL-SPGR acquisition can generate combined water-fat (A), water only (B), and fat only (C) images. Image credit: Siepmann DB et al. AJR 2007;189:1510–1515.
Figure 7.
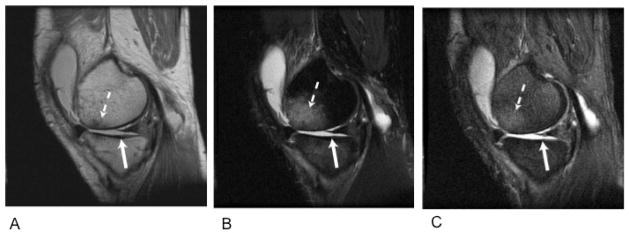
Sagittal images acquired with proton density weighting (A), T2 weighting (B), and 3D-DEFT (C) from the knee of a patient with a full thickness cartilage defect in the medial femoral condyle (dashed arrow). The DEFT images (C) allow superior visualization of the defect and adjacent tibial cartilage (solid arrow). Image credit: Gold et al., JMRI 2005, 21: 476–481.
Figure 8.
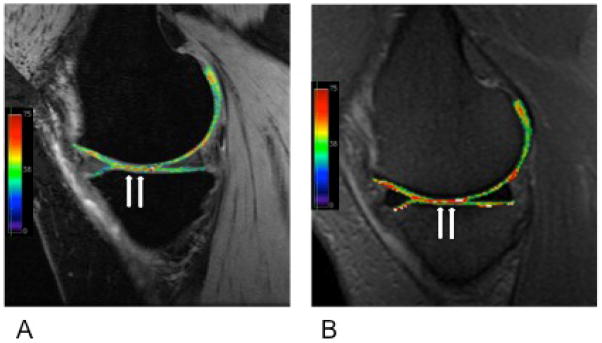
T2 maps overlaid on quantitative DESS (A) and 2D-FSE (B) sagittal images of the medial compartment in a patient with osteoarthritis. Arrows indicate regions of elevated T2 signal. qDESS imaging affords higher resolution and shorter scan times versus 2D-FSE acquisitions.
Another group of methods with synovial fluid-cartilage contrast is steady-state free precession (SSFP) MRI techniques. Balanced steady-state free precession (bSSFP) is otherwise known as true fast imaging with steady-state precession (true FISP), fast imaging employing steady-state acquisition (FIESTA), and balanced fast field echo imaging. In all of these techniques, fluid is depicted with increased signal, while cartilage signal intensity is preserved, resulting in excellent contrast and diagnostic utility. Several derivatives of SSFP exist. Fluctuating equilibrium MR (FEMR) is used for morphological assessment of cartilage of the knee (43). FEMR generates contrast based on the ratio of T1/T2 in tissues. In the knee, FEMR produces bright synovial fluid signal and high signal in cartilage while maintaining high SNR. Another SSFP derivative, Vastly undersampled Isotropic Projection (VIPR) imaging, combines bSSFP imaging with 3D radial k-space acquisition using isotropic spatial resolution and T2/T1 weighted contrast (44) VIPR reduces banding artifacts, obtains high SNR and tissue contrast, and afford short acquisition times (44) (Figure 9). Finally, 3D-FSE techniques obtain isotropic images with PD or T2-weighted contrast. 3D FSE (Cube by GE Healthcare, VISTA by Philips, and SPACE by Siemens) utilizes a restore pulse and variable-flip-angle RF pulses applied along an echo train to produce a pseudo steady state. 3D-FSE has demonstrated improved SNR and better SNR efficiency (45 – 47).
Figure 9.
Sagittal images of a knee with cartilage lesions on the medial femoral condyle (arrows) obtained using routine 2D-FSE sequence (A) and 3D-VIPR (B), an SSFP sequence derivative. VIPR obtains images with greater SNR and tissue contrast and utilizes shorter scan times. Image credit: Kijowski. Radiology 2009; 251:185–194.
Knee- Cartilage Physiology
MR technology has evolved to enable quantitative assessment of articular cartilage physiology. These developments have been useful in identifying early damage and breakdown in conditions such as OA, where proteoglycan and collagen content are reduced (48). This disrupts the collagen network and results in increased water content and matrix degradation. Newer methods of MRI exploit these macromolecule changes to provide a quantitative understanding of the breakdown process.
In cartilage, changes in T2 are dependent upon the quantity of water and the integrity of the proteoglycan-collagen matrix. By measuring the spatial distribution of T2 relaxation times throughout articular cartilage, areas of increased or decreased water content (which generally correlate with cartilage damage) can be identified. Generally, a multi-echo spin-echo is used to shorten scan time and signal levels are fitted to one or more decaying exponentials, depending upon whether more than one T2 distribution is anticipated in the tissue (49). T2 mapping software is currently commercially available, allowing for simple implementation on most imaging systems (Figure 10).
Figure 10.

T2 mapping in the articular cartilage of the medial femur in a patient with moderate osteoarthritis. The T2 relaxation time is elevated in the weight-bearing region of the medial femoral condyle (arrows).
T1rho mapping is sensitive to the macromolecule content of tissue and is therefore effective in visualizing early changes in OA (50, 51). In T1rho, magnetization is tipped into the transverse plane and “spin-locked” by a constant RF field. When proteoglycan depletion occurs in articular cartilage, physical and chemical interactions in the macromolecule environment are disrupted. T1rho allows measurement of the interaction between motion-restricted water molecules and their extracellular environment (52). Elevated T1rho relaxation times have been measured in osteoarthritic knee cartilage compared to normal cartilage (53 – 55).
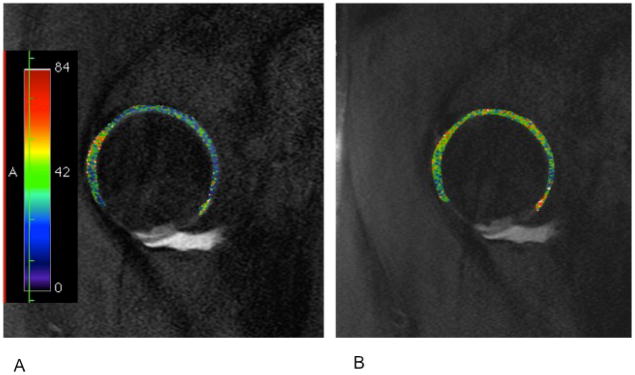
Sodium MRI is based on the concept of negative fixed charged density within the extracellular matrix of cartilage. In healthy cartilage, high concentrations of positively charged 23Na are associated with the negatively charged glycosaminoglycan (GAG) side chains, which contain negatively charged carboxyl and sulfate groups. When proteoglycan depletion occurs in cartilage breakdown, GAGs are damaged and sodium signals decline (51, 56, 57) (Figure 11). 23Na imaging, therefore, represents a potentially useful means of differentiating early stage degenerate cartilage and normal tissue (56).
Figure 11.

Sodium maps of articular cartilage in a healthy volunteer (A) and a patient with OA (B) overlaid onto proton images. The increased sodium signal in figure 5A correlates with higher glycosaminoglycan (GAG) concentration. Braun et al. Imaging Med. 2011 Oct;3(5):541–555.
Delayed Gadolinium-Enhanced MRI of Cartilage (dGEMRIC), like sodium imaging, also relies on the principle of fixed charge density. Ions in the extracellular fluid are distributed in relation to the concentration of negatively charged GAGs, which is a reflection of the quantity of proteoglycan content in cartilage. The negatively charged Gd(DTPA)2− molecules accumulate in high concentration in areas lacking in GAG, and in low concentrations in GAG-rich regions. Subsequent imaging using 3D SPGR pulse sequences with variable flip angles (58), bSSFP, or T1 generates a GAG distribution. This T1 measurement is referred to as the dGEMRIC index. Regions with low T1 signal correspond to a low dGEMRIC index, which indicates high Gd(DTPA)2− penetration and greater GAG depletion (Figure 12).
Figure 12.
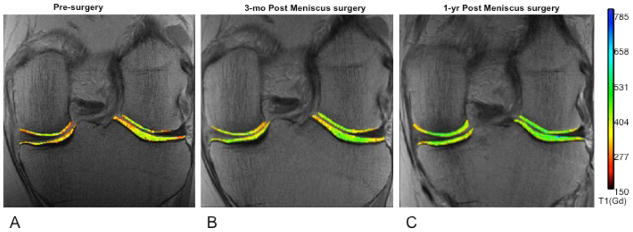
Images of the menisci pre-surgery (A) and at two follow-up time points (B,C). Delayed gadolinium enhanced MRI of cartilage (dGEMRIC) imaging permits quantitative assessment of cartilage integrity, which appears to improve following surgical intervention. Braun et al. Imaging Med. 2011 Oct;3(5):541–555.
Hip Cartilage
Imaging of the articular cartilage in the hip is less straightforward than the knee because of the spherical geometry of the femoral head and acetabulum, and the thinner cartilage layer (59). A 2008 study by Carbadillo-Gamio et al. reported the use of a water excitation SPGR sequence for evaluating the articular cartilage of the hip joint at 3.0T. 2D and 3D MR arthrography have also been compared in the imaging of articular cartilage of the hip. In 2004, Knuesel et al. evaluated the ability of a sagittal water excitation DESS sequence, and a sagittal fat-saturated T1-weighted FSE sequence to detect surgically confirmed cartilage lesions at 1.5T. The DESS sequence had significant lesion conspicuity, but both sequences were found to have similar sensitivity and specificity for lesion detection (60). More recently in 2009, Ullrick et al. conducted a similar study at 3.0T comparing an IDEAL-SPGR sequence with a multiplanar, fat-saturated T1-weighted FSE sequence. IDEAL-SPGR had significantly greater sensitivity but significantly lower specificity and accuracy than T1-weighted FSE sequences for cartilage detection (61). Three-dimensional sequences allow higher in-plane spatial resolution, and may improve detection of articular chondropathies due to decreased slice thickness.
Similar to the knee, although less widespread, methods of cartilage evaluation such as dGEMRIC, T2 mapping and T1p mapping have been used to quantify physiologic changes in the articular cartilage of the hip (62 (Figure 13).
Figure 13.
T2 (A) and T1 rho (B) mapping of the articular cartilage of the hip. Images taken from a patient with a tear of the anterior labrum and pincer femoracetabular impingement. Images courtesy of Stephen Matzat, Stanford University.
Ankle Cartilage
Unlike the hip and the knee, the articular cartilage of the ankle is less often involved in primary OA but more frequently undergoes changes as a result of post-traumatic tissue damage (63). The incongruent surfaces of the tibia and talar dome complicate the detection of cartilage lesions (64, 65), but the thin continuous slices and high resolution characteristics of 3D sequences make these techniques attractive for the imaging of the articular cartilage in the ankle.
Bauer et al. compared 2D fat-saturated intermediate-weighted FSE, fat-saturated SPGR, and fat-saturated FIESTA sequences for the detection of artificial chondral defects in human cadaver joints at both 1.5 and 3.0T. Overall, the 3D sequences demonstrated lower diagnostic performance at both field strengths (64). However, two studies have suggested that 3D isotropic imaging may prove useful in the imaging of ankle cartilage morphology. Welsch et al. recently used a water excitation true-FISP sequence with 0.3 mm isotropic resolution to image ankle cartilage at 3.0T and observed sustained image quality with the use of this balanced SSFP sequence (66). Stevens et al. also established that an isotropic resolution intermediate-weighted FSE-Cube sequence demonstrated significantly higher SNR efficiency in cartilage, synovial fluid, and muscle compared with a 2D-FSE sequence (46). These recent findings suggest that 3D FSE sequences may aid the detection of joint pathology in this complex anatomic region.
Quantitative assessment of ankle articular cartilage physiology in the ankle through mapping methods such as dGEMRIC, T2, and T1rho is possible but technically challenging, as the talar and tibial cartilage can often be difficult to separate (63).
Synovium
The synovial membrane is a thin, connective tissue lining the inside of fibrous joint capsules. It is composed of an intimal layer 1–3 cells thick, consisting of macrophage-like (Type A) and fibroblast-like (Type B) synoviocytes, and a subintimal layer consisting of nerve endings, vasculature, and lymphatics. The role of healthy synovium is to lubricate the joint and nourish the articular cartilage. However, inflammation of the synovium (synovitis), has been implicated in many joint pathologies including rheumatoid arthritis, hemophilic arthropathy, and OA. Because the synovium is a potent source of degradative enzymes, pro-inflammatory mediators, and angiogenic growth factors, improving the visualization and characterization of this tissue may lead to important insights in disease initiation and progression. The synovium is typically imaged using ultrasound (US) or MRI.
In the knee, the most commonly imaged sites of synovial hypertrophy are the suprapatellar pouch and the medial and lateral recesses (67). Current US technology acquires images with wide fields of view using high-resolution probes operating at frequencies of up to 20 MHz (68). This has allowed the detection of synovial pathologies including hypertrophy, vascularity, and presence of synovial fluid (68, 69) and the detection of synovitis in joints that appear otherwise clinically quiescent (68). Doppler techniques allow an indirect evaluation of inflammatory activity via the assessment of vascularity (70, 71). Recently, contrast enhanced (CE)-US has been proposed as a novel technique aimed at quantifying synovial vascularization (67). CE-US showed higher sensitivity (95%) in imaging synovitis than CE-MRI (82%), power Doppler US (64%) or grayscale US (58%) (67).
MRI is also used for assessment of the synovium. Unlike US, MRI is able to visualize synovium located deep within joints such as the hip without being obscured by bony structures. The two primary methods for MR detection of synovitis are the use of non-CE MRI and gadolinium (Gd)-based CE-MRI. Synovitis was first correlated with hypointense signal alterations in Hoffa’s fat pad on sagittal, non-CE T1 weighted SE images (72). Since then, hyperintense signal changes in Hoffa’s fat pad on fat-suppressed PD or T2-weighted SE sequences have been suggested as surrogate markers for joint-wide synovitis (73, 74).
Non-CE MRI has been a common and effective tool for imaging of synovitis, but CE-MRI generally improves tissue visualization. Alhough the administration of intravenous gadolinium is suboptimal, CE-MRI more clearly differentiates inflamed synovium from joint effusion. In CE-MRI, synovium with inflammatory activity is enhanced while effusion remains hypointense; on non-CE MRI, both synovium and effusion are often depicted as signal hyperintensity. Recent studies have shown that signal changes in Hoffa’s fat pad on non-CE MRI were less specific for peripatellar synovitis than CE sequences (75), and that microscopic synovitis is not correlated with non-CE MRI (76). Additional investigations have shown that CE-MRI detected synovitis correlates with histology (76, 77), and is more sensitive (67) and specific (75) than non-CE MRI. These studies further the belief that Gd-based CE-MRI improves imaging of the synovium. However, obvious drawbacks to intravenous gadolinium administration exist, including prolonged scan time, increased cost, possible allergic reactions, and a risk of nephrogenic systemic fibrosis.
Technical Advances in MRI
Recent advancements in MRI have paved the way for several exciting applications, including imaging at high field strengths, imaging using multiple radiofrequency channels, and T2* imaging.
High Field Strengths
Many clinical systems continue to utilize 1.5 Tesla magnets for routine imaging. However, imaging at 3T is becoming increasingly more common for clinical patients, and optimizing imaging at 7T is a subject of much current research (78). Higher field strengths such as 3.0T improve SNR, allowing for greater temporal and spatial resolution and decreased scan time (78). These advantages are also achieved at higher field strengths. However B1 inhomogeneities, increased chemical shift differences between water and fat, RF power deposition, and changes in tissue relaxation characteristics significantly influence musculoskeletal MRI at 7.0T (78). A recent investigation by Jordan et al. found that the T1 relaxation times of cartilage, muscle, synovial fluid, bone marrow, and subcutaneous fat were significantly greater at 7.0T compared with 3.0T (79). The opposite trend was observed for T2 values at these field strengths. However, while higher field strengths introduce new challenges to musculoskeletal MRI, their advantages may prove more valuable. The knee and ankle joints have been successfully evaluated in vivo at 7T; the hip joint has been evaluated in cadaveric specimens (80, 81).
The majority of high field studies have been conducted in the knee. Most recently, multiple channel array coils (82) and sodium imaging 83 have been explored in the knee in vivo at 7T. In the ankle, Juras et al. compared SNR and CNR at 3T and 7T in three routine clinical imaging sequences: 1) 3D-GRE, 2) 2D proton density-weighted FSE, and 3) 2D T1-weighted SE (84). SNR was calculated for cartilage, bone, muscle, synovial fluid, Achilles tendon, and Kager’s fat pad, while CNR was measured for cartilage/bone, cartilage/fluid, cartilage/muscle, and muscle/fat pad. Significant increases in SNR were observed in the 3D-GRE and T1-weighted 2D-FSE sequences at 7T, while an increase in CNR was observed in T1-weighted 2D-FSE sequences and most 3D-GRE sequences (Figure 14). The proton density-weighted 2D FSE sequences showed a decreased SNR at 7T.
Figure 14.
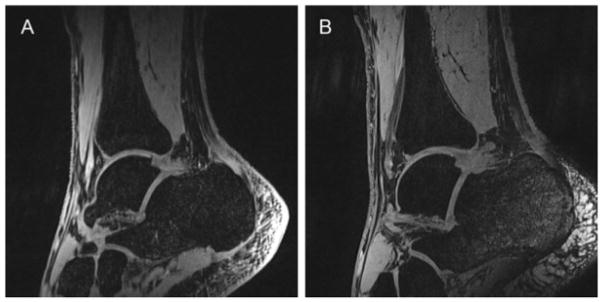
Three dimensional T1-weighted, gradient recalled echo (GRE) sequences obtained from a healthy ankle in the sagittal plane at 3T (A) and 7T (B). Compared with 3T, higher signal-to-noise ratio and contrast-to-noise ratio were observed at 7T. Image credit: Juras, European Journal of Radiology, 2011.
Multiple Receiver Channels
Improvements in radiofrequency (RF) coil technology are being developed to keep pace with higher field strengths. Phased array coils have a higher intrinsic surface SNR than quadrature coils at the cost of some loss of intensity uniformity of MR images. Parallel imaging methods use multiple channels to extend the imaging field of view without increasing scan time, by exploiting the spatially-varying sensitivity profiles of the phased array coil elements. These techniques reduce scan time and required RF pulses while also shortening TEs; parallel imaging compromises image uniformity and SNR, but phased array coils with as many as 32 channels may be able to offset these shortcomings. A recent in vivo study conducted at 7.0T by Chang et al. demonstrated that a 28-channel receive array coil increased SNR and CNR for evaluating morphology and mapping T2 relaxation times in articular cartilage in comparison to a quadrature volume coil (82). Furthermore, the 28-channel coil afforded a 40–48% reduction in scan time. These results lend support for the use of high field MRI to improve soft tissue contrast. However, the cartilage T2 relaxation times obtained by the 28-channel coil were 20% less than those obtained by the quadrature coil, leading the investigators to advise coil consistency in longitudinal imaging studies.
T2* Imaging
Like T2, T2* describes the transverse relaxation of tissue. However, in addition to spin-spin dephasing, T2* accounts for magnetic field inhomogeneity and gradient susceptibility, both factors that affect dephasing. Consequently, T2* is always shorter than T2, as these additional factors cause the signal to decay more rapidly. Two-dimensional UTE, 3D UTE, and 2D UTE spectroscopy have been used to measure T2* in the menisci, ligaments, tendons, and articular cartilage (Figure 15). Average T2* relaxation times have been reported as 22.6–24.1 ms for articular cartilage (59), 4–10 ms for the meniscus (with zonal variation), 3 ms for ligaments (85), and 2 ms for tendons (85). Like T2, measurements of voxel-by-voxel T2* relaxation times are generated by acquiring a series of images at different TEs and fitting the values to a monoexponential decay curve. Although T2* is well correlated with T2 (59), T2* may provide additional information regarding tissue health and structure. Future studies are necessary to better understand the T2* measurement and to apply this imaging technique to other anatomical sites of the lower extremity.
Figure 15.
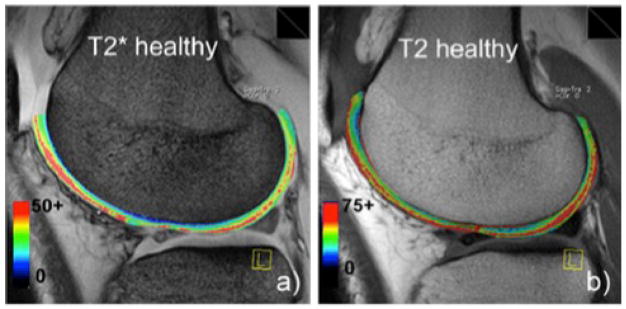
T2* (A) and T2 (B) mapping of articular cartilage in healthy medial femoral condyle. Image credit: Mamisch et al., Skeletal Radiology, 2011.
Imaging Around Metal
The number of primary and revision total hip and knee arthroplasties continues to increase. Between 1990 and 2002, hip replacements and revisions increased by 62% and 79%; knee replacements and revisions saw even more dramatic changes, increasing by 192% and 195%, respectively (86). Complications of total joint replacements include soft tissue irritation, periprosthetic osteolysis, loosening, malposition, instability, and infection (87). MRI is normally preferred for the non-invasive evaluation of soft tissues. However, in the presence of metal, the main magnetic field is disrupted and strong, spatially varying local gradients are induced (88). Accordingly, MR image quality is disrupted due primarily to the presence of signal loss and distortion artifacts (88). A pressing need to improve the ability to non-invasively image around metal has accompanied the growth in total joint procedures.
View angle tilting (VAT) was first used to correct in plane distortion; however it failed to correct for through plane distortion (89, 90). Two 3D-MRI techniques were developed within the past few years to further improve the correction of metal-induced artifacts: slice encoding for metal artifact correction (SEMAC) (91) and multi-acquisition variable-resonance image combination (MAVRIC) (92). SEMAC builds on earlier techniques for imaging around metal, using a spin echo to prevent signal loss from dephasing and a VAT compensation gradient to minimize in plane distortion. In addition, SEMAC acquires signal using a 3D spin echo, which resolves through plane distortion by allowing all slice profiles to be resolved and aligned to their actual voxel location (Figure 16). MAVRIC does not use a 2D multislice excitation approach, but instead excites a series of limited spectral bandwidths to restrict in plane distortion. A 2011 study by Chen et al. compared SEMAC and MAVRIC techniques in patients with total knee replacements and a knee replacement model. Both techniques corrected for the metal artifact, afforded PD, T1, T2, and STIR contrast, allowed accurate measurement of implant alignment and rotation, and delivered high-resolution images with superb soft tissue contrast (87). Most recently, MAVRIC-SL, a hybrid of SEMAC and MAVRIC, has been proposed to combine the advantages of each individual technique (93). This acquisition utilizes the z-selectivity of SEMAC and the spectral properties of MAVRIC, and has been shown to decrease the metallic artifacts around implants at field strengths up to 3.0T (93) (Figure 17).
Figure 16.
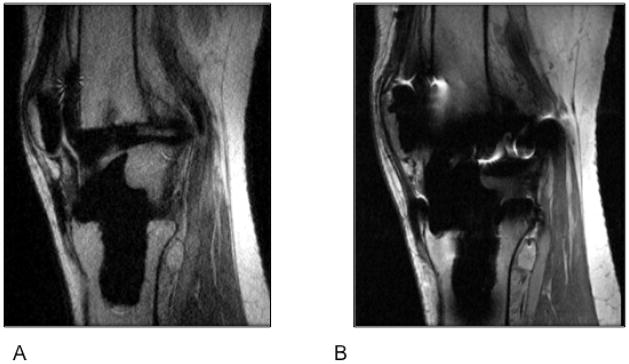
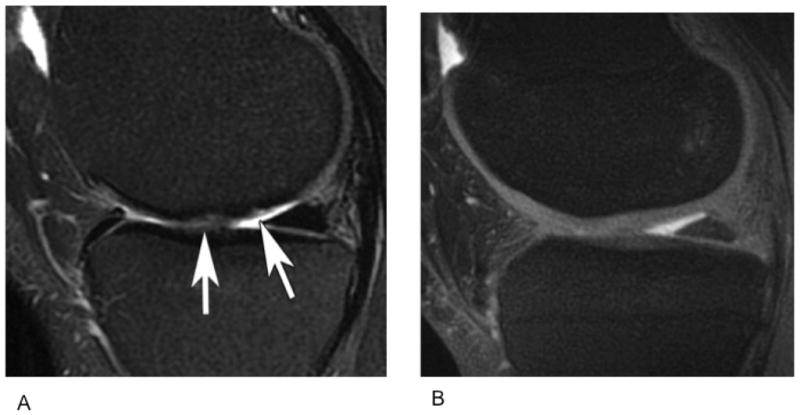
(A) Sagittal MR images through the knee obtained using Slice Encoding for Metal Artifact Correction (SEMAC), which corrects for spatial distortions by performing extra slice encoding and view-angle tilting (VAT), and (B) Conventional PD-weighted sequence. Compared to the spin echo proton density image (B), SEMAC affords improved visualization of tissues around metallic implants.
Figure 17.
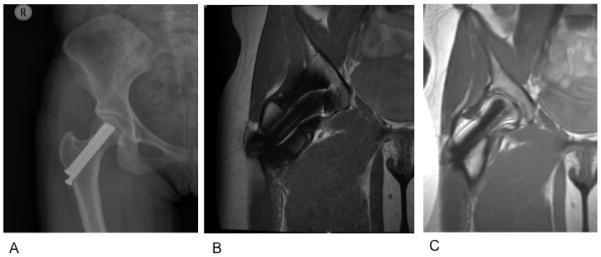
(A) AP radiograph of the right hip in a 22-year-old woman with a pinned femoral neck fracture. The hardware and surrounding soft tissue are obscured on the coronal proton density-weighted acquisition (B) but are well visualized with the MAVRIC-SL sequence (C). Images courtesy of Dr. Kathryn Stevens, Stanford University.
Conclusion
Magnetic resonance imaging of the lower extremity provides a comprehensive, non-invasive and non-ionizing evaluation of pathology. Traditional MRI methods provide excellent and reliable depictions of anatomy and internal derangements. New MRI methods are providing insight into tissue physiology and function, including inflammation. MRI of the lower extremity is an evolving, exciting field that continues to push the envelope using new MR technology.
Key points.
MRI is the most promising modality for evaluation of the lower extremity, particularly the hip, knee, and ankle joints.
The structural composition of musculoskeletal tissues such as ligaments, cartilage, or muscle is variable. Tissue-specific MRI techniques are therefore crucial for optimal visualization and assessment of these structures.
The most recent advancements in MRI of the lower extremity include imaging with higher magnetic field strengths and a greater number of receiver channels, imaging using T2*, and imaging around metal.
Footnotes
Conflicts of Interest: Drs. Gold and Hargreaves receive research support from GE Healthcare. Dr. Gold also serves as a consultant for Zimmer, Arthrocare, and Isto Inc and receives funding support from the Arthritis Foundation, NIH EB002524, and NIH K24 AR062068. Dr. Dragoo receives funding from Genzyme, Linvatec, Ossur, and Smith & Nephew.
Publisher's Disclaimer: This is a PDF file of an unedited manuscript that has been accepted for publication. As a service to our customers we are providing this early version of the manuscript. The manuscript will undergo copyediting, typesetting, and review of the resulting proof before it is published in its final citable form. Please note that during the production process errors may be discovered which could affect the content, and all legal disclaimers that apply to the journal pertain.
References
- 1.Quatman CE, Hettrich CM, Schmitt LC, et al. The clinical utility and diagnostic performance of magnetic resonance imaging for identification of early and advanced knee osteoarthritis: a systematic review. Am J Sports Med. 39(7):1557–1568. doi: 10.1177/0363546511407612. [DOI] [PMC free article] [PubMed] [Google Scholar]
- 2.Katz LD, Haims A, Medvecky M, et al. Symptomatic hip plica: MR arthrographic and arthroscopic correlation. Skeletal Radiol. 39(12):1255–1258. doi: 10.1007/s00256-010-1026-x. [DOI] [PubMed] [Google Scholar]
- 3.Zlatkin MB, Pevsner D, Sanders TG, et al. Acetabular labral tears and cartilage lesions of the hip: indirect MR arthrographic correlation with arthroscopy--a preliminary study. AJR Am J Roentgenol. 194(3):709–714. doi: 10.2214/AJR.07.3669. [DOI] [PubMed] [Google Scholar]
- 4.Gold GE, Mosher TJ. Arthritis in Color: Advanced Imaging of Osteoarthritis. Philadelphia: Elsevier Saunders; 2009. pp. 153–192. [Google Scholar]
- 5.Carrino JA, Blum J, Parellada JA, et al. MRI of bone marrow edema-like signal in the pathogenesis of subchondral cysts. Osteoarthritis Cartilage. 2006;14(10):1081–1085. doi: 10.1016/j.joca.2006.05.011. [DOI] [PubMed] [Google Scholar]
- 6.Crema MD, Roemer FW, Marra MD, et al. MRI-detected bone marrow edema-like lesions are strongly associated with subchondral cysts in patients with or at risk for knee osteoarthritis: the MOST study. Osteoarthritis Cartilage. 2008;14:1033–1040. [Google Scholar]
- 7.Bergman AG, Willen HK, Lindstrand AL, et al. Osteoarthritis of the knee: correlation of subchondral MR signal abnormalities with histopathologic and radiographic features. Skeletal Radiol. 1994;23(6):445–448. doi: 10.1007/BF00204605. [DOI] [PubMed] [Google Scholar]
- 8.Roemer FW, Hunter DJ, Guermazi A. MRI-based semiquantitative assessment of subchondral bone marrow lesions in osteoarthritis research. Osteoarthritis Cartilage. 2009;17(3):414–415. doi: 10.1016/j.joca.2008.07.019. author reply 416–417. [DOI] [PubMed] [Google Scholar]
- 9.Yu JS, Cook PA. Magnetic resonance imaging (MRI) of the knee: a pattern approach for evaluating bone marrow edema. Crit Rev Diagn Imaging. 1996;37(4):261–303. [PubMed] [Google Scholar]
- 10.Zanetti M, Bruder E, Romero J, et al. Bone marrow edema pattern in osteoarthritic knees: correlation between MR imaging and histologic findings. Radiology. 2000;215(3):835–840. doi: 10.1148/radiology.215.3.r00jn05835. [DOI] [PubMed] [Google Scholar]
- 11.Du J, Carl M, Diaz E, et al. Ultrashort TE T1rho (UTE T1rho) imaging of the Achilles tendon and meniscus. Magn Reson Med. 64(3):834–842. doi: 10.1002/mrm.22474. [DOI] [PubMed] [Google Scholar]
- 12.Patten C, Meyer RA, Fleckenstein JL. T2 mapping of muscle. Semin Musculoskelet Radiol. 2003;7(4):297–305. doi: 10.1055/s-2004-815677. [DOI] [PubMed] [Google Scholar]
- 13.Gatehouse PD, He T, Puri BK, et al. Contrast-enhanced MRI of the menisci of the knee using ultrashort echo time (UTE) pulse sequences: imaging of the red and white zones. Br J Radiol. 2004;77(920):641–647. doi: 10.1259/bjr/31774546. [DOI] [PubMed] [Google Scholar]
- 14.Gold GE, Bergman AG, Pauly JM, et al. Magnetic resonance imaging of knee cartilage repair. Top Magn Reson Imaging. 1998;9(6):377–392. [PubMed] [Google Scholar]
- 15.Robson MD, Gatehouse PD, Bydder M, et al. Magnetic resonance: an introduction to ultrashort TE (UTE) imaging. J Comput Assist Tomogr. 2003;27(6):825–846. doi: 10.1097/00004728-200311000-00001. [DOI] [PubMed] [Google Scholar]
- 16.Gold GE, Pauly JM, Macovski A, et al. MR spectroscopic imaging of collagen: tendons and knee menisci. Magn Reson Med. 1995;34(5):647–654. doi: 10.1002/mrm.1910340502. [DOI] [PubMed] [Google Scholar]
- 17.Rahmer J, Bornert P, Dries SP. Assessment of anterior cruciate ligament reconstruction using 3D ultrashort echo-time MR imaging. J Magn Reson Imaging. 2009;29(2):443–448. doi: 10.1002/jmri.21653. [DOI] [PubMed] [Google Scholar]
- 18.Qian Y, Williams AA, Chu CR, et al. High-resolution ultrashort echo time (UTE) imaging on human knee with AWSOS sequence at 3.0 T. J Magn Reson Imaging. 35(1):204–210. doi: 10.1002/jmri.22639. [DOI] [PMC free article] [PubMed] [Google Scholar]
- 19.Grodzki DM, Jakob PM, Heismann B. Ultrashort echo time imaging using pointwise encoding time reduction with radial acquisition (PETRA) Magn Reson Med. 67(2):510–518. doi: 10.1002/mrm.23017. [DOI] [PubMed] [Google Scholar]
- 20.Syha R, Martirosian P, Ketelsen D, et al. Magnetization transfer in human Achilles tendon assessed by a 3D ultrashort echo time sequence: quantitative examinations in healthy volunteers at 3T. Rofo. 183(11):1043–1050. doi: 10.1055/s-0031-1281742. [DOI] [PubMed] [Google Scholar]
- 21.Magee T, Williams D. Detection of meniscal tears and marrow lesions using coronal MRI. AJR Am J Roentgenol. 2004;183(5):1469–1473. doi: 10.2214/ajr.183.5.1831469. [DOI] [PubMed] [Google Scholar]
- 22.Magee TH, Hinson GW. MRI of meniscal bucket-handle tears. Skeletal Radiol. 1998;27(9):495–499. doi: 10.1007/s002560050426. [DOI] [PubMed] [Google Scholar]
- 23.Lee JH, Singh TT, Bolton G. Axial fat-saturated FSE imaging of knee: appearance of meniscal tears. Skeletal Radiol. 2002;31(7):384–395. doi: 10.1007/s00256-002-0507-y. [DOI] [PubMed] [Google Scholar]
- 24.Tarhan NC, Chung CB, Mohana-Borges AV, et al. Meniscal tears: role of axial MRI alone and in combination with other imaging planes. AJR Am J Roentgenol. 2004;183(1):9–15. doi: 10.2214/ajr.183.1.1830009. [DOI] [PubMed] [Google Scholar]
- 25.Helms CA. The meniscus: recent advances in MR imaging of the knee. AJR Am J Roentgenol. 2002;179(5):1115–1122. doi: 10.2214/ajr.179.5.1791115. [DOI] [PubMed] [Google Scholar]
- 26.Fox MG. MR imaging of the meniscus: review, current trends, and clinical implications. Radiol Clin North Am. 2007;45(6):1033–1053. vii. doi: 10.1016/j.rcl.2007.08.009. [DOI] [PubMed] [Google Scholar]
- 27.De Smet AA, Tuite MJ. Use of the “two-slice-touch” rule for the MRI diagnosis of meniscal tears. AJR Am J Roentgenol. 2006;187(4):911–914. doi: 10.2214/AJR.05.1354. [DOI] [PubMed] [Google Scholar]
- 28.Blackmon GB, Major NM, Helms CA. Comparison of fast spin-echo versus conventional spin-echo MRI for evaluating meniscal tears. AJR Am J Roentgenol. 2005;184(6):1740–1743. doi: 10.2214/ajr.184.6.01841740. [DOI] [PubMed] [Google Scholar]
- 29.Craig JG, Go L, Blechinger J, et al. Three-tesla imaging of the knee: initial experience. Skeletal Radiol. 2005;34(8):453–461. doi: 10.1007/s00256-005-0919-6. [DOI] [PubMed] [Google Scholar]
- 30.Ramnath RR, Magee T, Wasudev N, et al. Accuracy of 3-T MRI using fast spin-echo technique to detect meniscal tears of the knee. AJR Am J Roentgenol. 2006;187(1):221–225. doi: 10.2214/AJR.05.0419. [DOI] [PubMed] [Google Scholar]
- 31.Kreitner KF, Romaneehsen B, Krummenauer F, et al. Fast magnetic resonance imaging of the knee using a parallel acquisition technique (mSENSE): a prospective performance evaluation. Eur Radiol. 2006;16(8):1659–1666. doi: 10.1007/s00330-006-0288-0. [DOI] [PubMed] [Google Scholar]
- 32.Niitsu M, Ikeda K. Routine MR examination of the knee using parallel imaging. Clin Radiol. 2003;58(10):801–807. doi: 10.1016/s0009-9260(03)00260-5. [DOI] [PubMed] [Google Scholar]
- 33.Son MS, Levenston ME, Hargreaves BA, et al. T1p and T2 Show Regional Variation in Degenerate Human Menisci: Correlation with Biomechanics and Matrix Composition. International Society for Magnetic Resonance in Medicine; Melbourne, Australia. 2012. [Google Scholar]
- 34.Clohisy JC, Beaule PE, O’Malley A, et al. AOA symposium. Hip disease in the young adult: current concepts of etiology and surgical treatment. J Bone Joint Surg Am. 2008;90(10):2267–2281. doi: 10.2106/JBJS.G.01267. [DOI] [PubMed] [Google Scholar]
- 35.Ganz R, Parvizi J, Beck M, et al. Femoroacetabular impingement: a cause for osteoarthritis of the hip. Clin Orthop Relat Res. 2003;(417):112–120. doi: 10.1097/01.blo.0000096804.78689.c2. [DOI] [PubMed] [Google Scholar]
- 36.Leunig M, Beaule PE, Ganz R. The concept of femoroacetabular impingement: current status and future perspectives. Clin Orthop Relat Res. 2009;467(3):616–622. doi: 10.1007/s11999-008-0646-0. [DOI] [PMC free article] [PubMed] [Google Scholar]
- 37.Cicuttini F, Forbes A, Asbeutah A, et al. Comparison and reproducibility of fast and conventional spoiled gradient-echo magnetic resonance sequences in the determination of knee cartilage volume. J Orthop Res. 2000;18(4):580–584. doi: 10.1002/jor.1100180410. [DOI] [PubMed] [Google Scholar]
- 38.Eckstein F, Westhoff J, Sittek H, et al. In vivo reproducibility of three-dimensional cartilage volume and thickness measurements with MR imaging. AJR Am J Roentgenol. 1998;170(3):593–597. doi: 10.2214/ajr.170.3.9490936. [DOI] [PubMed] [Google Scholar]
- 39.Gold GE, Fuller SE, Hargreaves BA, et al. Driven equilibrium magnetic resonance imaging of articular cartilage: initial clinical experience. J Magn Reson Imaging. 2005;21(4):476–481. doi: 10.1002/jmri.20276. [DOI] [PubMed] [Google Scholar]
- 40.Duc SR, Pfirrmann CW, Schmid MR, et al. Articular cartilage defects detected with 3D water-excitation true FISP: prospective comparison with sequences commonly used for knee imaging. Radiology. 2007;245(1):216–223. doi: 10.1148/radiol.2451060990. [DOI] [PubMed] [Google Scholar]
- 41.Eckstein F, Hudelmaier M, Wirth W, et al. Double echo steady state magnetic resonance imaging of knee articular cartilage at 3 Tesla: a pilot study for the Osteoarthritis Initiative. Ann Rheum Dis. 2006;65(4):433–441. doi: 10.1136/ard.2005.039370. [DOI] [PMC free article] [PubMed] [Google Scholar]
- 42.Peterfy CG, Schneider E, Nevitt M. The osteoarthritis initiative: report on the design rationale for the magnetic resonance imaging protocol for the knee. Osteoarthritis Cartilage. 2008;16(12):1433–1441. doi: 10.1016/j.joca.2008.06.016. [DOI] [PMC free article] [PubMed] [Google Scholar]
- 43.Vasanawala SS, Pauly JM, Nishimura DG. Fluctuating equilibrium MRI. Magn Reson Med. 1999;42(5):876–883. doi: 10.1002/(sici)1522-2594(199911)42:5<876::aid-mrm6>3.0.co;2-z. [DOI] [PubMed] [Google Scholar]
- 44.Kijowski R, Blankenbaker DG, Klaers JL, et al. Vastly undersampled isotropic projection steady-state free precession imaging of the knee: diagnostic performance compared with conventional MR. Radiology. 2009;251(1):185–194. doi: 10.1148/radiol.2511081133. [DOI] [PubMed] [Google Scholar]
- 45.Friedrich KM, Reiter G, Kaiser B, et al. High-resolution cartilage imaging of the knee at 3T: basic evaluation of modern isotropic 3D MR-sequences. Eur J Radiol. 78(3):398–405. doi: 10.1016/j.ejrad.2010.01.008. [DOI] [PubMed] [Google Scholar]
- 46.Stevens KJ, Busse RF, Han E, et al. Ankle: isotropic MR imaging with 3D-FSE-cube--initial experience in healthy volunteers. Radiology. 2008;249(3):1026–1033. doi: 10.1148/radiol.2493080227. [DOI] [PMC free article] [PubMed] [Google Scholar]
- 47.Stevens KJ, Wallace CG, Chen W, et al. Imaging of the wrist at 1.5 Tesla using isotropic three-dimensional fast spin echo cube. J Magn Reson Imaging. 33(4):908–915. doi: 10.1002/jmri.22494. [DOI] [PMC free article] [PubMed] [Google Scholar]
- 48.Dijkgraaf LC, de Bont LG, Boering G, et al. The structure, biochemistry, and metabolism of osteoarthritic cartilage: a review of the literature. J Oral Maxillofac Surg. 1995;53(10):1182–1192. doi: 10.1016/0278-2391(95)90632-0. [DOI] [PubMed] [Google Scholar]
- 49.Smith HE, Mosher TJ, Dardzinski BJ, et al. Spatial variation in cartilage T2 of the knee. J Magn Reson Imaging. 2001;14(1):50–55. doi: 10.1002/jmri.1150. [DOI] [PubMed] [Google Scholar]
- 50.Mosher TJ, Zhang Z, Reddy R, et al. Knee articular cartilage damage in osteoarthritis: analysis of MR image biomarker reproducibility in ACRIN-PA 4001 multicenter trial. Radiology. 258(3):832–842. doi: 10.1148/radiol.10101174. [DOI] [PMC free article] [PubMed] [Google Scholar]
- 51.Wheaton AJ, Casey FL, Gougoutas AJ, et al. Correlation of T1rho with fixed charge density in cartilage. J Magn Reson Imaging. 2004;20(3):519–525. doi: 10.1002/jmri.20148. [DOI] [PubMed] [Google Scholar]
- 52.Blumenkrantz G, Majumdar S. Quantitative magnetic resonance imaging of articular cartilage in osteoarthritis. Eur Cell Mater. 2007;13:76–86. doi: 10.22203/ecm.v013a08. [DOI] [PubMed] [Google Scholar]
- 53.Li XHE, Crane JC. Development of in vivo multi-slice spiral T1 rho mapping in cartilage at 3T and its application to osteoarthritis. Annual Meeting International Society of Magnetic Resonance in Medicine; Miami, FL. 2005. [Google Scholar]
- 54.Regatte RR, Akella SV, Wheaton AJ, et al. 3D-T1rho-relaxation mapping of articular cartilage: in vivo assessment of early degenerative changes in symptomatic osteoarthritic subjects. Acad Radiol. 2004;11(7):741–749. doi: 10.1016/j.acra.2004.03.051. [DOI] [PubMed] [Google Scholar]
- 55.Stahl R, Luke A, Li X, et al. T1rho, T2 and focal knee cartilage abnormalities in physically active and sedentary healthy subjects versus early OA patients--a 3.0-Tesla MRI study. Eur Radiol. 2009;19(1):132–143. doi: 10.1007/s00330-008-1107-6. [DOI] [PubMed] [Google Scholar]
- 56.Borthakur A, Shapiro EM, Beers J, et al. Sensitivity of MRI to proteoglycan depletion in cartilage: comparison of sodium and proton MRI. Osteoarthritis Cartilage. 2000;8(4):288–293. doi: 10.1053/joca.1999.0303. [DOI] [PubMed] [Google Scholar]
- 57.Wang L, Wu Y, Chang G, et al. Rapid isotropic 3D-sodium MRI of the knee joint in vivo at 7T. J Magn Reson Imaging. 2009;30(3):606–614. doi: 10.1002/jmri.21881. [DOI] [PMC free article] [PubMed] [Google Scholar]
- 58.McKenzie CA, Williams A, Prasad PV, et al. Three-dimensional delayed gadolinium-enhanced MRI of cartilage (dGEMRIC) at 1.5T and 3.0T. J Magn Reson Imaging. 2006;24(4):928–933. doi: 10.1002/jmri.20689. [DOI] [PubMed] [Google Scholar]
- 59.Mamisch TC, Hughes T, Mosher TJ, et al. T2 star relaxation times for assessment of articular cartilage at 3 T: a feasibility study. Skeletal Radiol. 41(3):287–292. doi: 10.1007/s00256-011-1171-x. [DOI] [PubMed] [Google Scholar]
- 60.Knuesel PR, Pfirrmann CW, Noetzli HP, et al. MR arthrography of the hip: diagnostic performance of a dedicated water-excitation 3D double-echo steady-state sequence to detect cartilage lesions. AJR Am J Roentgenol. 2004;183(6):1729–1735. doi: 10.2214/ajr.183.6.01831729. [DOI] [PubMed] [Google Scholar]
- 61.Ullrick SR, Blankenbaker DG, Davis KW, et al. MR arthrography of the hip: comparison of an IDEAL- SPGR sequence with standard MR sequences in the detection of cartilage lesions. American Roentogen Ray Society Annual Meeting; Boston, MA. 2009. [Google Scholar]
- 62.Gold SL, Burge AJ, Potter HG. MRI of Hip Cartilage: Joint Morphology, Structure, and Composition. Clin Orthop Relat Res. doi: 10.1007/s11999-012-2403-7. [DOI] [PMC free article] [PubMed] [Google Scholar]
- 63.Chhabra A, Soldatos T, Chalian M, et al. Current concepts review: 3T magnetic resonance imaging of the ankle and foot. Foot Ankle Int. 33(2):164–171. doi: 10.3113/FAI.2012.0164. [DOI] [PubMed] [Google Scholar]
- 64.Bauer JS, Barr C, Henning TD, et al. Magnetic resonance imaging of the ankle at 3.0 Tesla and 1.5 Tesla in human cadaver specimens with artificially created lesions of cartilage and ligaments. Invest Radiol. 2008;43(9):604–611. doi: 10.1097/RLI.0b013e31817e9ada. [DOI] [PubMed] [Google Scholar]
- 65.Schmid MR, Pfirrmann CW, Hodler J, et al. Cartilage lesions in the ankle joint: comparison of MR arthrography and CT arthrography. Skeletal Radiol. 2003;32(5):259–265. doi: 10.1007/s00256-003-0628-y. [DOI] [PubMed] [Google Scholar]
- 66.Welsch GH, Mamisch TC, Weber M, et al. High-resolution morphological and biochemical imaging of articular cartilage of the ankle joint at 3.0 T using a new dedicated phased array coil: in vivo reproducibility study. Skeletal Radiol. 2008;37(6):519–526. doi: 10.1007/s00256-008-0474-z. [DOI] [PubMed] [Google Scholar]
- 67.Song IH, Althoff CE, Hermann KG, et al. Knee osteoarthritis. Efficacy of a new method of contrast-enhanced musculoskeletal ultrasonography in detection of synovitis in patients with knee osteoarthritis in comparison with magnetic resonance imaging. Ann Rheum Dis. 2008;67(1):19–25. doi: 10.1136/ard.2006.067462. [DOI] [PubMed] [Google Scholar]
- 68.Keen HI, Conaghan PG. Ultrasonography in osteoarthritis. Radiol Clin North Am. 2009;47(4):581–594. doi: 10.1016/j.rcl.2009.04.007. [DOI] [PubMed] [Google Scholar]
- 69.Guermazi A, Eckstein F, Hellio Le Graverand-Gastineau MP, et al. Osteoarthritis: current role of imaging. Med Clin North Am. 2009;93(1):101–126. xi. doi: 10.1016/j.mcna.2008.08.003. [DOI] [PubMed] [Google Scholar]
- 70.Walther M, Harms H, Krenn V, et al. Correlation of power Doppler sonography with vascularity of the synovial tissue of the knee joint in patients with osteoarthritis and rheumatoid arthritis. Arthritis Rheum. 2001;44(2):331–338. doi: 10.1002/1529-0131(200102)44:2<331::AID-ANR50>3.0.CO;2-0. [DOI] [PubMed] [Google Scholar]
- 71.Walther M, Harms H, Krenn V, et al. Synovial tissue of the hip at power Doppler US: correlation between vascularity and power Doppler US signal. Radiology. 2002;225(1):225–231. doi: 10.1148/radiol.2251011272. [DOI] [PubMed] [Google Scholar]
- 72.Fernandez-Madrid F, Karvonen RL, Teitge RA, et al. Synovial thickening detected by MR imaging in osteoarthritis of the knee confirmed by biopsy as synovitis. Magn Reson Imaging. 1995;13(2):177–183. doi: 10.1016/0730-725x(94)00119-n. [DOI] [PubMed] [Google Scholar]
- 73.Hill CL, Gale DG, Chaisson CE, et al. Knee effusions, popliteal cysts, and synovial thickening: association with knee pain in osteoarthritis. J Rheumatol. 2001;28(6):1330–1337. [PubMed] [Google Scholar]
- 74.Hill CL, Hunter DJ, Niu J, et al. Synovitis detected on magnetic resonance imaging and its relation to pain and cartilage loss in knee osteoarthritis. Ann Rheum Dis. 2007;66(12):1599–1603. doi: 10.1136/ard.2006.067470. [DOI] [PMC free article] [PubMed] [Google Scholar]
- 75.Roemer FW, Guermazi A, Zhang Y, et al. Hoffa’s Fat Pad: Evaluation on Unenhanced MR Images as a Measure of Patellofemoral Synovitis in Osteoarthritis. AJR Am J Roentgenol. 2009;192(6):1696–1700. doi: 10.2214/AJR.08.2038. [DOI] [PubMed] [Google Scholar]
- 76.Loeuille D, Rat AC, Goebel JC, et al. Magnetic resonance imaging in osteoarthritis: which method best reflects synovial membrane inflammation? Correlations with clinical, macroscopic and microscopic features. Osteoarthritis Cartilage. 2009;17(9):1186–1192. doi: 10.1016/j.joca.2009.03.006. [DOI] [PubMed] [Google Scholar]
- 77.Loeuille D, Chary-Valckenaere I, Champigneulle J, et al. Macroscopic and microscopic features of synovial membrane inflammation in the osteoarthritic knee: correlating magnetic resonance imaging findings with disease severity. Arthritis Rheum. 2005;52(11):3492–3501. doi: 10.1002/art.21373. [DOI] [PubMed] [Google Scholar]
- 78.Regatte RR, Schweitzer ME. Ultra-high-field MRI of the musculoskeletal system at 7.0T. J Magn Reson Imaging. 2007;25(2):262–269. doi: 10.1002/jmri.20814. [DOI] [PubMed] [Google Scholar]
- 79.Jordan CD, Saranathan M, Bangerter NK, et al. Musculoskeletal MRI at 3.0T and 7.0T: A comparison of relaxation times and image contrast. Eur J Radiol. doi: 10.1016/j.ejrad.2011.09.021. [DOI] [PMC free article] [PubMed] [Google Scholar]
- 80.Greaves LL, Gilbart MK, Yung A, et al. Deformation and recovery of cartilage in the intact hip under physiological loads using 7T MRI. J Biomech. 2009;42(3):349–354. doi: 10.1016/j.jbiomech.2008.11.025. [DOI] [PubMed] [Google Scholar]
- 81.Greaves LL, Gilbart MK, Yung AC, et al. Effect of acetabular labral tears, repair and resection on hip cartilage strain: A 7T MR study. J Biomech. 43(5):858–863. doi: 10.1016/j.jbiomech.2009.11.016. [DOI] [PubMed] [Google Scholar]
- 82.Chang G, Wiggins GC, Xia D, et al. Comparison of a 28-channel receive array coil and quadrature volume coil for morphologic imaging and T2 mapping of knee cartilage at 7T. J Magn Reson Imaging. 35(2):441–448. doi: 10.1002/jmri.23506. [DOI] [PMC free article] [PubMed] [Google Scholar]
- 83.Madelin G, Jerschow A, Regatte RR. Sodium relaxation times in the knee joint in vivo at 7T. NMR Biomed. 25(4):530–537. doi: 10.1002/nbm.1768. [DOI] [PMC free article] [PubMed] [Google Scholar]
- 84.Juras V, Welsch G, Bar P, et al. Comparison of 3T and 7T MRI clinical sequences for ankle imaging. Eur J Radiol. 81(8):1846–1850. doi: 10.1016/j.ejrad.2011.05.023. [DOI] [PubMed] [Google Scholar]
- 85.Du J, Takahashi AM, Chung CB. Ultrashort TE spectroscopic imaging (UTESI): application to the imaging of short T2 relaxation tissues in the musculoskeletal system. J Magn Reson Imaging. 2009;29(2):412–421. doi: 10.1002/jmri.21465. [DOI] [PubMed] [Google Scholar]
- 86.Kurtz S, Mowat F, Ong K, et al. Prevalence of primary and revision total hip and knee arthroplasty in the United States from 1990 through 2002. J Bone Joint Surg Am. 2005;87(7):1487–1497. doi: 10.2106/JBJS.D.02441. [DOI] [PubMed] [Google Scholar]
- 87.Chen CA, Chen W, Goodman SB, et al. New MR imaging methods for metallic implants in the knee: artifact correction and clinical impact. J Magn Reson Imaging. 33(5):1121–1127. doi: 10.1002/jmri.22534. [DOI] [PMC free article] [PubMed] [Google Scholar]
- 88.Wendt RE, 3rd, Wilcott MR, 3rd, Nitz W, et al. MR imaging of susceptibility-induced magnetic field inhomogeneities. Radiology. 1988;168(3):837–841. doi: 10.1148/radiology.168.3.3406413. [DOI] [PubMed] [Google Scholar]
- 89.Butts K, Pauly JM, Gold GE. Reduction of blurring in view angle tilting MRI. Magn Reson Med. 2005;53(2):418–424. doi: 10.1002/mrm.20375. [DOI] [PubMed] [Google Scholar]
- 90.Cho ZH, Kim DJ, Kim YK. Total inhomogeneity correction including chemical shifts and susceptibility by view angle tilting. Med Phys. 1988;15(1):7–11. doi: 10.1118/1.596162. [DOI] [PubMed] [Google Scholar]
- 91.Lu W, Pauly KB, Gold GE, et al. SEMAC: Slice Encoding for Metal Artifact Correction in MRI. Magn Reson Med. 2009;62(1):66–76. doi: 10.1002/mrm.21967. [DOI] [PMC free article] [PubMed] [Google Scholar]
- 92.Koch KM, Lorbiecki JE, Hinks RS, et al. A multispectral three-dimensional acquisition technique for imaging near metal implants. Magn Reson Med. 2009;61(2):381–390. doi: 10.1002/mrm.21856. [DOI] [PubMed] [Google Scholar]
- 93.Koch KM, Brau AC, Chen W, et al. Imaging near metal with a MAVRIC-SEMAC hybrid. Magn Reson Med. 65(1):71–82. doi: 10.1002/mrm.22523. [DOI] [PubMed] [Google Scholar]