Abstract
Expression microarray analysis of Candida glabrata following phagocytosis by human neutrophils was performed, and results were compared with those from C. glabrata incubated under conditions of carbohydrate or nitrogen deprivation. Twenty genes were selected to represent the major cell processes altered by phagocytosis or nutrient deprivation. Quantitative real-time PCR (qRT-PCR) with TaqMan chemistry was used to assess expression of the same genes in spleens of mice infected intravenously with Candida glabrata. The results in spleen closely paralleled gene expression in neutrophils or following carbohydrate deprivation. Fungal cells responded by upregulating alternative energy sources through gluconeogenesis, glyoxylate cycle, and long-chain fatty acid metabolism. Autophagy was likely employed to conserve intracellular resources. Aspartyl protease upregulation occurred and may represent defense against attacks on cell wall integrity. Downregulated genes were in the pathways of protein and ergosterol synthesis. Upregulation of the sterol transport gene AUS1 suggested that murine cholesterol may have been used to replace ergosterol, as has been reported in vitro. C. glabrata isolates in spleens of gp91phox−/− knockout mice with reduced oxidative phagocyte defenses were grossly similar although with a reduced level of response. These results are consistent with reported results of other fungi responding to phagocytosis, indicating that a rapid shift in metabolism is required for growth in a carbohydrate-limited intracellular environment.
INTRODUCTION
Candida glabrata is second in frequency only to Candida albicans as a cause of hematogenously disseminated candidiasis and is associated with equivalent mortality, largely attributed to preexisting comorbidities (1). Studies of host defense against Candida glabrata have been limited. Experimental infections in mice have shown much less virulence than with C. albicans, which is lethal to mice with an intravenous inoculum of 105 cells or less (2). Inocula of C. glabrata injected intravenously into C57BL/6J mice were not lethal, even at 5 × 10⁷ yeast cells (3). Organ burden after 107 C. glabrata cells was higher in spleen than in kidney or liver and gradually fell with time from an initial 106 cells/g at 24 h (see below). The cells responsible for this drop in fungal burden appear to be macrophages, which were abundant in these spleens; neutrophils were sparse (our unpublished data). An important role for oxidative killing by these macrophages can be inferred from the lethality and progressive organ burden found in knockout mice with defective phagocyte oxidative capacity (gp91phox−/− and gp47phox−/−) (3). Neutrophils appear to be protective in deep infections with this species. In humans with Candida bloodstream infections, considering all Candida species together, neutropenia is a risk factor for death (4). Human neutrophils killed 62% of wild-type C. glabrata in 1 h in vitro (5). The role of oxidative killing is more conjectural in humans because patients with chronic granulomatous disease do not appear to be more susceptible to bloodstream infections caused by any Candida species (6). With the foregoing considerations about the role of neutrophils and oxidative killing in C. glabrata infections, we investigated the transcriptional response of C. glabrata to three host environments, human neutrophils, spleens of wild-type (C57BL/6J) mice, and spleens of gp91phox−/− knockout mice in a C57BL/6J background. C. glabrata infection in gp91phox−/− mice has given comparable results in the past to infection in gp47phox−/− mice (3).
The transcriptional response of C. glabrata to phagocytic attack has been studied in vitro, using murine macrophage cell lines and microarray (7) as well as bone marrow-derived murine macrophages and fluorescent fusion proteins (8). Responses to human neutrophils in vitro and in the mouse spleen in vivo have not been reported.
Analyzing expression of fungal genes in infected tissue has the potential of improving understanding of pathogenesis. The technical problem is the high ratio of host mRNA to fungal mRNA. In order to improve the ratio, samples with high fungal burden have been selected, such as by excising C. albicans abscesses from rabbit kidneys (9), harvesting infected tissue from the liver surface of an animal infected intraperitoneally (10), or lavaging Cryptococcus neoformans (11) or Aspergillus fumigatus (12) from mouse lungs early after intratracheal inoculation. Usually, a second step, such as differential centrifugation, lysis of mammalian cells, or RNase treatment, is required (13). As mentioned above, gene expression of single fungal cells has also been studied microscopically using fungi with fluorescent reporters inserted into open reading frames (ORFs) (14). The topic of measuring gene expression in vivo has been reviewed (15, 16).
A useful proxy has been to study fungi internalized by phagocytes in vitro, but the validity of this approach is open to conjecture. The approach used here was to study C. glabrata internalized by human neutrophils, selecting 20 genes from representative cellular processes and using the selectivity of the primer-probe combination in TaqMan chemistry to measure fungal gene expression directly in spleens of infected mice. The concordance of in vitro and in vivo results encourages the use of this approach for measuring in vivo gene expression.
(The data in this paper were presented as a poster at the 11th ASM Conference on Candida and Candidiasis, 29 March to 2 April 2012.)
MATERIALS AND METHODS
Strains, media, and growth conditions.
Candida glabrata strain Cg29 is a clinical strain used in a prior study to infect mice (3). Cg29 cells were incubated in yeast extract-peptone-dextrose (YPD) broth (1% yeast extract, 2% peptone, 2% dextrose) (MP Biomedicals, Solon, OH) or synthetic complete (SC) medium (0.17% yeast nitrogen base [YNB] without amino acid and ammonium sulfate, 2% dextrose, 0.5% ammonium sulfate, amino acids, 20 mg/liter adenine sulfate, and 20 mg/liter uracil) as described previously (17) except the medium used in the starvation experiments, which was used as described below (18). The Candida cells were incubated at 37°C.
Incubation of C. glabrata with neutrophils.
Human whole blood with preservative-free heparin was collected from healthy donors following informed consent under an institutional review board (IRB)-approved protocol. Neutrophils (PMN) were purified using 3% dextran clinical grade (MP Biomedicals) and Percoll (GE Healthcare Bio-Sciences, Piscataway, NJ). This procedure yielded about 95% pure PMN. The number of PMN was counted using a hemocytometer. Cg29 cells were incubated overnight with shaking at 37°C in YPD broth. These cells were diluted into the same fresh medium to an optical density at 600 nm (OD600) of 0.5 (approximately 1.3 × 10⁷ cells/ml) and incubated for 4 h to obtain log-phase cells. Cultures were collected by centrifugation, resuspended with phosphate-buffered saline (pH 7.4), and counted with a hemocytometer. A total of 1.0 × 10⁸ Cg29 cells and 5.0 × 10⁷ PMN were inoculated into 15-ml conical tubes containing RPMI 1640 (Gibco, Grand Island, NY) with 25 mM HEPES (Mediatech, Herndon, VA) (pH 7.2) plus 5% fresh donor heparinized plasma for a total volume of 10 ml. For the control culture, 108 Cg29 cells were incubated in the same culture medium without PMN. Tubes were tumbled vertically for 30 and 60 min at 8 rpm at 37°C in a ProBlot hybridization oven (Labnet, Edison, NJ). Tubes were immediately transferred into ice-cold water, and phagocytosis was confirmed microscopically. The phagocytic index was calculated as the mean number of internalized C. glabrata yeasts per PMN observed microscopically in 50 random fields (oil immersion objective, ×1,000). Cells were collected by centrifugation at 6,000 rpm for 5 min at 4°C, resuspended with 10 ml ice-cold water, and vortexed for 3 min. This procedure resulted in lysis of all neutrophils as determined by microscopic examination of the centrifuged sediment. Tubes were centrifuged at 6,000 rpm for 5 min at 4°C, and the pellets were immediately frozen on dry ice-ethanol after discarding the supernatant. Total RNA was prepared directly from the collected cells as described below to examine the global transcription profile of C. glabrata.
Nutrient starvation conditions.
Cg29 cells were grown overnight in SC medium with shaking at 37°C. Cultures were diluted into the same fresh medium to an OD600 of 0.5 and incubated at 37°C for 4 h to obtain log-phase Candida cells. The cells were collected by centrifugation and washed once with water. The Candida cells were resuspended with water and counted with a hemocytometer. We added 1.0 × 10⁸ Candida cells into 10 ml of three different culture media, described below, in 15-ml conical tubes. For each starvation condition, the medium was 1.7 g/liter YNB without amino acids and ammonium sulfate which contains no usable nitrogen or carbohydrate. To this medium, we added 0.025% ammonium sulfate and 2% glucose for nitrogen depletion. For carbohydrate depletion, we used the same YNB and added 0.5% ammonium sulfate, amino acids, 20 mg/liter adenine sulfate, and 20 mg/liter uracil (17). We also incubated cells in SC medium as a complete medium control. Cultures were tumbled at 8 rpm for 30 and 60 min at 37°C to parallel the conditions of the PMN experiments and then collected by centrifugation. The pellets of Candida cells were frozen immediately on dry ice-ethanol. RNA was also prepared directly from the collected cells as described below.
RNA isolation, microarray hybridization, and data analysis.
RNA was prepared from the frozen cell pellet using TRIzol (Invitrogen, Carlsbad, CA) and lysing matrix C with FastPrep-24 (MP Biomedicals) and purified with the RNeasy MinElute cleanup kit (Qiagen, Valencia, CA) according to the manufacturer's instructions. Total mRNA was reverse transcribed to cDNA with cyanine 3-dUTP (Cy3) or cyanine 5-dUTP (Cy5) (Amersham, Piscataway, NJ) using Superscript II reverse transcriptase (Invitrogen), and dyes were also reverse labeled for dye swap control. The probes were purified using Vivaspin 500 (Sartorius Stedim Biotech, Edgewood, NY), mixed, and heated for 2 min at 98°C. Microarrays were prepared and analyzed as described previously (19). Arrays for three biological replicates with a dye swap for each, for a total of 6 arrays, were performed for PMN experiments, and arrays for two biological replicates with one dye swap, for a total of 3 arrays, were performed for carbohydrate and nitrogen depletion experiments at 30 and 60 min incubation, respectively. Differentially expressed genes were defined by a log2 relative fold change of at least 1.32 (2.5-fold) in 4 of 6 arrays in PMN experiments or 2 of 3 arrays in nutrient starvation experiments. The annotations of differently expressed ORFs were done using the Genolevures website http://Genolevures.org. The function and process of homologous Saccharomyces cerevisiae genes were also investigated using the Comprehensive Yeast Genome Database (CYGD; http://mips.gsf.de/genre/proj/yeast/). Genes were organized into significant biological processes using the Gene Ontology (GO) Term Finder tool in the Saccharomyces Genome Database (http://www.yeastgenome.org/cgi-bin/GO/goTermFinder.pl). P values of ≤0.01 were considered to be significant.
qRT-PCR.
To confirm the results of microarray of PMN experiments, quantitative real-time PCR (qRT-PCR) was performed on selected mRNA. The RNA samples were recovered from Cg29 cells with and without PMN of three selected PMN experiments, treated with the Turbo DNA-free kit (Applied Biosystems, Foster City, CA), and reverse transcribed using the High-Capacity cDNA archive kit (Applied Biosystems) according to the manufacturer's instructions. TaqMan probe and primer sets were designed for the selected genes and the ACT1 gene of C. glabrata by using Primer Express version 3.0 (Applied Biosystems) (Table 1). The Primer-BLAST program (http://www.ncbi.nlm.nih.gov/tools/primer-blast/) was also used to confirm that there were no homologs of human or mouse genomic DNA that can be amplified by these primers. Different concentrations of cDNA in 5 μl were added to 12.5 μl of TaqMan Universal PCR master mix (2×), 2.5 μl of 2.5 μM TaqMan probe (Applied Biosystems), and 2.5 μl of 9 μM forward and reverse primers (Invitrogen) each. The reaction was performed in triplicate in 96-well plates on an ABI Prism 7500 (Applied Biosystems). Data analysis was performed by a threshold cycle (ΔΔCT) method by following the manufacturer's instructions (Applied Biosystems). The threshold cycles of the target were normalized to the CT of the ACT1 gene (ΔCT = CT Target − CT ACT1). The ΔΔCT (ΔCT with PMN − ΔCT without PMN) was calculated by the mean of the ΔCT values of different concentrations of cDNA from three biological replicates. Assays were also performed on different cDNA concentrations to ensure similar primer efficiencies among the various targets. Therefore, the negative ΔΔCT values are equivalent to log2 relative fold changes.
Table 1.
Probes and primers for qRT-PCR
| Gene | ORF | Probe (5′–3′) | Forward primer (5′–3′) | Reverse primer (5′–3′) |
|---|---|---|---|---|
| ACT1 | CAGL0K12694g | CCACGTTGTTCCAATTTACGCCGG | TTGGACTCTGGTGACGGTGTTA | AAAATAGCGTGTGGCAAAGAGAA |
| ASC1 | CAGL0D02090g | TCCAAGACTGTACCTTGACCGAAAACGG | CTTCAAGGGTCACTCCCACATT | CAAGAACCGGAAAGAGCGTAA |
| AUS1 | CAGL0F01419g | CGGTGCCCCAACGTCGGGTATC | CCAAGCCACTGCAGGTGAA | GGCGTGAAACAGGGACTTGA |
| CAT8 | CAGL0M03025g | AACAAAATGTAGCACCAGGACTGCCAGC | GTTGTTTCGAACATCATTGTGGAT | AACTGTGCACTTTCCTCTCTCTCA |
| CDC19 | CAGL0M12034g | TTGTCCGTATGAACTTCTCCCACGGTTCT | CCAGAAACCTTGGTTGCTCTAAG | TCAATGACAGACTTGTGGTATTCGT |
| CDR1 | CAGL0M01760g | TTATCTGCTGCGATGGTTCCTGCTTCC | AGATGTGTTGGTTCTGTCTCAAAGAC | CCGGAATACATTGACAAACCAAG |
| CIS3 | CAGL0M08514g | TCCACCTTGACCCCATCCGGTACTGT | GCCGATGGTTACACTCCAGGTA | GCAGTGTATTCTGGCTTAGCACAA |
| CTA1 | CAGL0K10868g | CTTGATCGACTCCTTGGCCCACTTCA | TGGTCAACACGGCCCATT | GAGGGTTTCTTTCTGGGATTCTC |
| ERG2 | CAGL0L10714g | ACAAAAGGGCTACGCAAAGCAATACGC | TCCCAGGTATGACCCATCATC | TGCGAAGGAGTTTTGATCCAT |
| ERG10 | CAGL0L12364g | TTCCAAGGTGCGTTGGCCTCCA | GCCAGAACCCCAATTGGTT | TGCAATGACACCTAGGTCAACAG |
| ERG11 | CAGL0E04334g | CTTCCGCTGCTACCTCCGCTTGG | TGTCTTGATGGGTGGTCAACA | CTGGTCTTTCAGCCAAATGCA |
| FAA2 | CAGL0H09460g | CCCGGATCTGATGAGTACCTTCGCG | TCTCCTCGGTATGCTGAATTGA | GGGTGGTTAGACAGTGGGAAAG |
| ICL1 | CAGL0J03058g | AGTCCAGGAGCACATCAACAGACTGGTCA | GCCGGCAGGTGTGTCATC | TGTCCGCGCACATTCTGA |
| IDP2 | CAGL0B04917g | AGGCACGCCTTCGGCGACC | CCACAATGGAAGGAACCTATAATCA | CGACATCGGTGGCCCTATAC |
| MET4 | CAGL0G06688g | TCCACCTGGCGCCTATAATACCCTGC | GTGTCATTACTTCCACGTGTGAAAG | TGGTCGCTAGTGAATCCCAAA |
| MET28 | CAGL0K08668g | CACAACTGGTGGCCACAGCAGTGC | GCAGTGGGACAACAGGGCTAT | TTGTCCTCGACTTCGTCTTCAC |
| PCK1 | CAGL0H06633g | AACGCTGGCCAATTCCCCGC | CGGTGAGCCAGACTTCACTGTA | GGTCATATCTTGGGTTCTTGCAT |
| PDH1 | CAGL0F02717g | CAGGCTCACATGCAAACCAAGACTACCAT | AATGGATGTTAGAAGTAGTTGGAGCAG | TGTTCGGAATTTCTCCACACCT |
| PDR1 | CAGL0A00451g | TCGAATATTATGCACCATCATGTCTGTGTTTAGCT | AACGATTATTCAATTGCAACAACG | CCTCACAATAAGGAAAGTCTGCG |
| SLT2 | CaGL0J00539g | TCGAAACTCCATGAACAACGATTCCTTCC | GGACTCCCATCCGCATCTG | TCCAACTCGCGTTCTAAATCG |
| STR3 | CAGL0L06094g | TGATCTCCATGCCATGTTTAATGTCCCA | TCACTGTTTCATTTGGCTGTGTAA | CACAACAAAGACGAATCAGATCTTC |
Because mouse mRNA was so much more abundant than fungal mRNA in the tissue, the amount of cDNA from spleen loaded into the qRT-PCR required 7.5 μg instead of the 100 ng used for C. glabrata grown in SC medium or incubated with neutrophils. Figure 1 compares the number of spleen CFU and the ΔCT values of ACT1, CDR1, and ERG11 in the same spleen following the intravenous injection of 107 CFU of strain 84 into C57BL/6J mice. Each time point is the average from three mice. This experiment utilized strain 84 (19), although numbers of CFU were comparable to those of Cg29 (3).
Fig 1.
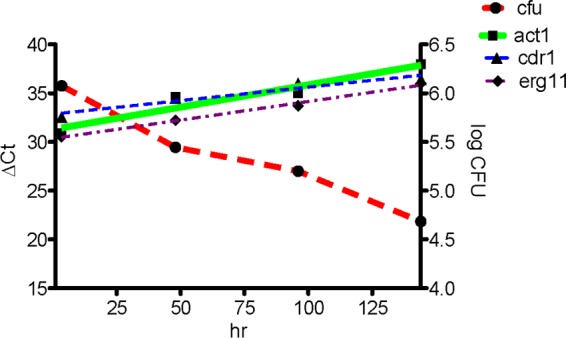
Comparison of spleen CFU and ΔCT values of ACT1, CDR1, and ERG11 in the same spleen following the intravenous injection of 107 CFU of strain 84 into C57BL/6J mice. Each time point shows the average from three mice.
It should be noted that the background subtraction to obtain ΔΔCT differed between our human neutrophil and mouse spleen studies. The neutrophil ΔΔCT was obtained by subtracting the ΔCT of C. glabrata grown in RPMI 1640 with 5% fresh human plasma in the absence of neutrophils. For spleen, the ΔΔCT was obtained by subtracting the ΔCT of log-phase cells grown in SC, reflecting the metabolic state of C. glabrata inoculated into the mice. The issue of background control has been discussed by Wilson et al. (16), who point out the problem inherent in the medium differences, such as transferring fungal cells from medium with 2% glucose into RPMI 1640 with 0.2% glucose.
Systemic candidiasis murine model.
Female immunocompetent C57BL/6J mice and gp91phox−/− mice on a C57BL/6J background (strain B6.129S6-Cybbtm1Din/J, stock number 002365) lacking phagocyte superoxide production were used (Jackson Laboratory, Bar Harbor, ME). Mice were housed in an AAALAC-accredited NIAID facility and used under a protocol approved by the NIAID Animal Care and Use Committee. C. glabrata Cg29 cells were cultured in YPD medium with shaking for 17 h at 37°C. Groups of three mice were inoculated via the tail vein with 4.8 × 10⁷ CFU per mouse. After 24 h observation, spleens were removed and immediately frozen with dry ice-ethanol. The spleen and 2 ml of TRIzol were put in a small tissue grinder (Kendall, Mansfield, MA) and homogenized. Total RNA was extracted from the homogenates, treated with the Turbo DNA-free kit, and reverse transcribed to cDNA to examine expression of 20 genes with qRT-PCR as described above. The ΔΔCT (ΔCT values obtained from Cg29 cells in C57BL/6J or gp91phox−/− mouse spleens minus the ΔCT from cells grown in SC medium) was calculated by ΔCT values of 7.5 μg cDNA from three spleen samples and 100 ng of cDNA from SC-grown C. glabrata and presented as the log2 relative fold change.
Microarray.
All the data on nutrient deprivation are expressed as the ratio of C. glabrata grown in experimental conditions to C. glabrata grown in SC medium, given as the log2 ratio. For neutrophils, the control for both microarray and qRT-PCR was C. glabrata incubated in RPMI 1640 with 5% fresh human plasma.
Microarray data accession number.
The complete data set is available at http://www.ncbi.nlm.nih.gov/geo as record GSE14868.
RESULTS
Neutrophil-C. glabrata coculture system.
The microscopic examination showed that 81% of Cg29 cells were engulfed by neutrophils after 30 min incubation. The average number of Candida cells in 333 neutrophils (phagocytic index; ± standard deviation) at 30 min was 3.2 ± 0.14 C. glabrata cells/neutrophil.
Differentially upregulated genes after 30 and 60 min incubation.
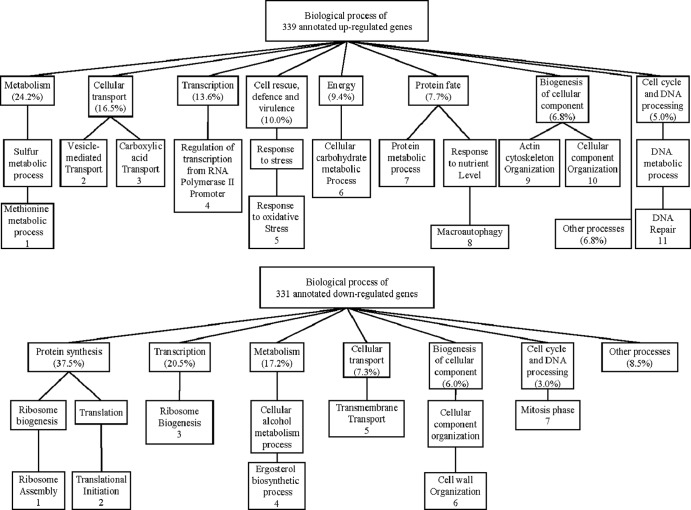
A total of 519 genes were upregulated upon exposure to PMN for 30 min. An additional 6 LYS genes were upregulated after 60 min. Of upregulated genes, 339 genes were annotated. A general classification of annotated upregulated genes by function is shown in Fig. 2. Data were further organized into significantly overrepresented biological processes using the GO Term Finder program. Because the global transcriptional response of Candida albicans and Saccharomyces cerevisiae upon exposure to PMN was reported to resemble carbohydrate and amino acid deprivation (20, 21), we exposed Cg29 cells to these two conditions to compare the profile with that during phagocytosis by PMN. Further, expression data of C. glabrata exposed to a murine macrophage-like cell line for 2 or 6 h (8) and to carbohydrate depletion for 20 min (22) were extracted from published data to compare with our results (Fig. 3). The numbered categories in the heat map correspond to numbers in the gene ontology (GO) diagram in Fig. 2. Upregulated genes in the neutrophil closely paralleled those induced by carbohydrate depletion in nearly all listed categories of metabolic processes, excluding LYS genes. Methionine metabolic processes were notably induced in C. glabrata in the neutrophil and by nitrogen deprivation in C. glabrata. Two genes of the MET cluster were also upregulated: MET28 and MUP1. These genes are transiently expressed during S phase of the S. cerevisiae cell cycle. MET28 is a major transcriptional regulator of methionine biosynthesis and responds to low intracellular S-adenosylmethionine (23). MUP1 is a methionine transporter. Upregulated carbohydrate processes (category 6) included gluconeogenesis (FBP1, PCK1, TDH3, PYC1), the glyoxylate cycle (ICL1, MLS1), and utilization of extracellular trehalose (NTH1). In category 3, genes in transport, including genes related to amino acids (GAP1), succinate-fumarate (SFC1), methionine (MUP1), and acetate or ammonium (ADY2), were upregulated. In category 9, actin cytoskeleton organization includes upregulation of HUA1, which drives vesicle-mediated transport (category 2). PDR1, a transcriptional factor which regulates drug efflux transport (CDR1, PDH1), was induced in neutrophils and in carbohydrate depletion. Also upregulated were genes in categories of oxidative stress (GAD1, ASK10, CTA1, SOD2) as well as genes in the autophagy pathway and the YPS glycophosphatidylinositol-linked aspartyl proteases. Figures 4 and 5 provide further information on autophagy, peroxisome, and YPS genes for comparison with reported results of C. glabrata in murine macrophages (7, 24).
Fig 2.
General functional classification of annotated upregulated and downregulated genes of C. glabrata with PMN. Genes were organized into biological processes using the Gene Ontology Term Finder tool in the Saccharomyces Genome Database and numbered for correlation with the underlying heat map.
Fig 3.
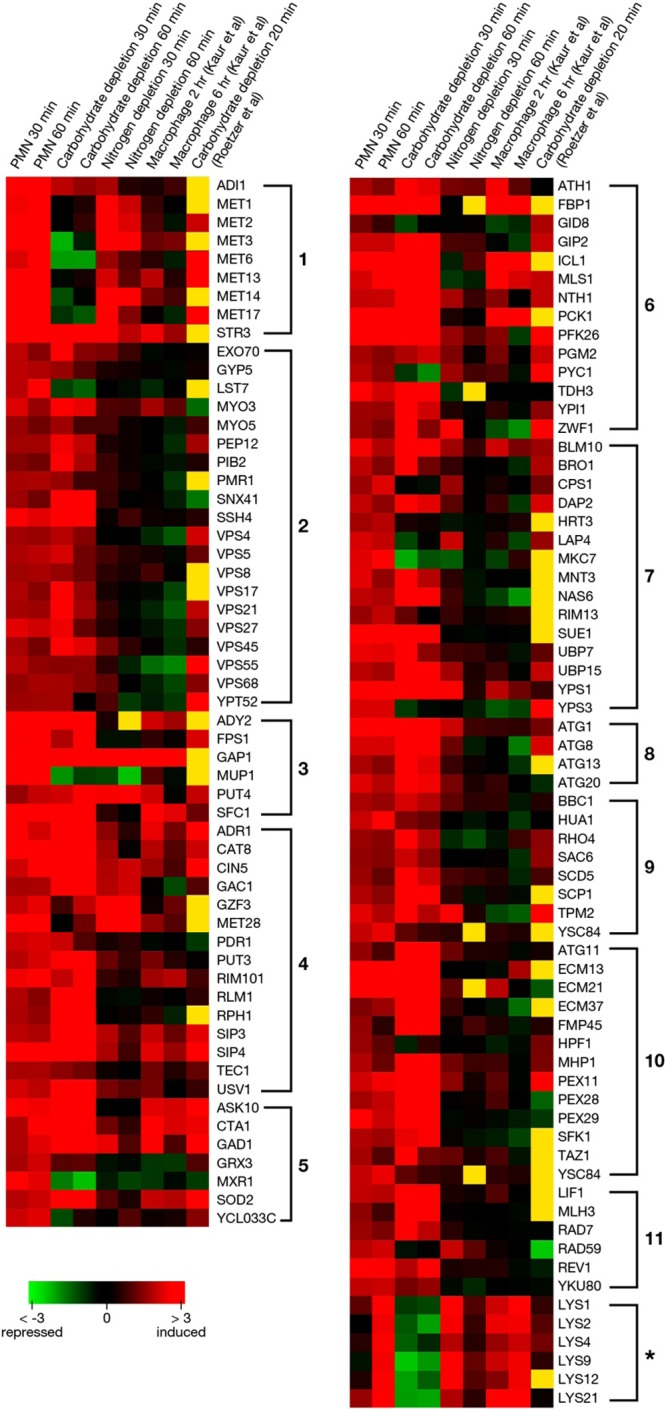
Heat map to compare expressions of significantly upregulated genes in neutrophils and under carbohydrate and nitrogen deprivation. Expression data of C. glabrata exposed to a murine macrophage-like cell line for 2 or 6 h (7) or to carbohydrate depletion for 20 min (22) were extracted from published data to compare with our results. The indicated color scale is based on log2 changes. Yellow indicates that a signal was not detected.
Fig 4.
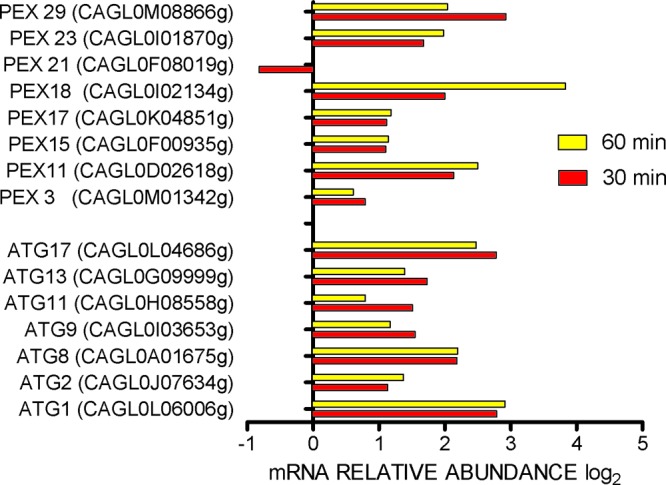
Peroxisome and autophagy gene expression in Candida glabrata in neutrophils. Microarray results are expressed as log2 ratios, with growth in RPMI 1640 as a comparator.
Fig 5.
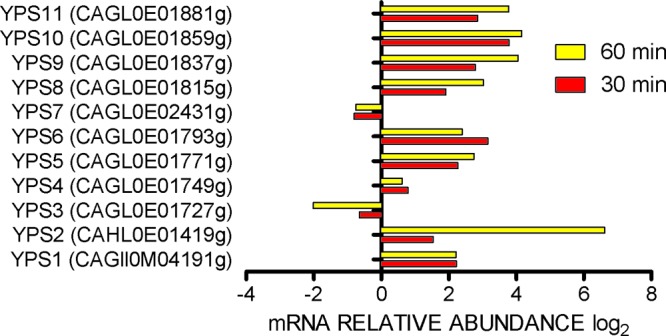
Aspartyl protease (YPS) gene expression in Candida glabrata in neutrophils. Microarray results are expressed as log2 ratios, with growth in RPMI1640 as a comparator.
Differentially downregulated genes.
A total of 360 genes were downregulated upon exposure to PMN for 30 min (Fig. 6). Of downregulated genes, 331 genes were annotated. Results at 60 min were nearly identical (Fig. 6). A general classification of annotated downregulated genes by function is shown in Fig. 1. Data were further organized into significantly overrepresented biological processes as described above. The same congruence of neutrophil phagocytosis and glucose deprivation was found for downregulated genes as was found for upregulated genes. Downregulated genes included those involved in synthesis of proteins (categories 1 and 2), ribosomes (category 3), and membrane sterols (category 4). Genes controlling transport of sugars (HXT6) and proteins (DNP2, SEC63) (category 3) were repressed in neutrophils and carbohydrate depletion. In category 6, genes controlling cell wall mannan biosynthesis (PSA1, CIS3) and beta-glucan assembly (GSC2, EXG1, UTR2) were significantly repressed. We also observed the repression of the process involved in cell cycle M phase (MSC7, CSM3). The repression of these genes is consistent with that with carbohydrate depletion. These results suggested that the Cg29 cells are trying to shut down the processes of protein synthesis and cell membrane and cell wall biosynthesis because of carbohydrate depletion.
Fig 6.
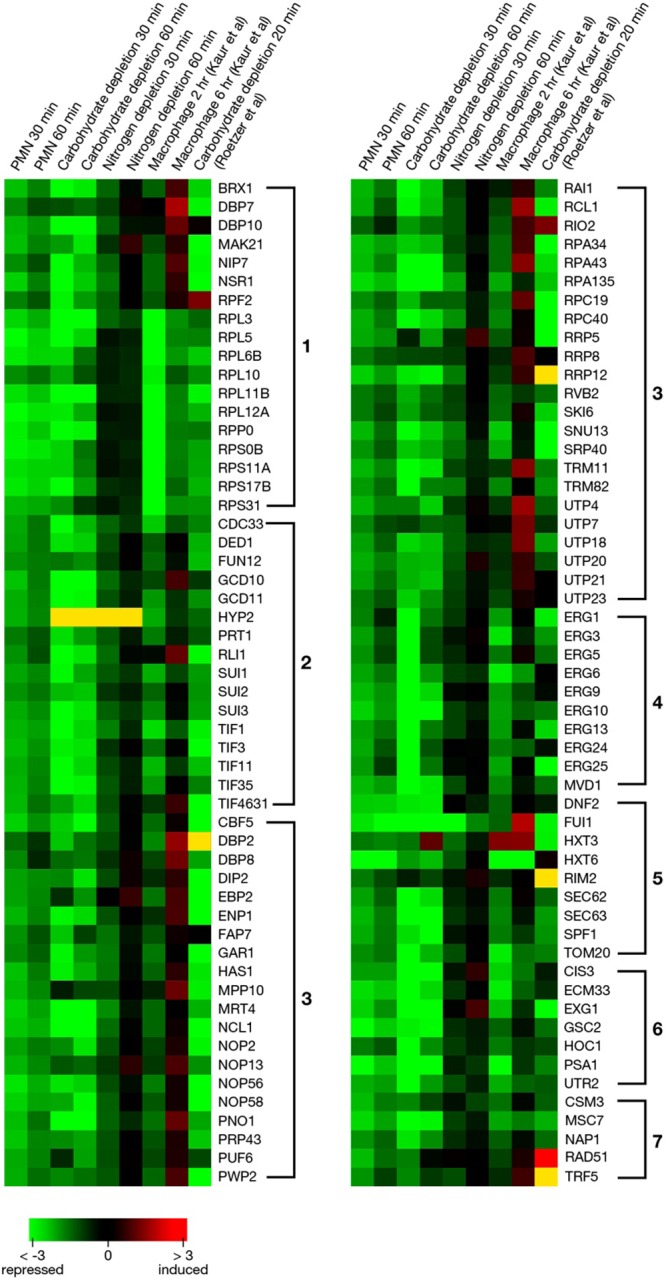
Heat map to compare expressions of significantly downregulated genes in neutrophils and under carbohydrate and nitrogen deprivation. Expression data of C. glabrata exposed to a murine macrophage-like cell line for 2 or 6 h (7) or to carbohydrate depletion for 20 min (22) were extracted from published data to compare with our results. The indicated color scale is based on log2 changes. Yellow indicates that a signal was not detected.
Comparison with published C. glabrata microarrays.
The published microarray data on C. glabrata strain ΔHTU (Δhis3 Δtrp1 Δura3) exposed to carbohydrate depletion for 20 min closely parallel the data reported here, for both upregulated and downregulated genes (22). In contrast, the transcriptome of C. glabrata strain BG2 phagocytosed by the murine macrophage cell line J774A.1 for 2 and 6 h had no broad similarity to our results with strain Cg29 phagocytosed by human neutrophils (7). Among the similarities was upregulation of the catalase CTA1, glyoxylate pathway genes PCK1 and ICL1, and six lysine biosynthesis genes. In regard to the LYS genes, deprivation of the essential amino acid lysine appears to have elicited this upregulation in neutrophils at 60 min and in murine macrophages at 2 and 6 h. Downregulation of the ergosterol pathway genes was seen in both macrophages and neutrophils. The dissimilarities between phagocytes are a reminder that C. glabrata has multiple strategies to survive within the host environment (25).
Selection of 20 genes from neutrophil experiments for qRT-PCR on infected mouse spleen.
Data from the neutrophil expression experiments were used to select 20 genes for qRT-PCR studies of mouse spleen. ACT1 was used as the loading control. Pathways represented by the genes are as follows: methionine biosynthesis, STR3, MET28, and MET4; alternative carbohydrate sources, PCK1, ICL1, IDP2 (tricarboxylic acid [TCA] cycle), FAA2 (fatty acid degradation), CDC19 (glycolysis), and CAT8 (diauxic shift); drug efflux, PDR1, PDH1, and CDR1; ergosterol biosynthesis, ERG2, ERG10, and ERG11; sterol transport, AUS1; protein and cell wall synthesis and cell wall integrity, ASC1 (core component of the small ribosomal subunit of protein synthesis), CIS3, and SLT2; oxidative stress, CTA1 (peroxisomal catalase). We validated our primer/probe selections by running qRT-PCR on cDNA from our neutrophil experiments and correlating the log2 values for the 20 genes. Correlation was very high between microarray and qRT-PCR values (Spearman r2 value = 0.94).
The 20 target genes we studied provided a mean CT at 10 μg of cDNA of 31.69 cycles (range, 27.33 to 35.95) in gp91phox−/− mice and 35.29 (range, 31.22 to 39.26) in normal mice, sometimes approaching the limit of 40 cycles with 5 μg cDNA. Genes with low expression levels were not able to be measured. As another consideration, efficiency of the reaction fell as input cDNA increased above 7.5 μg, causing nonlinearity of the dose-response curve and a lower r2. Computing the slope of the line relating micrograms of cDNA and ΔCT, using triplicate values for 5 and 7.5 μg in qRT-PCR, we found a slope that was consistent with the slope of C. glabrata grown in SC medium (−3.46) and in neutrophils (−3.67). However, the slope of the line between 7.5 and 10 μg input cDNA was higher than −3 in three genes from gp91phox−/− mice and five genes in normal mice, indicating decreased efficiency of the reaction at 10 μg input cDNA. We therefore used 7.5 μg cDNA for our analysis. Another limitation of this approach is that it required an organism burden of at least 105 CFU/g tissue (Fig. 1). This can be achieved consistently only in the first 24 h of the self-resolving infection in wild-type mice. Although decreased efficiency of the qRT-PCR may have affected quantitation of mRNA abundance, the parallel between the results with neutrophils and those with mouse spleen was encouraging.
Comparison of gene expressions of C. glabrata in infected mouse spleens and neutrophils.
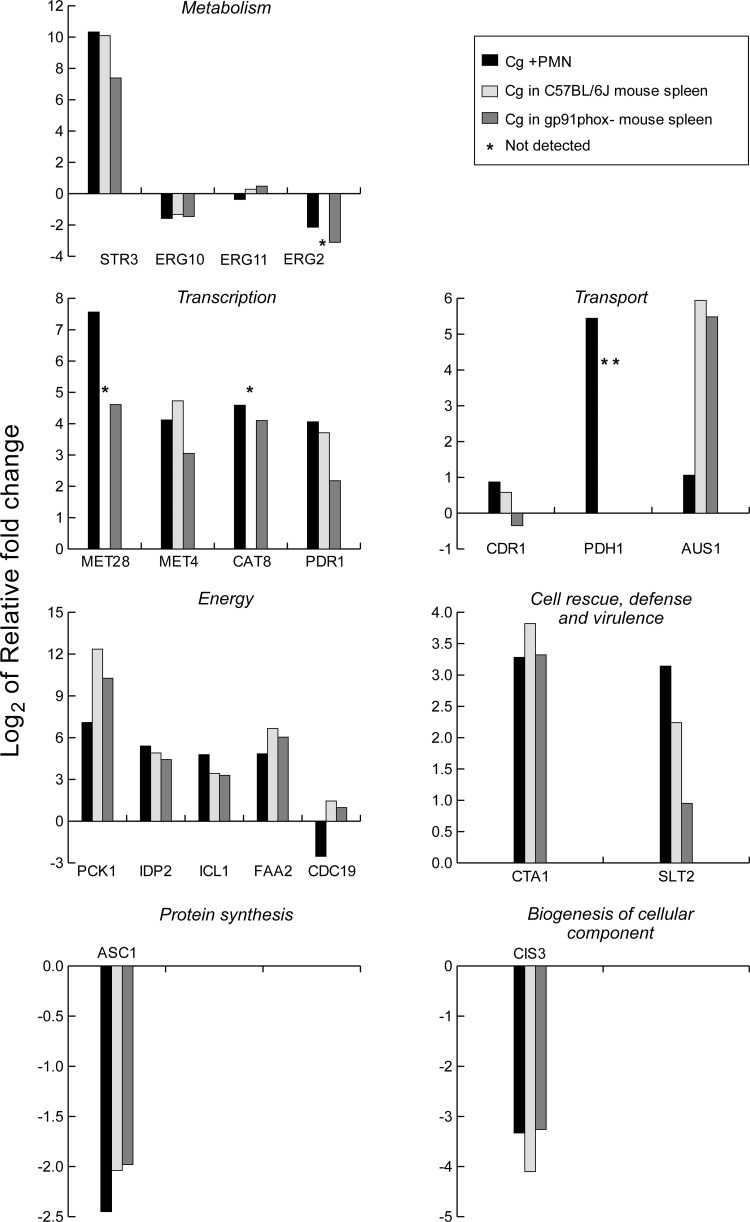
Figure 7 compares the qRT-PCR results with C. glabrata in neutrophils and in spleens of wild-type and gp91phox−/− knockout mice with impaired oxidative killing of intracellular organisms. Expression of four genes was too low to measure in wild-type mice, and expression of one gene was too low to measure in knockout mice. A high level of concordance was seen between results in neutrophils and those in mouse spleens. ERG11 and CDR1 expression were not 2-fold upregulated or downregulated in any system (note the use of log2 notation). Upregulation was seen in other genes with the exception of CDC19, a pyruvate kinase essential for glucose utilization. CDC19 was downregulated in neutrophils but not in mouse spleens. Nutrient depletion, particularly carbohydrate sources, was seen reflected in the mouse spleen, as in the neutrophils. Log2 5.94- and 5.48-fold (61- and 45-fold) upregulation of AUS1, a major sterol transporter, along with downregulation of ergosterol synthesis genes, may reflect the ability of C. glabrata to take up cholesterol when ergosterol synthesis is limited (26).
Fig 7.
Gene expression in Candida glabrata in spleens of infected C57BL/6J and gp91phox−/− mice and in neutrophils. qRT-PCR results from neutrophils are expressed as log2 relative fold changes compared with results for Cg29 cells incubated in RPMI 1640 without PMN. Spleen qRT-PCR results are compared with results for Cg29 cells grown in SC medium.
Effect of oxidative stress on gene expression in C. glabrata in mouse spleens.
To examine the effect of oxidative stress on the gene expression in the mouse spleen, we also compared the log2 fold changes of 20 target genes in C57BL/6J mouse spleens and those in gp91phox−/− mouse spleens (Fig. 7). Results were generally similar for the transcriptional regulation of these 20 genes in C57Bl/6J mice, gp91phox−/− mice, and neutrophils. However, there was a trend toward lower transcriptional regulation of C. glabrata in the spleens of gp91phox−/− mice compared to that in C57Bl/6J mice. Recalling that the comparator for mouse spleens was SCD culture medium, the better growth of C. glabrata in spleens of gp91phox−/− mice than in wild-type mice was also consistent with more-favorable growth conditions when oxidative killing was impaired.
DISCUSSION
We used the selectivity of TaqMan chemistry to study expression in whole-tissue homogenates without osmotic lysis or differential centrifugation. Description of the limitations of this technique may be of interest. TaqMan chemistry did allow selection of primers and probes for 20 genes and an ACT1 loading control which gave negligible signals with up to 10 μg cDNA from uninfected mouse spleen. We chose spleens of mice infected intravenously because of our experience that spleens gave higher colony counts than liver or kidney (3). In our prior report, using C. glabrata Cg29, spleens provided 105 to 106 CFU/gram with C57BL/6J mice and about a log more in gp47phox−/− and gp91phox−/− mice. Over the 9 days after inoculation, fungal burden fell in wild-type mice and rose slowly in gp47phox−/− and gp91phox−/− mice. We did not routinely quantitate fungal burden in the experiments reported here, but when we did, the results paralleled those of our former experiments.
Incubation of C. glabrata with neutrophils found changes in gene expression consistent with severe carbohydrate deprivation, including upregulation of genes in the glyoxylate cycle, beta-oxidation of long-chain fatty acids, and gluconeogenesis. Genes in the autophagy and pexophagy pathways were also upregulated, likely providing mechanisms for sequestering resources in a nutrient-deprived environment (27). The role played by upregulation of the glycophosphatidylinositol-linked aspartyl proteases is less clear but likely involved altering the fungal cell surface (7). Evidence of carbohydrate depletion has been found in many published systems of fungi incubated with neutrophils or macrophages (18, 20, 21). The glyoxylate cycle, utilized during glucose deprivation, was shown to be essential for virulence in C. albicans (28).
Induction of methionine pathway genes, as found in our neutrophil experiment, has been reported for C. albicans and S. cerevisiae strains incubated with human neutrophils (18). Our results with C. glabrata in neutrophils closely followed results with S. cerevisiae, including upregulation of MET genes, including STRE3 and MUP1, a high-affinity methionine permease (21). We also found a similar pattern between C. glabrata in neutrophils and Rubin-Bejerano et al.'s results with nitrogen deprivation in S. cerevisiae (21). This effect occurred despite the presence of serum as a potential nitrogen source in both our systems.
Autophagy pathway genes, particularly ATG11 and ATG17, were found to be important for survival of C. glabrata in murine macrophages (24). In that report, a decline in the peroxisome number during phagocytosis was consistent with pexophagy. In our neutrophil experiments, ATG11, ATG17, and five others in the autophagy pathway were upregulated, as were 7 of 8 peroxisome genes (Fig. 4). The recycling of nutrients through pexophagy and autophagic degradation has been reviewed recently (27, 29).
Gene expression in mouse spleen was consistent with that with severe carbohydrate depletion. Results in gp91phox−/− mouse spleen were closer to growth in the SC medium control than to growth in the neutrophil, including SLT2, consistent with the better fungal growth in the spleens of these animals (Fig. 7). SLT2 is a mitogen-activated protein (MAP) kinase that is important for cell integrity in C. glabrata (30) and for regulation of selective autophagy of peroxisomes (pexophagy) in S. cerevisiae (31). Expression of CTA1, coding for a peroxisomal catalase, was upregulated in spleens of gp91phox−/− mice, as in wild-type mice and neutrophils. Catalase should be an important defense against oxidative attack. However, CTA1 has been reported as dispensable for C. glabrata pathogenicity in mice (32), consistent with the concept that C. glabrata has multiple pathways to permit growth in the inimical environment of the host.
ACKNOWLEDGMENT
This work was supported by the Division of Intramural Research, NIAID.
Footnotes
Published ahead of print 12 February 2013
REFERENCES
- 1. Klevay MJ, Horn DL, Neofytos D, Pfaller MA, Diekema DJ. 2009. Initial treatment and outcome of Candida glabrata versus Candida albicans bloodstream infection. Diagn. Microbiol. Infect. Dis. 64:152–157 [DOI] [PubMed] [Google Scholar]
- 2. MacCallum DM, Odds FC. 2005. Temporal events in the intravenous challenge model for experimental Candida albicans infections in female mice. Mycoses 48:151–161 [DOI] [PubMed] [Google Scholar]
- 3. Ju JY, Polhamus C, Marr KA, Holland M, Bennett JE. 2002. Efficacies of fluconazole, caspofungin, and amphotericin B in Candida glabrata-infected p47phox −/− knockout mice. Antimicrob. Agents Chemother. 46:1240–1245 [DOI] [PMC free article] [PubMed] [Google Scholar]
- 4. Horn DL, Neofytos D, Anaissie EJ, Fishman JA, Steinbach WJ, Olysie AJ, Marr KA, Pfaller MA, Chang C-H, Webster KM. 2009. Epidemiology and outcomes of candidemia in 2019 patients: data from the prospective antifungal therapy alliance registry. Clin. Infect. Dis. 48:1695–1703 [DOI] [PubMed] [Google Scholar]
- 5. Kan VL, Geber A, Bennett JE. 1996. Enhanced oxidative killing of azole-resistant Candida glabrata strains with ERG11 deletions. Antimicrob. Agents Chemother. 40:1717–1719 [DOI] [PMC free article] [PubMed] [Google Scholar]
- 6. Falcone EL, Holland SM. 2012. Invasive fungal infection in chronic granulomatous disease: insights into pathogenesis and management. Curr. Opin. Infect. Dis. 25:658–669 [DOI] [PubMed] [Google Scholar]
- 7. Kaur R, Ma B, Cormack BP. 2007. A family of glycosylphosphatidylinositol-linked aspartyl proteases is required for virulence of Candida glabrata. Proc. Natl. Acad. Sci. U. S. A. 104:7628–7633 [DOI] [PMC free article] [PubMed] [Google Scholar]
- 8. Roetzer A, Gratz N, Kovarik P, Schüller C. 2010. Autophagy supports Candida glabrata survival during phagocytosis. Cell. Microbiol. 12:199–216 [DOI] [PMC free article] [PubMed] [Google Scholar]
- 9. Walker LA, MacCallum DM, Bertram G, Gow NAR, Odds FC, Brown AJP. 2009. Genome-wide analysis of Candida albicans gene expression patterns during infection of the mammalian kidney. Fungal Genet. Biol. 46:210–219 [DOI] [PMC free article] [PubMed] [Google Scholar]
- 10. Thewes S, Kretschmar M, Park H, Schaller M, Filler SG, Hube B. 2007. In vivo and ex vivo comparative transcriptional profiling of invasive and non-invasive Candida albicans isolate identifies genes associated with tissue invasion. Mol. Microbiol. 63:1606–1628 [DOI] [PubMed] [Google Scholar]
- 11. Hu G, Cheng PY, Sham A, Perfect JR, Kronstad JW. 2008. Metabolic adaptation in Cryptococcus neoformans during early murine infection. Mol. Microbiol. 69:1456–1475 [DOI] [PMC free article] [PubMed] [Google Scholar]
- 12. McDonagh R, Fedorova ND, Crabtree J, Yu Y, Kim S, Chen D, Loss O, Cairns T, Goldman G, Armstrong-James D, Haynes K, Haas H, Schrettl M, May G, Nierman WC, Bignell E. 2008. Sub-telomere directed gene expression during initiation of invasive aspergillosis. PLoS Pathog. 4:e1000154 doi:10.1371/journal.ppat.1000154 [DOI] [PMC free article] [PubMed] [Google Scholar]
- 13. Andes D, Lopak A, Pitula A, Marchillo K, Clark J. 2005. A simple approach for estimating gene expression in Candida albicans directly from a systemic infection site. J. Infect. Dis. 192:893–900 [DOI] [PubMed] [Google Scholar]
- 14. Enjalbert B, MacCallum D, Odds FC, Brown AFP. 2007. Niche-specific activation of the oxidative stress response by the pathogenic fungus Candida albicans. Infect. Immun. 75:2143–2151 [DOI] [PMC free article] [PubMed] [Google Scholar]
- 15. Brown AJP, Odds FC, Gow NAR. 2007. Infection-related gene expression in Candida albicans. Curr. Opin. Microbiol. 10:307–313 [DOI] [PubMed] [Google Scholar]
- 16. Wilson D, Thewes S, Zakikhany K, Fradin C, Albrecht A, Almeida R, Brunke S, Grosse K, Martin R, Mayer F, Leonhardt I, Schild L, Seider K, Skibbe M, Slesiona S, Waechtler B, Jacobsen I, Hube B. 2009. Identifying infection-associated genes of Candida albicans in the postgenomic era. FEMS Yeast Res. 9:688–700 [DOI] [PubMed] [Google Scholar]
- 17. Sherman F. 1991. Getting started with yeast. Methods Enzymol. 194:3–21 [DOI] [PubMed] [Google Scholar]
- 18. Lorenz MC, Bender JA, Fink GR. 2004. Transcriptional response of Candida albicans upon internalization by macrophages. Eukaryot. Cell 3:1076–1087 [DOI] [PMC free article] [PubMed] [Google Scholar]
- 19. Tsai H-F, Sammons LR, Zhang X, Suffis SD, Su Q, Myers TG, Marr KA, Bennett JE. 2010. Microarray and molecular analyses of the azole resistance mechanism in Candida glabrata oropharyngeal isolates. Antimicrob. Agents Chemother. 54:3308–3317 [DOI] [PMC free article] [PubMed] [Google Scholar]
- 20. Fradin C, De Groot P, MacCallum D, Schaller N, Klis F, Odds FC, Hube B. 2005. Granulocytes govern the transcriptional response, morphology and proliferation of Candida albicans in human blood. Mol. Microbiol. 56:397–415 [DOI] [PubMed] [Google Scholar]
- 21. Rubin-Bejerano I, Fraser I, Grisafi P, Fink GR. 2003. Phagocytosis by neutrophils induces an amino acid deprivation response in Saccharomyces cerevisiae and Candida albicans. Proc. Natl. Acad. Sci. U. S. A. 100:11007–11012 [DOI] [PMC free article] [PubMed] [Google Scholar]
- 22. Roetzer A, Gregori C, Jennings AM, Quintin J, Ferrendon D, Butler G, Kuchler K, Ammerer G, Schüller C. 2008. Candida glabrata environmental stress response involves Saccharomyces cerevisiae Msn2/5 othologous transcription factors. Mol. Microbiol. 69:603–620 [DOI] [PMC free article] [PubMed] [Google Scholar]
- 23. Rouillon A, Barbey R, Patton EE, Tyers M, Thomas D. 2000. Feedback-regulated degradation of the transcriptional activator Met4 is triggered by the SCF(Met30) complex. EMBO J. 19:282–294 [DOI] [PMC free article] [PubMed] [Google Scholar]
- 24. Roetzer A, Klopf E, Gratz N, Marcet-Houben M, Hiller E, Rupp S, Gabaldón T, Kovarik P, Schüller C. 2011. Regulation of Candida glabrata oxidative stress is adapted to host environment. FEBS Lett. 585:319–327 [DOI] [PMC free article] [PubMed] [Google Scholar]
- 25. Brünke S, Hübe B. 2013. Two unlike cousins: Candida albicans and C. glabrata infection strategies. Cell. Microbiol. doi:10.1111/cmi.12091 [DOI] [PMC free article] [PubMed] [Google Scholar]
- 26. Tsai H-F, Bard M, Izumikawa K, Krol AA, Sturm AM, Culbertson NT, Pierson CA, Bennett JE. 2004. Candida glabrata erg1 mutant with increased sensitivity to azoles and low oxygen tension. Antimicrob. Agents Chemother. 48:2483–2489 [DOI] [PMC free article] [PubMed] [Google Scholar]
- 27. Oku M, Sakai Y. 2010. Peroxisomes as dynamic organelles: autophagic degradation. FEBS J. 277:3289–3294 [DOI] [PubMed] [Google Scholar]
- 28. Lorenz MC, Fink GR. 2001. The glyoxylate cycle is required for fungal virulence. Nature 412:83–86 [DOI] [PubMed] [Google Scholar]
- 29. Till A, Lakhani R, Burnett S, Subramani S. 2012. Pexophagy: the selective degradation of peroxisomes. Int. J. Cell Biol. 2012:512721. [DOI] [PMC free article] [PubMed] [Google Scholar]
- 30. Miyazaki T, Inamine T, Yamauchi S, Nagayoshi Y, Saijo T, Izumikawa I, Seki M, Kakeya H, Yamamoto Y, Yanagihara K, Miyazaki Y, Kohno S. 2011. Role of the Slt2 mitogen-activated protein kinase pathway in cell wall integrity and virulence in Candida glabrata. FEMS Yeast Res. 11:449–456 [DOI] [PubMed] [Google Scholar]
- 31. Manjithaya R, Jain S, Farre J-C, Subramani S. 2010. A yeast MAPK cascade regulated pexophagy but not other autophagy pathways. J. Cell Biol. 189:303–310 [DOI] [PMC free article] [PubMed] [Google Scholar]
- 32. Cuéllar-Cruz M, Biones-Martin-del-Campo M, Cañas-Villamar I, Montalvo-Arredondo J, Riego-Ruiz L, Castaño I, de las Peñas A. 2008. High resistance to oxidative stress in the fungal pathogen Candida glabrata is mediated by a single catalase, Cta1p, and is controlled by the transcription factors Yap1p, Skn7p, Msn2p, and Msn4p. Eukaryot. Cell 7:814–825 [DOI] [PMC free article] [PubMed] [Google Scholar]


