

Abstract
Xanthine oxidase (XO), also known as xanthine oxidoreductase, has long been considered an important host defense molecule in the intestine and in breastfed infants. Here, we present evidence that XO is released from and active in intestinal tissues and fluids in response to infection with enteropathogenic Escherichia coli (EPEC) and Shiga-toxigenic E. coli (STEC), also known as enterohemorrhagic E. coli (EHEC). XO is released into intestinal fluids in EPEC and STEC infection in a rabbit animal model. XO activity results in the generation of surprisingly high concentrations of uric acid in both cultured cell and animal models of infection. Hydrogen peroxide (H2O2) generated by XO activity triggered a chloride secretory response in intestinal cell monolayers within minutes but decreased transepithelial electrical resistance at 6 to 22 h. H2O2 generated by XO activity was effective at killing laboratory strains of E. coli, commensal microbiotas, and anaerobes, but wild-type EPEC and STEC strains were 100 to 1,000 times more resistant to killing or growth inhibition by this pathway. Instead of killing pathogenic bacteria, physiologic concentrations of XO increased virulence by inducing the production of Shiga toxins from STEC strains. In vivo, exogenous XO plus the substrate hypoxanthine did not protect and instead worsened the outcome of STEC infection in the rabbit ligated intestinal loop model of infection. XO released during EPEC and STEC infection may serve as a virulence-inducing signal to the pathogen and not solely as a protective host defense.
INTRODUCTION
Xanthine oxidase (XO), also known as xanthine oxidoreductase (XOR) and xanthine dehydrogenase (XDH), has long been considered an important host defense molecule in the liver, intestine, and breastfed infants (1–3). In this report, we will use the traditional name xanthine oxidase (XO), intending this name to encompass all the various chemical reactions this enzyme can catalyze. XO is expressed in epithelial cells of the gastrointestinal (GI) tract and is secreted in large amounts in milk, where it is localized to the external surface of fat globules. XO is also abundant in liver and expressed in the cornea. XO is not abundant in lung or brain and is present in serum at low levels except after liver or intestinal injury.
We previously showed that enteropathogenic Escherichia coli (EPEC) infection triggers the release of ATP from host cells and that this ATP is broken down to ADP, AMP, and adenosine. We wished to determine if the catabolic pathway extended to produce inosine and purines such as hypoxanthine, xanthine, and uric acid (Fig. 1). In our initial experiments with cultured T84 cells, we were surprised to observe that infection with EPEC, but not EPEC mutants or commensal E. coli, triggered release of uric acid into the culture supernatants, achieving uric acid concentrations up to 200 μM. Later, we observed similar high levels of uric acid in intestinal fluids recovered from rabbits infected with EPEC and Shiga-toxigenic E. coli (STEC) using the ligated intestinal loop model of infection. Exploration of the origin of the uric acid pointed to a role for xanthine oxidase which was later confirmed by the detection of XO activity in intestinal fluids from infected, but not uninfected, intestinal segments. Since hydrogen peroxide is another reaction product of XO, we wondered if H2O2 so produced affected either the pathogenic bacteria or host cells and found that the answer was yes for both. For example, relevant concentrations of XO plus hypoxanthine also significantly affected the production of Stx from STEC strains, confirming previous reports by Wagner et al. (4), Los et al. (5), and our own laboratory using H2O2 (6).
Fig 1.

Biochemical reactions in the pathway for catabolism of nucleosides and purines. Uricase is absent in humans, great apes, and Dalmatian dogs but present in other mammals and birds, as well as many microbes.
H2O2 produced from XO also affected host intestinal tissues, with effects on chloride ion secretion over the short term (10 to 30 min), while decreasing transepithelial electrical resistance (TER) at later times (6 to 9 h) and affecting the ability of Stx to translocate across a confluent monolayer of T84 cells.
Last, we tested the effects of adding exogenous XO plus hypoxanthine substrate on STEC infection in vivo and found that several parameters of infection were worsened, not improved, by this increased flux through the XO pathway.
The role of XO in the gut may be more complex than previously thought, and XO activation may be a signal, or a generator of signals, from the host to the pathogen which upregulates virulence.
MATERIALS AND METHODS
Bacterial strains used.
Bacterial strains used are shown in Table 1.
Table 1.
Bacterial strains used
| Strain group and name | Serotypea | Comment | Reference |
|---|---|---|---|
| EPEC strains | |||
| E2348/69 | O127:H6 | Classic or typical wild-type EPEC | 37 |
| JCP88 | O119:B14 | Classic or typical wild-type EPEC | 38 |
| B171-8 | O111:NM | Classic or typical wild-type EPEC | 39 |
| JPN15 | EAF(−); plasmid-cured derivative of E2348/69 | 40 | |
| Commensal and laboratory E. coli strains | |||
| HS | O9:H4 | Normal commensal E. coli | 37 |
| DH5α | —; K-12 | Laboratory E. coli strain | 41 |
| Human STEC strains | |||
| Popeye-1 | O157:H7 | U.S. spinach-associated outbreak strain, Stx2 only; Stx2a, Stx2c | 6 |
| EDL933 | O157:H7 | Stx1+, Stx2+ | 42 |
| Rabbit strains | |||
| E22 | O103:H2 | Virulent rabbit EPEC strain | 43 |
| E22-stx2 | O103:H2 | E22 transduced with phage 933W encoding Stx2 | 6 |
| Anaerobes | |||
| Bacteroides fragilis | NA | Clinical isolate, bloodstream, Erie County Medical Center | |
| Bacteroides thetaiotaomicron | NA | Microbiologics, St. Cloud, MN | ATCC 29741 |
—, no O serotype because the strain lacks O antigens; NA, not applicable.
Xanthine oxidase, hypoxanthine, uric acid, allopurinol, and oxypurinol were purchased from Sigma (St. Louis, MO). Uricase was from Worthington Biochemicals (Freehold, NJ).
T84 cell culture.
T84 cells were grown as previously described (7).
Uric acid assay.
Uric acid was measured using a kit from Bioassay Systems, Inc. (Hayward, CA), according to the instructions of the manufacturer. As recommended in the instructions, samples were subjected to filtration through a 10,000 molecular weight (MW) cutoff (10K MWCO) filter before assay. Spin Filter 10K filters were from VWR (Radnor, PA). This step was helpful in removing hemoglobin from bloody samples, such as loop fluids. Uric acid concentrations in mg/dl were converted to micromolar units (μmol/liter) by multiplying by 59.5. Uric acid concentrations are shown in units of μmol/liter or mg/liter.
Xanthine oxidase assay.
XO activity was measured by monitoring the conversion of hypoxanthine to uric acid as described previously (8) except that uric acid was measured using the kit method described previously rather than by UV spectrometry. However, most of the loop fluid samples already contained uric acid before the assay even began. Therefore, uric acid production was calculated as the increase in uric acid between the diluted sample incubated with hypoxanthine and the same sample incubated without hypoxanthine. This difference was termed the Δ[uric acid]. Standard conditions were to dilute the sample 3-fold in HEPES-buffered saline and then incubate with and without hypoxanthine substrate at 37°C for 3 h with 600-rpm shaking on a BioShake iQ heater block (Bulldog Bio, Portsmouth, NH). Incubations were done in the top chamber of 10K MWCO filters fitted in Eppendorf tubes. The reaction was terminated by centrifugation at 16,000 × g in a desktop centrifuge for 5 min and then assaying the filtrate for uric acid. We tested whether adding NADH would increase the apparent enzyme activity and found that in most cases it did not, although it occasionally produced a 10 to 20% increase in uric acid production. We assumed, therefore, that the loop fluids also contain enough NADH for the reaction to proceed.
Assays for inhibition of bacterial growth.
Effects of XO on bacterial growth were calculated by measuring turbidity, measured as the optical density at 600 nm (OD600), in 96-well plates incubated at 37°C. Growth assays were done in LB, Dulbecco's modified Eagle medium (DMEM), or minimal medium. In this study, minimal medium was defined as M9 salts plus 2% Casamino acids and 2 mM glucose. Bacteria for the assay were grown overnight in LB medium and then diluted 1:100 into the wells of the 96-well plate. Hypoxanthine and/or XO was added immediately, and growth was measured at various time intervals. In more-recent experiments, we have begun covering the plates with sterile, gas-permeable sealer film and shaking at 600 rpm on the BioShake iQ shaker/heater block.
Ussing chamber measurements of chloride secretion.
Ussing chamber measurements of chloride secretion, measured as short-circuit current, were as previously described (9). T84 cells for Ussing chamber experiments were grown on 12-mm Snap-Well inserts (Corning Costar, Corning, NY).
Measurements of transepithelial electrical resistance.
TER was measured on polarized T84 cells grown to confluence on 12-mm Transwell inserts with a 3.0-μm pore size. TER was measured using an Evom2 instrument (World Precision Instruments, Sarasota, FL) with the Stx2 chopstick-type electrode. T84 cells generally required 8 to 9 days in culture to reach a high level of resistance (700 to 1,200 Ω). TER experiments were performed after a change to serum-free medium (DMEM/F-12 plus 18 mM NaHCO3).
Stx translocation assays.
Stx translocation assays were performed using T84 cells grown in Transwell inserts as described above. Monolayers were treated with XO plus hypoxanthine, and the reaction was allowed to proceed for 3 h before Stx was added to the upper chamber only of the Transwell inserts. The Stx added was in the form of a sterile filtrate of a culture supernatant of STEC strain Popeye-1, yielding 58,990 pg/ml of Stx2 in the upper chamber. Samples of the culture medium from the lower chamber were collected at various times after the xanthine oxidase treatment, and Stx2 was measured by enzyme immunoassay (EIA).
Stx toxin assay by EIA.
Shiga toxin was assayed using enterohemorrhagic E. coli (EHEC) Premier EIA kits from Meridian Bioscience (Cincinnati, OH). Quantitation of Stx was aided by the kind gift of Stx1 and Stx2 toxoids from Allison Weiss, Department of Microbiology, University of Cincinnati.
Ligated intestinal loop infection experiments in rabbits.
Animal experiments were approved by the institutional animal care and use committee (IACUC) of the University at Buffalo. Ten-centimeter loops of ileum were tied into segments as previously described (10) and infected with either human EPEC strain E2348/69, rabbit EPEC strain E22, or rabbit STEC strain E22-stx2 using an inoculum of 2 × 10⁸ to 5 × 10⁸ CFU/loop.
Hemoglobin assay.
Hemoglobin was measured by a colorimetric method using a kit from Cayman Chemical (Ann Arbor, MI). Human hemoglobin was used for the standard curve in this assay.
Data analysis and statistics.
Error bars shown are standard deviations. Significance testing was by analysis of variance (ANOVA) using the Tukey-Kramer posttest for multiple comparisons. Significance was at a P value of <0.05 unless otherwise stated. To avoid unnecessary clutter, not every significant difference on graphs is marked with an asterisk.
RESULTS
In previous work, we observed that EPEC infection resulted in the release of adenosine into the intestinal lumen at concentrations up to 30 to 40 μM in rabbits (11). We wondered if adenosine was the end of the line metabolically or if nucleoside catabolism continued further with production of inosine or other metabolites (Fig. 1). While trying to develop assays for inosine, we were surprised to find that high levels of uric acid were readily detectable in the supernatants of cultured cells infected with EPEC (Fig. 2).
Fig 2.

Release of uric acid into supernatant medium of cultured T84 cells in response to EPEC infection. (A) Comparison of uric acid release between commensal E. coli strain HS, wild-type EPEC strain E2348/69, and the plasmid-cured derivative of E2348/69, JPN15. *, significantly greater than JPN15. (B) Effect of increasing multiplicity of infection (MOI) on uric acid released from cultured T84 monolayers by infection with Salmonella enterica serotype Enteritidis, EPEC JCP88, and E. coli HS. (C) Effect of the xanthine oxidase inhibitors allopurinol and oxypurinol on EPEC-induced uric acid release from T84 cells. *, significantly increased compared to the uninfected control; **, significantly decreased compared to JCP88 without allopurinol. uninf, uninfected.
Figure 2A shows that in response to infection with EPEC E2348/69, uric acid levels in the supernatant medium rose to ∼200 μM concentrations within 6 h of infection. The plasmid-cured derivative of that strain, JPN15, which is defective in adherence and ability to inflict host cell damage, showed significantly less uric acid release, as did the normal commensal E. coli strain HS. Figure 2B shows that the uric acid release increased with increasing multiplicity of infection (MOI) for EPEC (strain JCP88) as well as for Salmonella enterica serotype Enteritidis. E. coli HS failed to release much uric acid even at high MOIs. We also observed that infection with Aeromonas hydrophila or treatment of cells with A. hydrophila culture supernatants containing aerolysin also released uric acid from host cells at levels similar to those for S. enterica (data not shown). A. hydrophila was tested because Fujii et al. had previously shown that this pathogen also releases ATP from host cells (12).
Figure 2C shows that the EPEC-induced uric acid release was inhibited by allopurinol, showing that the catalytic activity of xanthine oxidase was involved in the uric acid generation. Oxypurinol also inhibited uric acid with potency similar to that of allopurinol (data not shown).
To further pursue the findings shown in Fig. 2, we assayed uric acid levels in the intestinal loop fluid recovered from rabbits infected with EPEC. In this model, 10-cm loops of ileum are ligated and then infected by injection of bacteria directly into the loop. A total of 20 h later, the loop fluids are recovered and analyzed. Figure 3A shows that uric acid concentrations were significantly higher in loops infected with EPEC than in neighboring loops from the same animal that were left uninfected (buffered saline control). We also measured uric acid in serum of non-surgically altered rabbits infected orally with rabbit EPEC strain E22 and found that serum uric acid levels rose significantly 7 days postinfection compared to serum from the same rabbit before infection (Fig. 3B). The rise in uric acid in serum suggests that some of the uric acid produced in the intestine may be carried away by the bloodstream; therefore, the rise in uric acid in the loop fluid (Fig. 3A) may underestimate the true extent of uric acid production. The results of Fig. 3A and B indicated that the rise in uric acid production seen in cultured T84 cells was also observed in an animal model.
Fig 3.

Release of uric acid and xanthine oxidase activity into intestinal loop fluids and serum after infection of rabbits with EPEC E22 or rabbit STEC E22-stx2. (A) Comparison of the uric acid contents of uninfected and EPEC E22-infected ligated rabbit intestinal loops after a 20-h infection. Each line segment represents the uric acid from an uninfected and an infected intestinal loop fluid from the same animal. (B) Increase in serum uric acid in non-surgically altered rabbits infected orally with strain E22 for 7 days compared with levels in the same animal preinfection. (C) Detection of xanthine oxidase (XO) activity in intestinal loop fluids from infected, but not uninfected, ligated ileal loops. XO activity of 6 pairs of intestinal loop fluid samples from 6 rabbits. Uninfected and infected loops shown in adjacent bars as pairs of loop fluids are from the same animal. The first 3 pairs on the left show data from experiments in which some loops were infected with EPEC E22, and the pairs on the right side are from 3 animals for which some loops were infected with STEC E22-stx2. Although asterisks are omitted, in each case, the XO activity was significantly higher in the infected loop than in the uninfected loop fluid. In 5 of 6 cases, the uninfected loop fluid XO activity was a negative number, i.e., uric acid was not generated but instead disappeared in the uninfected loop fluids during the assay, presumably due to uricase activity.
Figure 3C shows that in addition to uric acid itself, fluid from infected loops contained XO activity and was able to generate uric acid ex vivo when supplied with hypoxanthine as the substrate. Figure 3C shows XO activity in pairs of uninfected and infected loop fluid from 6 different animals, 3 of which were infected with rabbit EPEC strain E22 and 3 of which were infected with rabbit STEC E22-stx2. None of the uninfected loop fluids contained significant amounts of XO activity; in fact, 5 of 6 uninfected samples actually showed disappearance of uric acid during the assay (i.e., a negative number on the graph). The loss of uric acid in the uninfected rabbit fluids may be the result of the enzyme uricase, which rabbits and most mammals, unlike humans, great apes, and Dalmatian dogs, possess (Fig. 1). Loop fluids from both EPEC-infected and STEC-infected loops contained significant amounts of XO activity, even after cells and debris were removed by centrifugation, sterile filtration, or both. When the XO activity observed in Fig. 3C was calculated in terms of XO activity units (1 unit is the amount of enzyme needed to convert 1 μmol of hypoxanthine to uric acid per minute), the XO activity was less than 0.01 U/ml of loop fluid, or about one-twentieth of that present in unpasteurized bovine milk (13).
Xanthine oxidase activity generates hydrogen peroxide as well as uric acid (Fig. 1), and the peroxide produced is considered the basis of its antimicrobial properties (2). It seemed counterintuitive that EPEC and STEC would trigger the release of an enzyme, XO, that can produce potentially lethal amounts of H2O2. Therefore, we investigated the effects of XO on bacteria.
Figure 4 shows the effects of exogenous XO on bacterial growth and virulence. In pilot experiments, it was difficult to demonstrate bacterial growth inhibition at low concentrations of XO, so the amount of XO was increased to 1 U/ml. In Fig. 4A to C, the XO concentration was held constant (at 1 U/ml) and the concentration of hypoxanthine substrate was varied over a 500-fold range, from 2 μM to 1,000 μM. Figure 4A shows that no inhibition of EPEC growth was observed with XO plus adenosine or XO plus inosine, but growth was inhibited in the presence of hypoxanthine (see Fig. 1). Figure 4B compares the susceptibilities of 3 E. coli strains to growth inhibition by XO plus hypoxanthine. Growth of the laboratory E. coli strain DH5α was inhibited with a 50% inhibitory concentration (IC50) of ∼4 μM hypoxanthine, while EPEC strains B171-8 and E2348/69 showed hypoxanthine IC50s of ∼50 and 400 μM, respectively. In other words, EPEC E2348/69 was 100 times more resistant to growth inhibition than strain DH5α in this assay. The laboratory E. coli strain HB101 behaved like DH5α, and STEC strains EDL933 and Popeye-1 behaved like E2348/69 in this assay (data not shown). Full inhibition of growth in this assay was accompanied by sterilization of the culture, i.e., no regrowth was observed when contents of inhibited wells were subcultured on fresh medium.
Fig 4.

Effects of xanthine oxidase and hypoxanthine on bacterial growth and on Stx production in STEC. (A to C) Graphs of bacterial growth, measured as OD600 values, in response to XO and various concentrations of hypoxanthine or other nucleosides. The x axis in panels A to C is the logarithm of the nucleoside or purine concentration, in moles/liter (M). (A) Growth inhibition in the presence of XO plus hypoxanthine, but not XO plus other nucleosides, on EPEC E2348/69. (B) Comparison of the susceptibilities of 3 strains of E. coli to growth inhibition by various concentrations of hypoxanthine in the presence of a fixed concentration of XO, 1 U/ml. (C) Inhibition of growth under anaerobic conditions in thioglycolate medium for three bacterial strains. (D to F) Effect of XO with or without hypoxanthine on Stx production from human STEC strain Popeye-1 (O157:H7, Stx2 only). (D) Although asterisks are omitted, Stx in the supernatant medium was significantly higher in the presence of XO than in its absence for all 3 concentrations of hypoxanthine tested. (E) Reversal of Stx induction by H2O2-neutralizing agents. A total of 1 U/ml XO and 400 μM hypoxanthine were used. Catalase (added to a final concentration of 600 U/ml) and glutathione (final concentration of 5 mM) reversed the inducing effect of hypoxanthine plus XO. *, significantly less Stx than with hypoxanthine plus XO. (F) Effect of varying the amount of XO in the presence of a fixed concentration of hypoxanthine. *, significant compared to the no-hypoxanthine control for each amount of XO. hypo, hypoxanthine.
EPEC infection in vivo is heaviest in the ileum and cecum, and STEC most heavily infects the cecum and colon. Since the cecum and colon are anaerobic environments, we tested the ability of XO plus hypoxanthine to inhibit the growth of the representative anaerobes Bacteroides fragilis and Bacteroides thetaiotaomicron. Figure 4C shows the results of these growth experiments, carried out in thioglycolate medium under anaerobic conditions. Under these conditions, no growth inhibition of EPEC E2348/69 was observed whatsoever. DH5α was inhibited with a hypoxanthine IC50 of 320 μM, while B. thetaiotaomicron was inhibited with a hypoxanthine IC50 of 2 μM, 160 times lower; the growth curve of catalase-positive B. fragilis was similar to that of DH5α. Since E2348/69 growth was not inhibited, no IC50 can be calculated for EPEC from Fig. 4C. However, if we use DH5α as a bridge or benchmark between the aerobic and anaerobic assays (Fig. 4B and C), we can estimate that B. thetaiotaomicron is roughly 16,000 times more susceptible to killing by XO and hypoxanthine than is EPEC E2348/69. However, the concentrations of XO and hypoxanthine required for killing of EPEC and STEC in this in vitro assay far exceeded what we actually observed in cultured cells or in rabbit loop fluids (Fig. 3C). Based on Fig. 3 and 4, the amount of XO and its substrate actually released in response to EPEC and STEC infection did not appear to be large enough to inhibit EPEC or STEC growth.
Although XO and hypoxanthine levels did not appear sufficient to kill or inhibit growth of EPEC or STEC, we and others (4, 5) have observed strong effects of hydrogen peroxide on Stx production from STEC at peroxide concentrations well below the lethal range. We tested whether XO and hypoxanthine affected Stx production from STEC strains Popeye-1 (Fig. 4D to F) and EDL933 (results were similar and are not shown). Figure 4D shows that hypoxanthine alone did not stimulate Stx2 production and, in fact, inhibited Stx2 release compared to that of the control. In the presence of XO, however, Stx2 production was significantly increased in a dose-dependent manner with increasing hypoxanthine. Figure 4E shows that the addition of either catalase or glutathione (an antioxidant) effectively reversed the induction of Stx2 observed with XO plus hypoxanthine. This is evidence that it is indeed the H2O2 being produced by XO that is responsible for the induction of the toxin. Figure 4F shows that XO at levels as low as 0.15 U/ml significantly induced Stx2, but only when hypoxanthine was also added as a reaction substrate. Figure 4D to F show that subinhibitory concentrations of XO and hypoxanthine have strong biological effects on STEC in vitro. These effects require the catalytic activity of XO and are mediated via the reaction product of XO, H2O2. The results of Fig. 4 show that XO activity generated in EPEC and STEC infection is unlikely to be sufficient to inhibit the growth of the pathogens themselves but is probably sufficient to inhibit growth of the anaerobic microbiota and is probably sufficient to trigger induction of Stx production in STEC.
In addition to effects on bacteria, H2O2 produced by xanthine oxidase may have important effects on host cells. Nguyen and Canada reported that H2O2 triggered a chloride secretory response in T84 cells studied in the Ussing chamber (14). Electrogenic chloride secretion is the mechanism underlying the outpouring of diarrheal fluid seen in many important pathogens, such as Vibrio cholerae and enterotoxigenic E. coli (ETEC) (15). Since the basis for the watery diarrhea produced by EPEC and STEC is poorly understood, we thought H2O2 production by XO might be relevant to EPEC and STEC pathogenesis.
Figure 5 shows that T84 cell monolayers studied in the Ussing chamber did show a short-circuit current (Isc), representing chloride secretion, in response to both 1 mM H2O2 and XO plus 1 mM hypoxanthine. Isc peaked at ∼10 μA/cm2, followed by a slow decline. After exposure to either H2O2 or XO and hypoxanthine, monolayers demonstrated a hyporesponsiveness to other secretory agonists, such as forskolin, in agreement with the observations of Nguyen and Canada (tracings not shown). Figure 5B shows that hypoxanthine alone triggered a very small, ∼2-μA/cm2 increase in Isc; this small rise may be due to endogenous XO activity in the T84 cells but was not investigated further due to the small magnitude of the effect. Figure 5C shows the dose-response relationship of Isc to increasing concentrations of hypoxanthine. The dose-response curve to hypoxanthine resembled that of hydrogen peroxide in both the half-maximal concentration of agonist required and the maximal secretory response. Figure 5D shows that the secretory response triggered by XO and hypoxanthine was blocked if catalase was added at the beginning of the experiment (gray tracing in Fig. 5D). When XO and hypoxanthine were allowed to trigger a short-circuit current, this response was promptly reversed when catalase was added later (black tracing in Fig. 5D, black arrow). As described above, the reversal of secretion by catalase shows that the chloride secretion is being triggered by enzymatic production of H2O2 and not merely by protein-protein interaction, cell or receptor binding, or other nonenzymatic mechanisms involving XO.
Fig 5.

Effects on hypoxanthine plus XO on short-circuit current, electrical resistance, and Stx translocation in polarized T84 cell monolayers studied in the Ussing chamber. Short-circuit current (Isc) represents chloride secretion toward the apical (mucosal or lumenal) side of the tissue in this configuration. (A) Comparison of the short-circuit current triggered by 1 mM hypoxanthine plus XO (black tracing) with that triggered by 1 mM H2O2 (gray tracing), showing similar peak currents and similar offsets of secretion. (B) Hypoxanthine alone, without added XO, triggered a very small short-circuit current of ∼2 μA/cm2. (C) Dose-response relationship between the amount of hypoxanthine added and the short-circuit current; mean ± standard deviation (SD) of 3 tracings per concentration. (D) Effect of catalase on short-circuit current triggered by hypoxanthine plus XO. When 1,200 U/ml catalase was added simultaneously with hypoxanthine and XO (arrow 1, gray tracing), the secretory response was prevented. When hypoxanthine and XO were added first (black arrow) and a current was allowed to develop, subsequent addition of catalase (2nd black arrow) promptly reversed the secretion. (E) Effect of hypoxanthine (hypo) and XO on transepithelial electrical resistance 6 h after addition of hypoxanthine, XO, or both. *, significantly decreased compared to the control and to XO alone. (F) Effect of hypoxanthine (hypoxanth) plus XO on Stx translocation across T84 cell monolayers. T84 cells were grown to confluence in Transwell inserts, reaching a mean initial TER value of 1,648 Ω. Hypoxanthine and XO were added to the apical side of the monolayers, followed by Stx2 3 h later. The amount of Stx2 detectable in the lower basolateral chamber was measured at various times after the start of the experiment. *, significant compared to the control, DMSO vehicle, and XO alone.
The electrophysiologic effects of XO plus hypoxanthine, shown in Fig. 5A to D, were all at early time points (40 min or less after addition). We also tested whether XO plus hypoxanthine might trigger damage at later times and found that, indeed, XO plus hypoxanthine triggered a large decrease in transepithelial electrical resistance (TER) at 6 h (Fig. 5E). TER is a marker of tight junction integrity and barrier function of the monolayer, and a drop in TER might affect several important functions, including migration of neutrophils and malabsorption of nutrients (16, 17). Figure 5F shows that XO plus hypoxanthine increased translocation of Stx toxin across T84 cell monolayers in the apical-to-basolateral direction. Stx translocation lagged behind the changes in TER so that Stx in the lower chamber continued to increase long after the nadir in resistance, i.e., Stx in the lower chamber increased even after the monolayer began to recover in resistance. At 9 h, the amount of Stx2 measured in the lower chamber in wells treated with XO and hypoxanthine was 7.9% of that added to the upper wells at the beginning of the experiment (Fig. 5F). Stx2 concentrations in the lower wells continued to increase through 22 h, by which time 20.3% of the Stx had reached the lower wells treated with XO and hypoxanthine, compared to undetectable amounts in the control and dimethyl sulfoxide (DMSO) vehicle wells (data not shown). T84 cells are not killed by Stx1 or Stx2 since they do not express the neutral glycolipid Gb3, which is the receptor for the Shiga toxins.
Figure 4 shows strong effects of XO and hypoxanthine in vitro on bacteria, and Fig. 5 shows effects of XO and hypoxanthine on cultured cells, but we also wished to know if these effects would be observed in vivo. Figure 6 shows the effect of adding exogenous XO with or without hypoxanthine on the outcome of infection with rabbit STEC in vivo in the ligated ileal loop assay. Figure 6A and B compared the gross appearances of the intestinal loops after 20 h of infection. The loops infected with E22-stx2 alone were distended with fluid but remained normal in appearance (Fig. 6A). Figure 6B shows that one of two loops receiving E22-stx2 plus XO and hypoxanthine showed necrotic mottling (left black arrow). Histological examination of the tissues was consistent with the gross appearance (worsening in the presence of XO plus hypoxanthine; photographs not shown). We noticed that loop fluids from this experiment differed in their bloody character. Figure 6C shows the results of a hemoglobin assay on loop fluids after centrifugation to remove intact cells. Adding XO with STEC reduced the hemoglobin concentrations observed in the fluid, but adding XO and 400 μM hypoxanthine increased the amount of hemoglobin compared to that with STEC and XO. Figure 6D shows that loops receiving XO or XO plus hypoxanthine along with the pathogen showed a trend toward increased fluid accumulation. Although the increase in loop fluid did not reach statistical significance, the trend appears consistent with the prosecretory effects of XO and hypoxanthine observed in T84 monolayers in Fig. 5. Addition of exogenous XO and hypoxanthine along with STEC also did not diminish the number of pathogenic bacteria recovered from loop fluid at the end of infection (Fig. 6E), consistent with the resistance of these bacteria to killing by XO, as shown in Fig. 4. The amount of Stx2 measured in loop fluid at the end of infection, however, was significantly increased by XO and hypoxanthine compared to that with E22-stx2 alone. Again, this is consistent with the increase in Stx produced by STEC in response to XO and hypoxanthine in Fig. 4D to F. To summarize, the in vivo results in Fig. 6 are consistent with the in vitro data shown in Fig. 4 and 5. In vivo, addition of exogenous XO (to 1 U/ml) plus 400 μM hypoxanthine did not achieve increased antibacterial activity (Fig. 6E) but did result in worsening of infection, including the necrotic gross appearance, bloodier fluid, worsened histology, and increased Stx production in vivo. The findings in Fig. 4 to 6 suggest that for certain resistant pathogens, such as EPEC and STEC, the intestinal xanthine oxidase pathway may not generate sufficient antibacterial activity to inhibit growth of the pathogen. The XO pathway does appear, however, to serve as a signal from the host to the pathogen, enhancing production of Stx and perhaps other virulence traits.
Fig 6.

Effects of exogenous XO and hypoxanthine on the outcome of STEC infection in a ligated rabbit ileal loop model of infection. Ten-centimeter segments of ileum were ligated as described in Materials and Methods and infected with 4 × 10⁸ CFU of rabbit STEC E22-stx2 plus XO and hypoxanthine. Twenty hours after infection, loops were collected and photographed and the contents were analyzed. (A) Gross appearance of an ileal loop infected with E22-stx2 but without any other additives, showing distention with fluid but absence of necrosis. (B) One of 2 intestinal loops receiving E22-stx2 plus XO and hypoxanthine (hypoxnth) showed overt necrotic mottling (loop 6, left arrow), while the other loop showed only one small spot of necrosis at the site of the injection (right arrow). (C) Hemoglobin concentrations in loop fluids were assayed after centrifugation of the samples at 16,000 × g for 10 min to remove intact cells and debris. In the presence of STEC bacteria, addition of 1 U/ml XO seemed to reduce the bloody character of the loop fluids, but this did not reach statistical significance. *, in the presence of STEC, XO, and 400 μM hypoxanthine, hemoglobin in the loop fluids was significantly higher than that with the pathogen and XO. (D) Fluid secretion into the loops, as measured by the volume-to-length ratio. hypo, hypoxanthine. (E) Comparison of the numbers of bacteria recovered from each loop (expressed as the logarithm of the number of bacteria recovered per loop), showing the lack of any decrease in CFU in loops receiving hypoxanthine (hypo) and XO. (F) Shiga toxin protein (Stx) content of the loops by enzyme immunoassay, expressed in ng per loop. *, significantly increased compared to E22-stx2 alone. hypo, hypoxanthine.
DISCUSSION
Our laboratory has been interested in the role in pathogenesis of the adenine nucleotides, nucleosides, and purines generated from the breakdown of ATP during EPEC and STEC infection (18). While trying to develop assays for adenosine, inosine, and other downstream products of purine catabolism (Fig. 1), we discovered that high concentrations of uric acid were released into the supernatant medium of cultured cells and into the lumen of intestinal loops infected with EPEC (Fig. 2 and 3). This increase in uric acid is not unique to EPEC and STEC, since it is also observed in response to infection with Salmonella enterica (Fig. 2B) and Aeromonas hydrophila (data not shown). The rise in uric acid was also evident in the serum of EPEC-infected rabbits. Palla et al. noted that serum uric acid was elevated in a subset of children with acute gastroenteritis, especially those diagnosed with rotavirus, adenovirus, or Salmonella as the etiology (19, 20). The hyperuricemia persisted even after dehydration had been reversed by rehydration; EPEC and STEC were not tested for in that clinical series. Since that early report, the finding of elevated uric acid levels in rotavirus gastroenteritis has been confirmed by others (21) and extended to also include children with postdiarrheal hemolytic-uremic syndrome (HUS) (22). In some cases, serum uric acid levels in HUS exceed 20 mg/dl (200 mg/liter, or more than 3 times the upper limit of normal), leading to speculation that urate nephropathy might add insult to the injury induced by Shiga toxin itself (23). In virtually all of the reports of hyperuricemia in infectious gastroenteritis, the authors were at a loss to explain the mechanism of the increased uric acid levels except to invoke possible “oxidative stress responses.” A pathogenic feature common between EPEC, STEC, rotavirus, and non-Typhi Salmonella infections is lytic damage to enterocytes, resulting in liberation of intracellular contents into the intestinal lumen. ATP, DNA, and RNA released into the lumen would be broken down by nucleases and nucleotidases normally present in the intestine and generate uric acid that can be reabsorbed into the bloodstream. We believe that our data provide a cell biological mechanism for the hyperuricemia that has been often observed, but not well explained, over the past decades. Serum uric acid levels should be measured more often in infectious diarrheal illness, since this inexpensive test may provide a clue to the etiologic agent responsible.
Xanthine oxidase has been widely recognized as a key host defense molecule over many decades (24), but its protective role has been best studied in milk and lactation (1, 3, 8), with much less research on the role of endogenous intestinal XO after weaning (25, 26). XO is more abundant in milk than in any other tissue or body fluid and is at especially high levels in colostrum and early milk (3). Members of the Enterobacteriaceae (including E. coli strains such as EPEC and STEC) and Salmonella enterica are more resistant to killing by XO than other bacteria (Fig. 4) (27). Other research groups have noted the potent effects of H2O2 on STEC virulence but assumed that the H2O2 derives from the NADPH oxidase of neutrophils (4, 5). In contrast to neutrophils, which must be recruited to the intestinal lumen in response to infection, XO is constitutively expressed in intestinal epithelial cells (2). Therefore, it is reasonable to think that H2O2 generated via XO may appear more quickly after infection than that produced by the neutrophil respiratory burst.
The role of XO-generated H2O2 as a potential mediator of a fluid secretory response in the intestine has not received much attention in the microbial pathogenesis field despite reports in the physiology literature (14, 28). H2O2 joins ATP and adenosine as the third identified soluble mediator produced in response to EPEC and STEC infection which is capable of stimulating chloride ion and fluid secretion in intestinal cells.
It appears unlikely that the levels of XO present in the intestine or released in response to infection are sufficient to curtail EPEC and STEC growth. Instead of killing STEC, hydrogen peroxide generated by XO appears to be a signal that the pathogen can use to sense the presence of the host and to upregulate its virulence. Molecules produced and released by the host, such as ethanolamine (29), norepinephrine (30), and adenosine (11), are increasingly recognized as potent regulators of pathogen virulence. XO and its enzymatic product H2O2 appear to qualify as such interkingdom signals.
While XO appears not to be able to generate sufficient H2O2 to kill pathogenic E. coli, it may produce enough to seriously perturb the normal microbiota, especially anaerobic and microaerophilic microbes (Fig. 4C). The anaerobic microbiota of the gut, and of B. thetaiotaomicron in particular, secretes soluble factors that inhibit Stx production (31). Elimination of anaerobic microbes via H2O2 would be another mechanism by which XO regulates virulence.
Because of the many possible deleterious effects of XO activity shown in this report (Fig. 4 to 7), one wonders if the intermediate amounts of XO activity present in the intestine leave the host in a worse condition than if there were no XO at all. Is having a little bit of XO activity, like a little bit of knowledge, a dangerous thing? Figure 7 questions whether, in the context of infection with EPEC and STEC, there is a danger zone in the middle range of XO expression in the gut. If so, intermediate amounts of XO activity might place host defenses in an “uncanny valley” in which the outcome would be worse than that at either extreme. The concept of the uncanny valley was proposed by Masahiro Mori, computer scientist and roboticist, in a prescient essay in 1970 (32). In Fig. 7, the term uncanny valley is being used not to refer to a human-like robot but in the way that a familiar host defense system, xanthine oxidase, suddenly seems unfamiliar and strange in light of new data. If an uncanny valley does exist for XO, a disease other than EPEC and STEC infection for which the valley might manifest itself is necrotizing enterocolitis (NEC), a serious gastrointestinal condition that occurs in premature newborns. Xanthine oxidase has been suggested as a contributing factor in the pathogenesis of this multifactorial condition (33). Human and animal trials for NEC provide support for interventions to both inhibit XO activity (administering allopurinol) (34) and increase XO activity, such as early introduction of human milk (35). Administration of probiotics in NEC is another intervention which would make sense in light of Fig. 4C.
Fig 7.
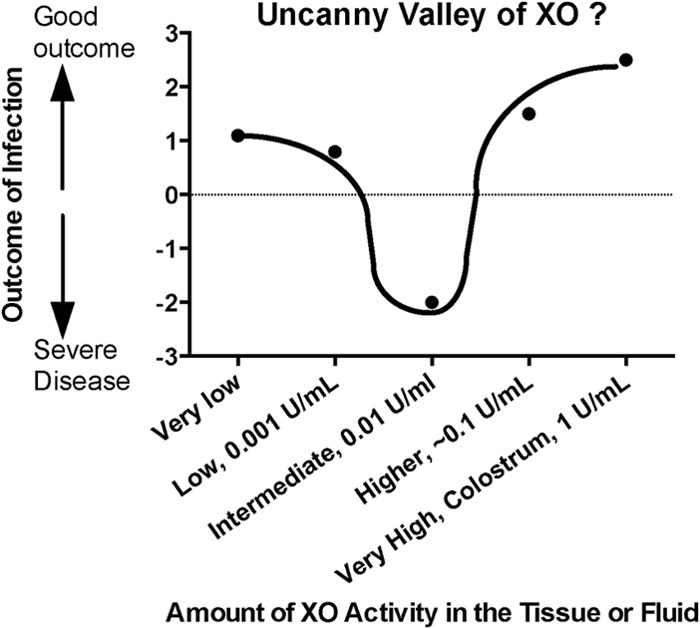
Hypothetical graph questioning the possibility of an uncanny valley of XO activity in which an intermediate amount of XO activity might be worse for the host than no XO activity (left side of curve) or high XO activity (right side of curve). The concept of the uncanny valley was proposed by Masahiro Mori in an essay in 1970 and is adapted here to microbial pathogenesis.
The results of this paper should not be construed as a criticism of breastfeeding, especially in areas of high diarrhea prevalence. The data in support of breastfeeding being protective against enteric and diarrheal pathogens are very strong, and breast milk contains many antimicrobial factors in addition to xanthine oxidase, including immunoglobulins, lactoferrin, and a vast array of oligosaccharides with antimicrobial effects (36).
In summary, XO appears to have signaling functions in the intestine that may be just as important as the host defense properties emphasized in earlier reports and reviews. Understanding the role of XO might help devise strategies to prevent or treat the severe complications of STEC infection, a subject that has been of interest to us and others (6).
ACKNOWLEDGMENTS
We thankfully acknowledge the financial support of the National Institutes of Health, National Institute of Allergy and Infectious Diseases (NIAID), through grants RO1 AI 081528 and R21 AI 102212.
Footnotes
Published ahead of print 22 January 2013
REFERENCES
- 1. Hancock J, Salisbury V, Ovejero-Boglione M, Cherry R, Hoare C, Eisenthal R, Harrison R. 2002. Antimicrobial properties of milk: dependence on presence of xanthine oxidase and nitrite. Antimicrob. Agents Chemother. 46:3308–3310 [DOI] [PMC free article] [PubMed] [Google Scholar]
- 2. Martin H, Hancock J, Salisbury V, Harrison R. 2004. Role of xanthine oxidoreductase as an antimicrobial agent. Infect. Immun. 72:4933–4939 [DOI] [PMC free article] [PubMed] [Google Scholar]
- 3. Stevens C, Millar T, Clinch J, Kanczler J, Bodamyali T, Blake D. 2000. Antibacterial properties of xanthine oxidase in human milk. Lancet 356:829–830 [DOI] [PubMed] [Google Scholar]
- 4. Wagner PL, Acheson DWK, Waldor MK. 2001. Human neutrophils and their products induce Shiga toxin production by enterohemorrhagic Escherichia coli. Infect. Immun. 69:1934–1937 [DOI] [PMC free article] [PubMed] [Google Scholar]
- 5. Los JM, Los M, Wêgrzyn A, Wêgrzyn G. 2010. Hydrogen peroxide-mediated induction of the Shiga toxin-converting lambdoid prophage ST2-8624 in Escherichia coli O157:H7. FEMS Immunol. Med. Microbiol. 58(3):322–329 [DOI] [PubMed] [Google Scholar]
- 6. Crane JK, Byrd IW, Boedeker EC. 2011. Virulence inhibition by zinc in Shiga-toxigenic Escherichia coli. Infect. Immun. 79:1696–1705 [DOI] [PMC free article] [PubMed] [Google Scholar]
- 7. Crane J, Shulgina I, Naeher T. 2007. Ecto-5′-nucleotidase and intestinal ion secretion by enteropathogenic Escherichia coli. Purinergic Signal. 3:233–246 [DOI] [PMC free article] [PubMed] [Google Scholar]
- 8. Harrison R. 2006. Milk xanthine oxidase: properties and physiological roles. Int. Dairy J. 16(6):546–554 [Google Scholar]
- 9. Crane J, Choudhari S, Naeher T, Duffey M. 2006. Mutual enhancement of virulence by enterotoxigenic and enteropathogenic Escherichia coli. Infect. Immun. 74:1505–1515 [DOI] [PMC free article] [PubMed] [Google Scholar]
- 10. Crane J, Naeher T, Shulgina I, Zhu C, Boedeker E. 2007. Effect of zinc in enteropathogenic Escherichia coli infection. Infect. Immun. 75:5974–5984 [DOI] [PMC free article] [PubMed] [Google Scholar]
- 11. Crane JK, Shulgina I. 2009. Feedback effects of host-derived adenosine on enteropathogenic Escherichia coli. FEMS Immunol. Med. Microbiol. 57(3):214–228 [DOI] [PMC free article] [PubMed] [Google Scholar]
- 12. Fujii Y, Nomuar T, Yokoyama R, Shinoda S, Okamoto K. 2003. Studies on the mechanism of action of the aerolysin-like hemolysin of Aeromonas sobria in stimulating T84 cells to produce cyclic AMP. Infect. Immun. 71:1557–1560 [DOI] [PMC free article] [PubMed] [Google Scholar]
- 13. Demott B, Praepanitchai O. 1978. Influence of storage, heat, and homogenization upon xanthine oxidase activity of milk. J. Dairy Sci. 61:164–167 [DOI] [PubMed] [Google Scholar]
- 14. Nguyen TD, Canada AT. 1994. Modulation of human colonic T84 cell secretion by hydrogen peroxide. Biochem. Pharmacol. 47(2):403–410 [DOI] [PubMed] [Google Scholar]
- 15. Field M, Graf LH, Jr, Laird WJ, Smith PL. 1978. Heat-stable enterotoxin of Escherichia coli: in vitro effects on guanylate cyclase activity, cyclic GMP concentration, and ion transport in small intestine. Proc. Natl. Acad. Sci. U. S. A. 75:2800–2804 [DOI] [PMC free article] [PubMed] [Google Scholar]
- 16. Canil C, Rosenshine I, Ruschkowski S, Donnenberg M, Kaper J, Finlay B. 1993. Enteropathogenic Escherichia coli decreases the transepithelial electrical resistance of polarized epithelial monolayers. Infect. Immun. 61:2755–2762 [DOI] [PMC free article] [PubMed] [Google Scholar]
- 17. Philpott DJ, McKay DM, Sherman PM, Perdue MH. 1996. Infection of T84 cells with enteropathogenic Escherichia coli alters barrier and transport functions. Am. J. Physiol. 270(4):G634–G645 [DOI] [PubMed] [Google Scholar]
- 18. Crane J, Olson R, Jones H, Duffey M. 2002. Release of ATP during host cell killing by enteropathogenic E. coli and its role as a secretory mediator. Am. J. Physiol. Gastrointest. Liver Physiol. 283:G74–G86 [DOI] [PubMed] [Google Scholar]
- 19. Palla G, Ughi C, Graziano AVC, Maggiore G, Ventura A. 1996. Serum uric acid elevations in viral enteritis. Pediatr. Infect. Dis. J. 15:642–643 [DOI] [PubMed] [Google Scholar]
- 20. Palla G, Ughi C, Cesaretti G, Ventura A, Maggiore G. 1997. “Automatic” diagnosis of viral enteritis. J. Pediatr. 130:1013. [DOI] [PubMed] [Google Scholar]
- 21. Kovacs A, Hotrakitya C, Overturf G, Portnoy B. 1987. Rotavirus gastroenteritis. Am. J. Dis. Child. 141:161–166 [DOI] [PubMed] [Google Scholar]
- 22. Kaplan B, Thomson P. 1976. Hyperuricemia in the hemolytic-uremic syndrome. Am. J. Dis. Child. 130(8):854–856 [DOI] [PubMed] [Google Scholar]
- 23. O'Regan S, Rousseau E. 1988. Hemolytic uremic syndrome: urate nephropathy superimposed on an acute glomerulopathy? An hypothesis. Clin. Nephrol. 30:207–210 [PubMed] [Google Scholar]
- 24. Massey V, Harris CM. 1997. Milk xanthine oxidoreductase: the first one hundred years. Biochem. Soc. Trans. 25(3):750–755 [DOI] [PubMed] [Google Scholar]
- 25. Segal BH, Sakamoto N, Patel M, Maemura K, Klein AS, Holland SM, Bulkley GB. 2000. Xanthine oxidase contributes to host defense against Burkholderia cepacia in the p47phox−/− mouse model of chronic granulomatous disease. Infect. Immun. 68:2374–2378 [DOI] [PMC free article] [PubMed] [Google Scholar]
- 26. Umezawa U, Akaike T, Fujii S, Suga M, Setoguchi K, Ozawa A, Maeda H. 1997. Induction of nitric oxide synthesis and xanthine oxidase and their roles in the antimicrobial mechanism against Salmonella typhimurium infection in mice. Infect. Immun. 65:2932–2940 [DOI] [PMC free article] [PubMed] [Google Scholar]
- 27. Yamada Y, Saito H, Tomioka H, Jidoi J. 1987. Susceptibility of micro-organisms to active oxygen species: sensitivity to the xanthine-oxidase-mediated antimicrobial system. J. Gen. Microbiol. 133:2007–2014 [DOI] [PubMed] [Google Scholar]
- 28. Schultheiss G, Hennig B, Diener M. 2008. Sites of action of hydrogen peroxide on ion transport across rat distal colon. Br. J. Pharmacol. 154:991–1000 [DOI] [PMC free article] [PubMed] [Google Scholar]
- 29. Kendall MM, Gruber CC, Parker CT, Sperandio V. 2012. Ethanolamine controls expression of genes encoding components involved in interkingdom signaling and virulence in enterohemorrhagic Escherichia coli O157:H7. mBio 3(3):e00050–00012. doi:10.1128/mBio.00050-12 [DOI] [PMC free article] [PubMed] [Google Scholar]
- 30. Vlisidou I, Lyte M, van Diemen PM, Hawes P, Monaghan P, Wallis TS, Stevens MP. 2004. The neuroendocrine stress hormone norepinephrine augments Escherichia coli O157:H7-induced enteritis and adherence in a bovine ligated ileal loop model of infection. Infect. Immun. 72:5446–5451 [DOI] [PMC free article] [PubMed] [Google Scholar]
- 31. de Sablet T, Chassard C, Bernalier-Donadille A, Vareille M, Gobert AP, Martin C. 2009. Human microbiota-secreted factors inhibit Shiga toxin synthesis by enterohemorrhagic Escherichia coli O157:H7. Infect. Immun. 77:783–790 [DOI] [PMC free article] [PubMed] [Google Scholar]
- 32. Mori M. 1970. The uncanny valley. Energy 7(4):33–35 [Google Scholar]
- 33. Hsueh W, DePlaen I, Caplan MS, Qu X-W, Tan X-D, Gonzalez-Crussi F. 2007. Neonatal necrotizing enterocolitis: clinical aspects, experimental models, and pathogenesis. World J. Pediatr. 3(1):17–29 [Google Scholar]
- 34. Krasna IH, Lee RT. 1993. Allopurinol protects the bowel from necrosis caused by indomethacin and temporary intestinal ischemia in mice. J. Pediatr. Surg. 28:1175–1177 [DOI] [PubMed] [Google Scholar]
- 35. Sisk P, Lovelady C, Dillard R, Gruber K, O'Shea T. 2007. Early human milk feeding is associated with a lower risk of necrotising enterocolitis in very low birth weight infants. J. Perinatol. 27:428–433 [DOI] [PubMed] [Google Scholar]
- 36. Morrow AL, Ruiz-Palacios GM, Altaye M, Jiang X, Lourdes Guerrero ML, Meinzen-Derr JK, Farkas T, Chaturvedi P, Pickering LK, Newburg DS. 2004. Human milk oligosaccharides are associated with protection against diarrhea in breast-fed infants. J. Pediatr. 145(3):297–303 [DOI] [PubMed] [Google Scholar]
- 37. Levine M, Nalin D, Hornick R, Bergquist E, Waterman D, Young C, Sotman S, Rowe B. 1978. Escherichia coli strains that cause diarrhea but do not produce heat-labile or heat-stable enterotoxins and are not invasive. Lancet i:1119–1122 [DOI] [PubMed] [Google Scholar]
- 38. Rothbaum R, McAdams A, Giannella R, Partin J. 1982. A clinicopathologic study of enterocyte-adherent Escherichia coli: a cause of protracted diarrhea in infants. Gastroenterology 83:441–454 [PubMed] [Google Scholar]
- 39. Puente JL, Bieber D, Ramer SW, Murray W, Schoolnik GK. 1996. The bundle-forming pili of enteropathogenic Escherichia coli: transcriptional regulation by environmental signals. Mol. Microbiol. 20:87–100 [DOI] [PubMed] [Google Scholar]
- 40. Jerse A, Yu J, Tall B, Kaper J. 1990. A genetic locus of enteropathogenic Escherichia coli necessary for the production of attaching and effacing lesions on tissue culture cells. Proc. Natl. Acad. Sci. U. S. A. 87:7839–7843 [DOI] [PMC free article] [PubMed] [Google Scholar]
- 41. Meselson M, Yuan R. 1968. DNA restriction enzyme from E. coli. Nature 217:1110–1114 [DOI] [PubMed] [Google Scholar]
- 42. Perna NT, Plunkett G, Burland V, Mau B, Glasner JD, Rose DJ, Mayhew GF, Evans PS, Gregor J, Kirkpatrick HA. 2001. Genome sequence of enterohaemorrhagic Escherichia coli O157: H7. Nature 409:529–533 [DOI] [PubMed] [Google Scholar]
- 43. Milon A, Oswald E, De Rycke J. 1999. Rabbit EPEC: a model for the study of enteropathogenic Escherichia coli. Vet. Res. 30:203–219 [PubMed] [Google Scholar]