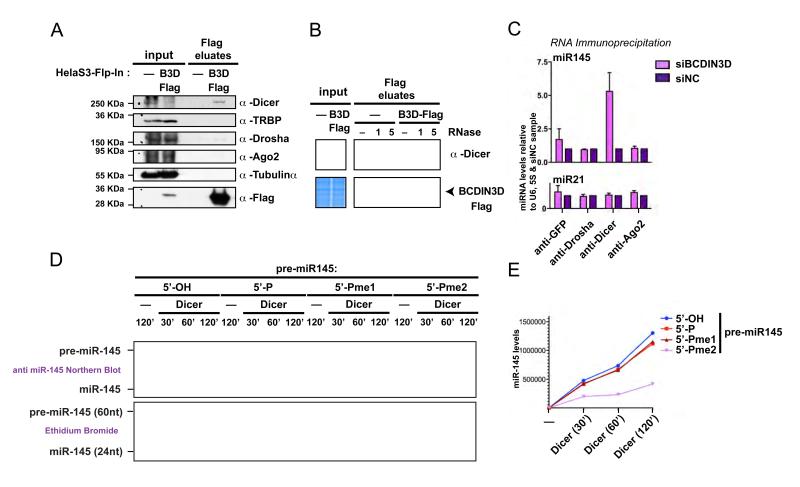
Figure 6. BCDIN3D interacts with Dicer and its depletion affects miR-145 association with Dicer.
(A) BCDIN3D specifically interacts with Dicer. Flag eluates from isogenic HELA-S3-Flp-In (-) and HELA-S3-Flp-In-BCDIN3D-Flag (BCDIN3D-Flag) stable cell lines co-immunoprecipitated with an anti Flag Antibody were analyzed by Western Blotting with the indicated antibodies (see Extended Experimental Procedures for further detail). (B) The interaction between BCDIN3D and Dicer is sensitive to treatment with RNase A. Flag co-Ips were performed as in (A) in the presence of mock or 1 or 5 %l of RNAse A (see Extended Experimental Procedures for further detail). The co-IPs were analyzed by Coomassie Staining to confirm equal recovery of BCDIN3D (lower panel) and by Western Blot with the Dicer antibody (upper panel). (C) Upon BCDIN3D depletion, the association of Dicer with miR-145, the product of pre-miR-145 processing, is significantly increased. MCF-7 cells transfected with siBCDIN3D or siNC were subjected to RNA-immunoprecipitation with the indicated antibodies (see Extended Experimental Procedures for further detail). RNA from the immunoprecipitates was purified and the levels of miR-21 and miR-145 were analyzed by qRT-PCR. The data are normalized to the 5S and U6 RNAs and to siNC cells. Error bars represent SEM values. (D-E) Synthetic pre-miR-145 molecules that have [5′-OH], [5′-P], [5′-Pme1] or [5′-Pme2] 5′ ends were incubated with human Dicer or Mock at 1mM of MgCl2 for 30, 60 or 120 min as indicated (see Extended Experimental Procedures for further detail). The Dicer processing reactions were loaded on a 15% Urea-PAGE gel and stained with Ethidium Bromide. The gel was photographed with the Chemidoc XRS+ system from Biorad (D, lower panel) and analyzed by Northern Blot with an anti-miR-145 probe (D, upper panel). The miR-145 product was quantified using the Image Lab Software (E).
See also Figure S7.

