

Abstract
Variation of probe immobilization on microarrays hinders the ability to make high quality, assertive and statistically relevant conclusions needed in the healthcare setting. To address this problem, we have developed a calibrated, compact, inexpensive, multiplexed, dual modality point-of-care detection platform that calibrates and correlates surface probe density measured label-free to captured labeled secondary antibody, is independent of chip-to-chip variability, and improves upon existing diagnostic technology. We have identified four major technological advantages of our proposed platform: the capability to perform single spot analysis based on the fluorophore used for detection, a 10-fold gain in fluorescence signal due to optimized substrate, a calibrated, quantitative method that uses the combined fluorescent and label-free modalities to accurately measure the density of probe and bound target for a variety of systems, and a compact measurement platform offering reliable and rapid results at the doctor’s office. Already, we have formulated over a 90% linear correlation between the amount of probe bound to surface and the resulting fluorescence of captured target for IgG, β-lactoglobulin, Ara h 1 peanut allergen, and Phl 5a Timothy grass allergen.
I. Introduction
Reproducibility issues in microarrays are receiving more attention as technologies mature for clinical applications, which require a high degree of validity and reliability [1]-[3]. Label-based procedures have been developed to account for variation in probe deposition and binding to the surface in order to visualize the printed slides prior to experimentation [4]-[8]. Although these techniques verify the presence of uniformly bound probe, they may potentially negatively affect the activity of the probe, fail to quantify amount of bound probe on surface, and may alter physiochemical properties. Recently, an approach that utilizes a phototonic crystal biosensor surface and a high resolution label-free imaging detection instrument to formulate prehybridization images of spotted nucleic acid array was recently reported as a sensitive method of quality control [9]. However, asides from being a tool for only DNA microarray quality control, this method solely rates the spot as being suitable or unsuitable for analysis and does not offer the quantified amount of bound probe to secondary antibody required in the field of clinical and medical diagnostics.
Our label-free technology, the Interferometric Reflectance Imaging Sensor (IRIS), is a quantitative, high-throughput, simple, robust, and versatile technology used for multiplexed detection of DNA and proteins with high sensitivity [12]-[16]. We have combined the IRIS platform with a new enhanced fluorescence technology, creating a novel device by combining the sensitivity of fluorescence with the quantitative accuracy of IRIS: the Calibrated Fluorescence Enhancement (CaFE) platform. The CaFE platform uses its two modalities, label-free and fluorescence imaging, to address microarray reproducibility issues by quantifying the initial bound probe. The innovation relies on having both of these regions with identical surface preparation and ensuring that both regions bind the capture molecules simultaneously. This feature allows the use of specialized polymeric coatings (copoly(DMA-NAS-MAPS) [17], [18]) to covalently link capture agents to the surface, while maintaining high functionality and preventing non-specific binding. Systems utilizing a capture probe to quantify specific interacting partners would benefit from the CaFE platform. Examples include but are not limited to: detecting the presence of allergen-specific IgE for allergy diagnosis; the presence of hepatitis antibodies in liver disease, measurement of anti-HIV antibodies, and the presence of autoantibodies monitored in rheumatologic disease.
To optimize fluorescence over a broad range of fluorophores and label-free modalities, we have fabricated chips that have “islands” of 500nm oxide and 100nm oxide. First, the probes spotted on the 500nm region are measured to quantify the immobilized probe density. This information is then used to calibrate and quantify the signal observed in the enhanced fluorescence region. In protein and peptide microarrays, there was an observed improvement factor of 10x for optimized SiO2 thickness (~100nm) over conventional glass slides [19]. Recently, this CaFE chip was shown to be of practical use and high utility to the microarray development process by allowing the opportunity to check spotting morphology and facilitate optimization conditions for protein solubility and binding [20].
To achieve the single spot analysis, we have performed simulations modeling a fluorophore as a dipole emitter on a planar, dielectric surface [21] in order to design a single thickness oxide on silicon chip capable of both fluorescence and label-free measurement. We have optimized these simulations for Cy3 and Cy5 emitters.
II. Materials and Methods
A. Silicon chip microfabrication
The combination 500nm and 100 nm SiO2 chips with bare silicon reference were fabricated using photolithography patterning processes and wet etching. Wafers of 500 nm thermally grown SiO2 on a silicon substrate were purchased from Silicon Valley Microelectronics (Santa Clara, CA). Acetone sonication for 10 minutes and oxygen plasma ashing at 300sccm and 500W for 10mins were used to remove organic residue on the surface. Hexamethyldisilazane (HMDS) and Shipley S1818 positive resist were spun onto the surface at 2krpm for 30 seconds. The chip was exposed for 30s at 15mW and then developed for 45 seconds in the SUSS Mask Aligner MA6 and Micro-Dev resist developer, respectively, to form the bare silicon reference pattern. The exposed region of the wafer was etched 500 nm submerged in BOE 6:1. Fluorescence islands were etched from 500nm to 100nm with BOE 6:1 diluted 1:40 with DI. Finally, the resist was striped to reveal a chip with label-free and enhanced fluorescence SiO2 regions to the reflectance curve.
B. Reagents and equipments
TRIS, BSA, Tween 20, PBS tablets, rabbit immunoglobulin G, carbonic anhydrase, bovine serum albumin were purchased from Sigma (St. Louis, MO). Rabbit anti-β-lactoglobulin was purchased from Bethyl Laboratories (Montgomery, TX), goat anti-α-lactalbumin from GeneTex Inc (Irvine, CA) and AbCam (Cambridge, UK). Secondary antibodies (Cy3-labelled goat anti-mouse IgG and mouse anti-goat IgG) were purchased from Jackson ImmunoResearch (West Grove, PA) and anti-IgE was purchased from BDBioscences. Allergens Bet v 1a (Bet v 1.0101), Phl p 1 (Phl p1.0101), Phl p 5 (Phl p 5.0101) and Alt a 1 (Alt a 1.0101) were recombinant allergens from Biomay, (Vienna, Austria) and allergens Bet v 2 (Bet v 2.0101), Phl p 7, nDer p 1, nDer p 2 and nFel d 1 were recombinant (or native, when prefix “n” is used) allergens from Indoor Biotechnologies Ltd (Warminster, UK).
Silicon slides were immersed for 30 minutes in a copoly solution (DMA-NAS-MAPS) at 1% concentration in a solution of water and 20% saturated ammonium sulphate. Slides were washed with water and dried at 80°C for 15 minutes. This particular polymeric coating does not change the optical properties of the setup.
C. Self-Calibration Single Spot Analysis Simulations
A radiation model of emitters near a dielectric interface was used to perform simulations comparing the enhancement of 100nm SiO2, 320nm SiO2, and traditional glass over a range of emission wavelengths of commonly used fluorophores (Alexa Fluor® 359, Alexa Fluor® 488, Cy3 dye, Cy5 dye, and Alexa Fluor® 647).
D. IgG and β-lactoglobulin calibration
As proof of concept, 20 replicates IgG and β-lactoglobulin of varying concentrations (0.015, 0.03, 0.063, 0.125, 0.25, and 1 mg/ml) were spotted onto 2 and 3 CaFE chips using a BIORAD Calligrapher Spotter. After overnight humid chamber incubation, the chips were washed with 50 mM ethanolamine in TRIS/HCl 1 M pH 9 for 1 hour, rinsed with water, dried with a stream of argon gas, and then measured using IRIS. They were then incubated with 100 ul of specific labeled antibody in incubation buffer (Tris/HCl 0.05 M pH 7.6, NaCl 0.15 M, Tween 20 0.02%) with 1% w/v BSA for 1 hour at 0.001 mg/ml. Another IRIS measurement was taken after washing with PBS for 10 min, rinsing with water, and drying with argon.
Afterwards, fluorescence evaluation was performed by a fluorescence scanner, GenePix 4000B Microarray Scanner. CaFE slides were analyzed using 39% Photomultiplier (PMT) and 33% laser power. Fluorescence intensities of all 20 spots were averaged.
E. CaFE Implanted as an Allergy Testing Platform
To evaluate CaFE as a clinical diagnostic platform, 9 allergens (peanut (Ara h 1), apple (Mal d 1), shrimp (Pen a 1), timothy grass (Phl p 1), timothy grass (Phl p 5), dust mite (Der p 1), cat (Fel d 1), birch (Bet v 1a), and mold (Alt a 1)) were spotted in replicates of 3 at 4 concentrations (0.25 mg/ml, 0.5 mg/ml, 0.75 mg/ml, and 1.0 mg/ml) on 2 CaFE chips. In addition, PBS and IgG were spotted as negative and positive control parameters. After overnight humid chamber incubation, the chips were washed with 50 mM ethanolamine in TRIS/HCl 1 M pH 9 for 1 hour, washed with water, dried with a stream of argon gas, and then measured using IRIS. The chips were then incubated with 100 ul of documented patient sera allergic to peanut and timothy grass Ph p 1 in incubation buffer with 1% w/v BSA, for 2 hours at 0.001 mg/ml. Slides were then washed with washing buffer for 10 minutes, rinsed with water, and dried with argon gas. After incubating with 0.01 mg/ml anti-IgE labeled with Cy3, the chips were washed with PBS (10 min), rinsed with water, dried with argon, and measured with IRIS.
Scanning for fluorescence evaluation was performed by a Genepix 4000B Microarray Scanner. CaFE slides were analyzed using 90% Photomultiplier (PMT) and laser power. Fluorescence intensities of all 20 spots were averaged.
III. Results and Discussions
A. Self-Calibration Single Spot Analysis Simulations
A radiation model of emitters near a dielectric interface was used to model fluorescence emission enhancement of Cy3 and Cy5 fluorophores on silicon oxide versus glass at varying wavelengths to investigate the feasibility of the single spot analysis (Fig. 1). After investigation, it was determined that an oxide thickness of 320nm would be appropriate to replace the optimized 100nm oxide thickness used in the CaFE chip for Cy3 and Cy5 fluorophores. It is to be noted that if we were to chose to only optimize for Cy3 or for another particular fluorophore, such as Alexa-647, we would chose an alternative oxide thickness to 320nm to best optimize for that particular fluorophore. Thus, if the particular fluorophore to be used in detection is known, we can design our platform for enhanced emission intensity to a level nearly identical to our optimized CaFE chip and analyze the spot with both label-free and labeled measurements.
Fig. 1.

Fluorescence intensity values for SiO2 thicknesses of 100nm and 320nm compared to a microscope slide. Over all wavelengths, 100nm oxide has more than 2-fold emission enhancement compared to glass for a broad range of fluorophores. To compare, 320nm oxide enhances Cy3 and Cy5 emitters about 1.9 times compared to glass.
B. Proof of Concept of Quantification and Calibration using IgG and β-lactoglobulin
To quantify and calibrate the specific secondary antibody for both IgG and β-lactoglobulin, IRIS measurements from the 500 nm oxide island were correlated to one or more 100 nm oxide quadrants (Fig. 2). In both cases, each of the proteins demonstrates a calibrated, linear response between fluorescence and probe density despite chip-to-chip variability with an R2 value greater than 90%. Due to the linear response between the fluorescence signal of the labeled secondary antibody and bound probe, we can extrapolate to calculate the probe concentration on surface. However, the slope depends on the protein; thus, a calibration curve of each protein planned to be used in the diagnostic test would have to be formulated prior to determining immobilized probe on surface. Overall, a strong linear dependence is observed between the labeled secondary target and the bound target on the microarray. Yet, results hint at a possible saturation point at higher concentrations. This trend supports the fact that immobilized probes have finite binding capacity. Thus, CaFE operates optimally at lower concentrations. To conclude, these results support that CaFE is an effective and versatile device to quantify and correlate bound probe to secondary labeled antibody and has potential application in the field of immunodiagnostics.
Fig. 2.

Fluorescence versus bound target to spot label-free measurement for rabbit IgG (left) amd B-lactoglobulin(right). For IgG calibration of Chip 3, Q1 and Q2 analyze spot to spot variability. Results show that CaFE platform yields calibrated, linear responses from chip-to-chip for a variety of proteins.
C. CaFE Implemented as an Allergy Testing Platform
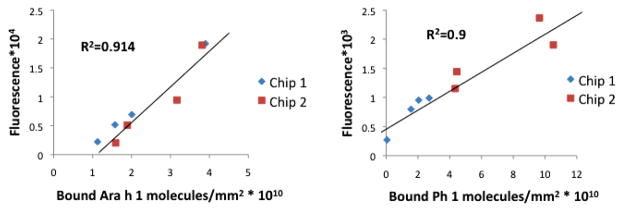
IgG and IgE molecules from patient sera incubation solely bound to peanut Ara h 1 and timothy grass Phl 1 allergens. Binding amounts are provided in supporting materials. When comparing the fluorescence signal from the secondary labeled antibody to the spotting concentration as performed in traditional ELISA and microarray tests, no trend for either peanut or timothy grass allergens that would allow for calibration of quantification of IgE molecules is apparent (Fig. 3a). However, when the fluorescence signal is analyzed with bound probe density outputted by IRIS, a calibrated, linear curve is seen for both peanut and timothy grass allergens (Fig. 3b).
Fig. 3.

Fluorescence versus spotting concentration compared to fluorescence (a) versus serum bound to spot label-free measurement (b). Results show that CaFE platform yields calibrated, linear responses for allergy testing analysis compared to traditional “semi-quantifiable” analysis. For the CaFE measurement of Ph1 Timothy grass allergen, the last point was removed from the calibration due to saturation of bound serum.
This linear trend allows the possibility of creating a calibrated and quantitative tool to diagnose patients with the degree of allergy in a more insightful manner than current methods. Furthermore, and most importantly, when comparing chip-to-chip, the calibration and quantification of bound probe molecules to labeled secondary antibody is maintained (Fig. 4). Due to this result, we can claim that we can offer a method of quality and quantity control for protein microarray technology that does not exist today. Thus, the CaFE platform provides an opportunity to serve as advancement in current immunodiagnostic technology. To note, the calibration curve is dependent on the allergen, as seen previously in the proof of concept studies. Furthermore, it is necessary to comment on the necessity to optimize protein spot morphologies and conditions in order to obtain a clear calibration curve for analysis.
Fig. 4.
Fluorescence signal of labeled IgE versus bound target to spot label-free measurement to investigate calibrating chip-to-chip variability for peanut (left) and timothy grass (right) allergens. Results show that CaFE platform yields calibrated, linear responses despite chip-to-chip for a variety.
D. Conclusions
Quality control and reproducibility are the primary obstacles in utilizing multiplexed testing in microarray format in the field of healthcare and diagnostics. To solve this problem, we have developed the CaFE platform to provide a calibrated technique quantifying fluorescence signal to bound target on surface. We have presented proof-of-concept data showing that IgG antibody and β-lactoglobulin correlated to captured Cy3-labeled secondary antibody as well as data showing that two common and major allergens, peanut and timothy grass, display a linear correlation between enhanced fluorescence signal due to the amount of bound serum to initial allergen on substrate with our IRIS measurement; this relationship is not seen if only fluorescence signal and initial spotting concentration are analyzed. In addition, the CaFE calibration is independent of sample variation seen in current microarray technology, demonstrating the effectiveness of a singular, self-calibrated platform.
Acknowledgments
We thank Carlos A. Lopez and George Daaboul for helpful discussion.
Financial support from the Wallace H. Coulter Foundation 2010 Coulter Translational Award and by the SmartLighting ERC funded via the NSF under Cooperative Agreement EEC-0812056.
Contributor Information
M. R. Monroe, Email: margo520@bu.edu, Biomedical Engineering Department Boston University, Boston, Ma, 02446 USA (386-490-2636)
A. P. Reddington, Email: aredding@bu.edu, Electrical Engineering Department, Boston University, Boston, Ma 02446 USA
M. Cretich, Consiglio Nazionale delle Ricerche, Istituto di Chimica del Riconoscimento Molecolare (ICRM), Milano, Italy
M. Chiari, Consiglio Nazionale delle Ricerche, Istituto di Chimica del Riconoscimento Molecolare (ICRM), Milano, Italy
F. Little, Email: flittle@bu.edu, Pulmony Center at Boston University School of Medicine, Boston, Ma 02118 USA
M. S. Ünlü, Email: selim@bu.edu, Biomedical Engineering, Electrical Engineering, and Physics Departments, Boston University, Boston, Ma 02446 USA.
References
- 1.Shi L, Jones WD, Jensen RV, Harris SC, Perkins RG, Goodsaid FM, et al. The balance of reproducibility, sensitivity, and specificity of lists of differentially expressed genes in microarray studies. BMC Bioinformatics. 2008;9(Suppl 9):S10. doi: 10.1186/1471-2105-9-S9-S10. [DOI] [PMC free article] [PubMed] [Google Scholar]
- 2.Shi L, Perkins RG, Fang H, Tong W. Reproducible and reliable microarray results through quality control: good laboratory proficiency and appropriate data analysis practices are essential. Current Opin Biotech. 2008;19:10–8. doi: 10.1016/j.copbio.2007.11.003. [DOI] [PubMed] [Google Scholar]
- 3.Thompson KL, Hacket J. Quality Control of microarray assays for toxicogenomic and in vitro diagnostic applications. Methods Mol Bio. 2008;460:45–48. doi: 10.1007/978-1-60327-048-9_3. [DOI] [PubMed] [Google Scholar]
- 4.Wilkes T, Laux H, Foy Ca. Microarray data quality: review of current developments. Omics. 2007;11:1–13. doi: 10.1089/omi.2006.0001. [DOI] [PubMed] [Google Scholar]
- 5.Wang X, Jia S, Meyer L, Xiang B, Chen LY, jIang N, Moreno C, Jacob HJ, Ghosh S, Hessner MJ. Comprehensive quality control utilizing the prehybridization third-dye image leads to accurate gene expression measurements by cDNA microarrays. BMC Bioinf. 2006;7:378. doi: 10.1186/1471-2105-7-378. [DOI] [PMC free article] [PubMed] [Google Scholar]
- 6.Diehl F, Grahlmann S, Beier M, Hohesiel JD. Manufacturing DNA microarrays of high spot homogeneity and reduced background signal. Nucleic Acids Res. 2001;29:E38. doi: 10.1093/nar/29.7.e38. [DOI] [PMC free article] [PubMed] [Google Scholar]
- 7.Schabacker DS, Stefanovska I, Gavin I, Pedrak C, Chandler DP. Protein array staining methods for undefined protein content, manufacturing quality control, and performance validation. Anal Biochem. 2006 Dec 1;359(1):84–93. doi: 10.1016/j.ab.2006.08.035. Epub 2006 Sep 22. [DOI] [PubMed] [Google Scholar]
- 8.Hessner MJ, Singh VK, Wang X, Khan S, Tschannen MR, Zahrt TC. Utilization of a labeled tracking oligonucleotide for visualization and quality control of spotted 70-mer arrays. BMC Genomics. 2004;5:12. doi: 10.1186/1471-2164-5-12. [DOI] [PMC free article] [PubMed] [Google Scholar]
- 9.Hessner MJ, Wang X, Hulse K, Meyer L, Wu Y, Nye S, Guo SW, Ghosh S. Three color cDNA microarrays: quantitative assessment through the use of fluorescein-labeled probes. Nucleic Acids Res. 2003;31:e14. doi: 10.1093/nar/gng014. [DOI] [PMC free article] [PubMed] [Google Scholar]
- 10.Wang X, Hessner MJ, Wu Y, Pati N, Ghosh S. Quantitative quality control in microarray experiments and the application in data filtering, normalization and false positive rate prediction. Bioinformatics. 2003;19:1341–1347. doi: 10.1093/bioinformatics/btg154. [DOI] [PubMed] [Google Scholar]
- 11.George S, Block ID, Jones SI, Mathias PC, Chaudhery V, Vuttipittayamongkol P, Wu HY, Vodkin LO, Cunningham BT. Label-free Prehybridization DNA microarray Imaging Using Photonic Crystals for Quantitative Spot Quality Analysis. Anal Chem. 2010;82:8551–8557. doi: 10.1021/ac101551c. [DOI] [PubMed] [Google Scholar]
- 12.Lopez C, Daaboul GG, Vedula RS, Ozkumur E, Bergstein DA, Geisbert TW, Fawcett H, Goldberg BB, Connor JH, Ünlü MS. Label-free multiplexed virus detection using spectral reflectance imaging. Biosensors and Bioelectronics. 2011 doi: 10.1016/j.bios.2011.01.019. [DOI] [PMC free article] [PubMed] [Google Scholar]
- 13.Daaboul GG, Vedula RS, Ahn S, Lopez C, Reddington A, Ozkumur E, Ünlü MS. LED-based Interferometric Reflectance Imaging Sensor for quantitative dynamic monitoring of biomolecular interactions. Biosensors and Bioelectronics. 2010 Nov; doi: 10.1016/j.bios.2. [DOI] [PubMed] [Google Scholar]
- 14.Ozkumur E, Needham JW, Bergstein DA, Gonzalez R, Cabodi M, Gershoni JM, Goldberg BB, Ünlü MS. Label-free and dynamic detection of biomolecular interactions for high-throughput microarray applications. PNAS. 2008;105:7988–7992. doi: 10.1073/pnas.0711421105. [DOI] [PMC free article] [PubMed] [Google Scholar]
- 15.Ozkumur E, Ahn S, Yalcin A, Lopez C, Cevik E, Irani R, DeLisi C, Chiari M, Ünlü MS. Label-free microarray imaging for direct detection of DNA hybridization and single-nucleotide mismatches. Biosensors and Bioelectronics. 2010 Mar 15;25(7):1789–1795. doi: 10.1016/j.bios.2009.12.032. [DOI] [PMC free article] [PubMed] [Google Scholar]
- 16.Ozkumur E, Lopez C, Yalcin A, Connor JH, Chiari M, Ünlü MS. Spectral Reflectance Imaging for a Multiplexed, High-Throughput, Label-Free, and Dynamic Biosensing Platform. IEEE Journal of Selected Topics in Quantum Electronics. 2010 May-Jun;16(3):635–46. [Google Scholar]
- 17.Cretich M, Chiari M, et al. High Sensitivity Protein Assays on Microarray Silicon Slides. Anal Chem. 2009;81:5197–5203. doi: 10.1021/ac900658c. [DOI] [PubMed] [Google Scholar]
- 18.Cretich M, Reddington A, Monroe M, et al. Silicon Biochips for Dual Label-free and Fluorescence Detection: Application to protein Microarray Development. Biosensors and Bioelectronics. 2011 May;26(9):3938–3943. doi: 10.1016/j.bios.2011.03.016. [DOI] [PMC free article] [PubMed] [Google Scholar]
- 19.Research Grant: “Photonics Research and Technology Insertion: Label-free Multi-analyte Biosensors,” PI: Ünlü, Co-PIs: DeLisi and Irani; funded by Army Research Lab through the Photonics Center; Period: July 1, 2007 – June 30, 2010.
- 20.Yalcin A, Damin F, Ozkumur E, di Carlo G, Goldberg BB, Chiari M, Unlu MS. Direct Observation of Conformation of a Polymeric Coating with Implications in Microarray Applications. Analytical Chemistry. 2009;81(2):625–630. doi: 10.1021/ac801954x. [DOI] [PMC free article] [PubMed] [Google Scholar]
- 21.Moiseev L, Cantor CR, Aksun I, Dogan M, Goldberg BB, Swan AK, Ünlü MS. Spectral self-interference fluorescence microscopy. Journal of Applied Physics. 2004 Nov 1;96(9):5311–5315. [Google Scholar]