Abstract
Advances in the development of replacement heart valves require a deeper understanding of the valve dynamics. In the present study, dynamic aortic valve (AV) leaflet geometries were quantified in vitro using a structured laser-light imaging system (Iyengar et al., ABME 29(11):963–973, 2001). Native AV leaflets were first imaged under simulated physiological flow conditions within a rigid glass conduit with simulated anatomic sinuses. Next, the valve/glass conduit combination was removed from the loop and immersed in a 0.625% aqueous glutaraldehyde solution at room temperature for 24 h to produce a bioprosthetic heart valve (BHV). The BHV leaflets were then re-imaged under identical flow conditions while kept in the same position in the glass conduit to minimize artifacts associated with removal/reinsertion of the valve. We observed that: (1) the native leaflet exhibited small, high frequency shifts in shape; (2) the BHV leaflet demonstrated a more stabile shape, as well as focal regions of prolonged, high curvature; (3) the BHV leaflet opened and closed faster by ~10 ms compared to native leaflet; (4) in both the BHV and native states, the AV opened from basal region leading to free edge (5) when closing, both the native and BHV close with both free edge and circumferential together. The high bending observed in the BHV leaflet correlated with known locations of tissue deterioration previously reported in our laboratory. Thus, in order to minimize leaflet tissue damage, methods of chemical modification utilized in BHVs that maintain leaflet flexibility are necessary to minimize the onset and progression of tissue damage. We conclude that leaflet stiffness can have a considerable effect on dynamic valve motion, and can induce deleterious bending behaviors that may be associated with tissue breakdown and valve failure. Moreover, these unique data can provide much needed quantitative information for computational simulation of heart valve leaflet stiffness on heart valve function.
Keywords: Cardiac valve bioprostheses, Imaging, Aortic, Valve, Curvature, Geometry
INTRODUCTION
Bioprosthetic heart valves (BHV) fabricated from biologically derived heterograft biomaterials continue to be the dominant replacement heart valve technology, either as a conventional prosthetic design or more recently utilizing percutaneous delivery.25,29,33 However, while extending the lives of thousands of patients worldwide, BHV are still largely based on empirical designs and involve extensive trial and error testing. Moreover, regardless of the specific design or delivery method, limited long-term fatigue resilience remains major limitation in the durability of any device utilizing these biomaterials.
Leaflet mineralization, with or without leaflet tearing, 31–33 and mechanical fatigue10,26,32,38,40 are two primary fatigue processes. Fatigue damage independent of calcification has been shown to be a cause of structural damage to the leaflets of bioprostheses,27 indicating that tissue structural damage independent of calcification is mechanism of deterioration.9,21,26,27 Moreover, after chemical fixation the entire extracellular matrix is highly bonded, inducing a substantial increase in tissue stiffness in the low strain range,6,15,25,38 as well as essentially eliminating the ability for tissue fiber to slide relative to each other.
We have utilized custom fatigue devices to subject circumferentially oriented porcine BHV tissue strips to controlled cyclic isolated flexural loading (i.e., without tensile loading).17 Results indicated that flexural rigidity was markedly reduced after only 10 × 106 cycles, and progressively decayed at a lower rate with cycle number thereafter. Moreover, the against-curvature fatigue direction induced the most damage, suggesting that the ventricularis and fibrosa layers have low resistance to cyclic flexural compressive and tensile loads, respectively. These results underscored that porcine-derived heterograft biomaterials are very sensitive to flexural fatigue, with delamination of the tissue layers the primary underlying mechanism. The delamination behavior was also similar to those found in accelerated wear tested and in vivo explanted bio-prostheses.21,27,40
Ultimately, heterograft materials are non-viable and by definition have finite durability. However, novel chemical modifications, such as those that retain gly-cosaminoglycans may help in extending durability by mitigating the flexural induced fatigue.6,15,16 While the exact nature of the role of GAGs in cross-linked BHV tissues remains to be elucidated, these studies underscore the need to understand flexural deformations that occur in BHV leaflets over the cardiac cycle.
Existing studies on the deformation and shape of the aortic valve leaflets have previously examined closed valve geometry, either in the unloaded static state35,36 or under quasi-static loading.1,7 Dynamic pericardial BHV strain and geometry have previously examined,13,37 and demonstrated complex deformations and changes in curvatures. We have performed extensive dynamic mitral valve leaflet and annular strain measurements in vivo and in vitro.2,8,23,24 While others have performed extensive studies of the native aortic valve in vitro,39,42 there are no corresponding studies of the effects of leaflet stiffness (either natural or induced by chemical processing) on the dynamic flexure of the aortic heart valve over the complete leaflet surface. Further, the complex solid/fluid interactions complicates efforts at computational modeling, which continue to be limited by inadequate material models and the requisite validation data.4,5,11,14,18–20,41
Our group has developed a structured light projection technique to quantify heart valve dynamic leaflet shape.13 The imaging system generates a matrix of small (~200 µm diameter) laser dots projected onto leaflet surface without physical contact; all mounted in a physiological flow apparatus. The rapidly changing, complex valve geometry justified the need for a high temporal and spatial resolution approach. Further, the use of a non-contacting optical approach assured that there were no restrictions on valve motions and facilitated imaging of the complete leaflet surface.
The goal of the present study was to investigate the flexural deformations that occur in the BHV leaflets over the cardiac cycle using a structured light imaging system13 over the complete cardiac cycle. The mechanical behavior of the component leaflet tissues plays an important role in determining this response over valve function, especially during opening/closing phases. It is thus important to quantify the effects of leaflet mechanical behavior, especially stiffness. To investigate this effect, we developed a study design that allowed each valve to be first imaged in the unmodified native state, chemically processed with an aqueous glutaraldehyde solution, then re-imaged under identical flow conditions. Thus, each valve acted as its own control. The resulting changes in leaflet motion and shape (using a sensitive local surface patch technique to obtain the local surface curvatures) were quantified and implications to prosthetic valve function discussed.
METHODS
Physiological Flow Loop and Leaflet Visualization
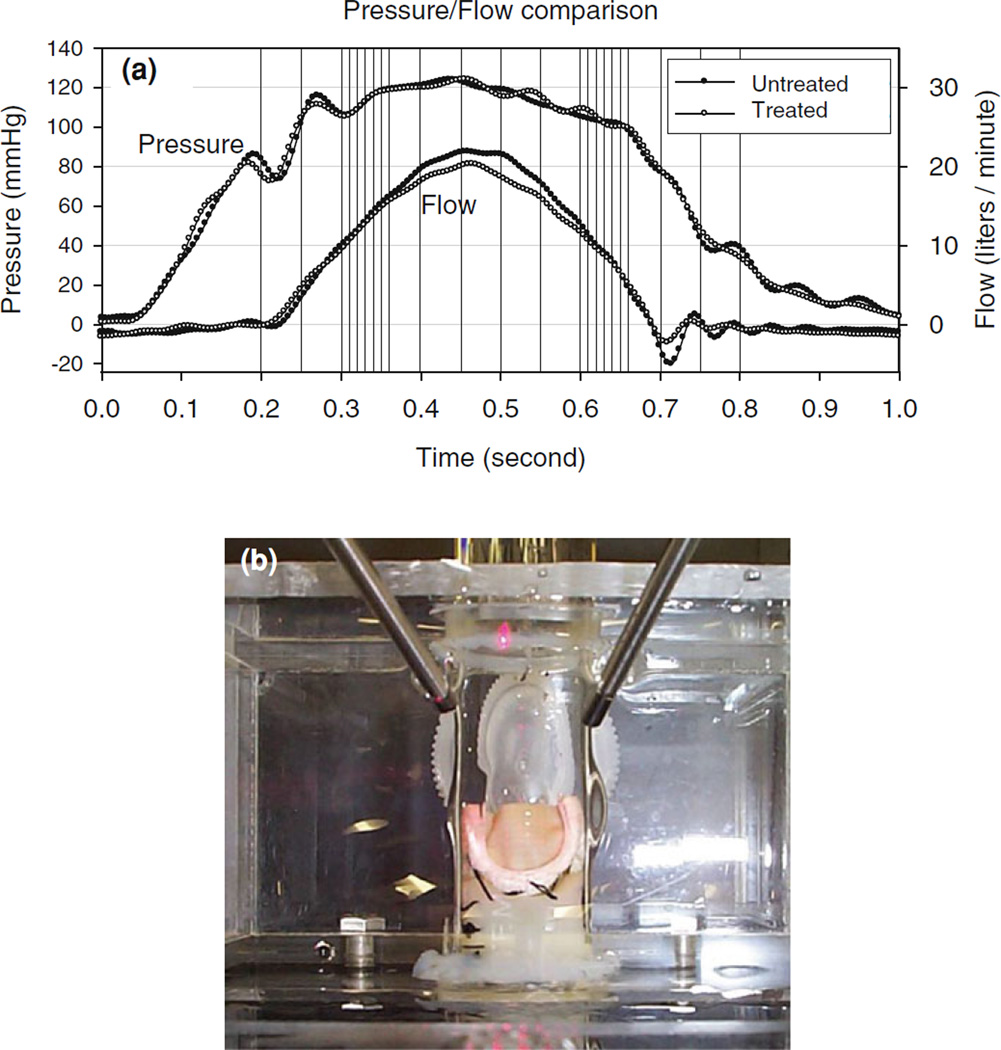
A detailed description of the integrated flow loop imaging system, including the integrated camera/boroscope imaging system, has been previously presented. 13 Briefly, a pulsatile flow loop was used capable of reproducing physiological aortic pressure wave-forms, with normal saline used as the flow loop medium. Flow parameters were set to 60 beats per minute, systolic and diastolic pressures (140 and 80 mmHg, respectively), 5 L per minute simulated cardiac output with a 150 mmH2O atrial reservoir as preload pressure (Fig. 1a).
FIGURE 1.
(a) Representative generated pressure and flow patterns recorded from flow loop, with the vertical lines indicating the image acquisition time points for both native and BHV valve states, showing excellent reproducibility. (b) Overhead image of the valve within the Pyrex conduit shown the boroscope imaging tubes and index matching fluid.
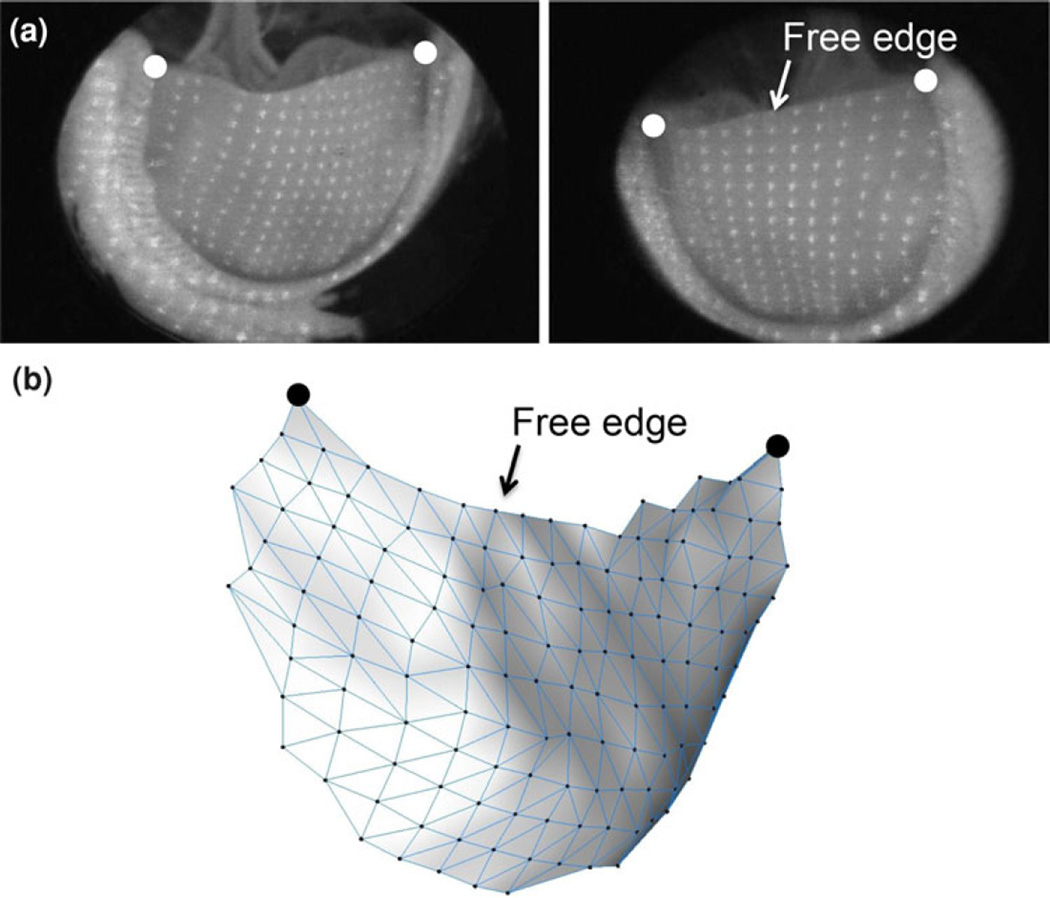
Attached to the flow loop was a structured light projection/dual camera imaging system to 3D reconstruct valve leaflet surface geometry. The system consisted of a 10 mW diode laser outfitted with an optical pattern generator head which illuminated leaflet surfaces for a period of 500 µs using a 19 × 19 dot matrix pattern (dot diameter ≤0.2 mm, Fig. 1b). The two CCD cameras, with 60 degrees angle line of sight with respect to each other, created two simultaneous images of the leaflet surface (Fig. 2a). Twenty-four such images were acquired for each valve at different times of the cardiac cycle, with higher density acquisition during open/closing phases (Table 1; Fig. 1a). Each image had an average of 140 laser dots visible on the leaflet, ranging from 90 to 190 since the leaflet area change over the cardiac cycle (Fig. 2). Note that the cameras acquired one frame (at 30 Hz) at a time, started just before the laser was switched on. The net effect was to obtain a 500 µs image (since the rest of the time the flow loop was completely dark) of the valve at the specified offset time, which was observed to be sufficiently short to capture valve motion as evidenced by a lack of blurring of the laser dots.
FIGURE 2.
(a) Representative image pairs showing the overall laser dot densities showing the large number of data points defining the leaflet surface and (b) resulting 3D reconstruction. Note the subtle surface features apparent in the reconstructed surface. Also shown is the location of the free edge and large dots indicating the location of the commissures.
TABLE 1.
Image acquisition time schema
| Frame | Time (ms) | Phase | Frame | Time (ms) | Phase | Frame | Time (ms) | Phase |
|---|---|---|---|---|---|---|---|---|
| 1 | 0 | Closed | 9 | 350 | Open | 17 | 620 | Closing |
| 2 | 200 | Closed | 10 | 360 | Open | 18 | 630 | Closing |
| 3 | 250 | Closed | 11 | 400 | Open | 19 | 640 | Closing |
| 4 | 300 | Opening | 12 | 450 | Open | 20 | 650 | Closing |
| 5 | 310 | Opening | 13 | 500 | Open | 21 | 660 | Closed |
| 6 | 320 | Opening | 14 | 550 | Open | 22 | 700 | Closed |
| 7 | 330 | Opening | 15 | 600 | Open | 23 | 750 | Closed |
| 8 | 340 | Opening | 16 | 610 | Closing | 24 | 800 | Closed |
Valve Preparation
A total of five porcine aortic heart valves were tested, all 25 ± 1 mm in diameter. Upon arrival from the abattoir, each aortic root was trimmed to leave only the necessary aortic tissue to maintain the valvular structure to allow for maximum leaflet visibility. A metal stent used in medical grade replacement heart valves (Carpentier valve, Edwards Life sciences) was then gently slipped over the aortic wall remnant. The commissure regions of the stent were sutured with 3-0 silk suture (Ethicon, USA) aligned with the commissure of the valve. The base of valve was then secured to the metal stent with sutures. The prepared valve was then secured onto a plastic ring made out of Tygon tubing, which fits inside the Pyrex aortic sinus. Each valve was oriented so that its non-coronary leaflet was vertical in the view chamber and completely visible by both cameras and imaged, due to its largest area.
After the native valve was imaged over the complete cardiac cycle, the valve together with the viewing chamber was removed intact from the rest of the flow loop. Each valve was then immersed in 0.625% glutaraldehyde aqueous solution while statically pressurized at ~4 mmHg for a period of 24 h. Pressurization was achieved by maintain a water column of 10 cm in height above the valve. Care was taken not to move or distort the position of the valve within the viewing chamber. After chemical treatment, the viewing chamber was replaced back onto the flow loop and the identical imaging protocol was repeated to acquire 3D surfaces at identical time points and flow conditions as for the native valve state. Note that comparison of native and BHV valve pressure and flow waveforms indicated that both were nearly identical (Fig. 1a).
3D Reconstruction and Surface Meshing, and Leaflet Dimensional Changes
The 3D spatial positions of each laser dot were recovered using Direct Linear Transformation from the corresponding 2D coordinates, which were digitized from the stereo image pairs (Fig. 2a).13 The resulting 3D spatial positions were used to construct a surface mesh using custom software developed by Shimada et al.34 to construct a contiguous triangular mesh using the laser dots as the vertices(Fig. 2b). The resulting 3D triangular mesh thus completely defined the surface of the leaflet at each acquisition point in the cardiac cycle. The non-coronary leaflets from a total of five porcine aortic valves were tested. Next, to facilitate basic comparisons in leaflet shape, we examined key changes in leaflet dimensions, including change in commissural angle and leaflet excursion from opened to closed, were quantified. Note that leaflet excursion was estimated as the distance the center of the leaflet travels from fully opened to fully closed.
Surface Curvature Calculations
A major focus of this study was quantification of the time-course surface geometric events of the leaflets during over the cardiac cycle. This requires knowledge of the leaflet surface curvatures over entire leaflet surface. While we have previously utilized sophisticated surface fitting techniques for heart valve motion,37 in pilot tests we found that a local surface patch technique22 approach proved to be more sensitive in detecting subtle changes in local curvature.
To accomplish this, the local surface was parameterized using surface patch method described in Sacks et al.22 from the reconstructed mesh at each time point. The method utilizes a bi-quadric surface defined in a local neighborhood about each mesh point, parameterized in terms of the local tangent plane coordinates xα, α = 1, 2. The position vector r is parameterized using
| (1) |
A search radius of 2 mm was used resulting in a surface patch size of 10–40 nodes (mean 25 nodes), with the constants a, b, and c determined for each node using standard regression methods.22 Using standard formulae,12 the metric g and curvature b tensors can be determined for each local surface using
| (2) |
where
The resulting physical components of the curvatures along normal sections aligned to the coordinate directions are given by
| (3) |
The principal curvature magnitudes were determined at the center of each surface patch (i.e., at the current node) using . It should be noted that we chose an inward directed normal (i.e., directed towards the aortic side) to allow for positive signed values for bI and bII when the valve was fully closed. The corresponding principal curvature unit vector directions eI and eII were determined at the center of each surface patch using
| (4) |
where eI,II were initially referenced to the local tangent plane coordinates then mapped back to the valve leaflet (or laboratory) coordinate system.
RESULTS
Overall Surface Geometric Characteristics
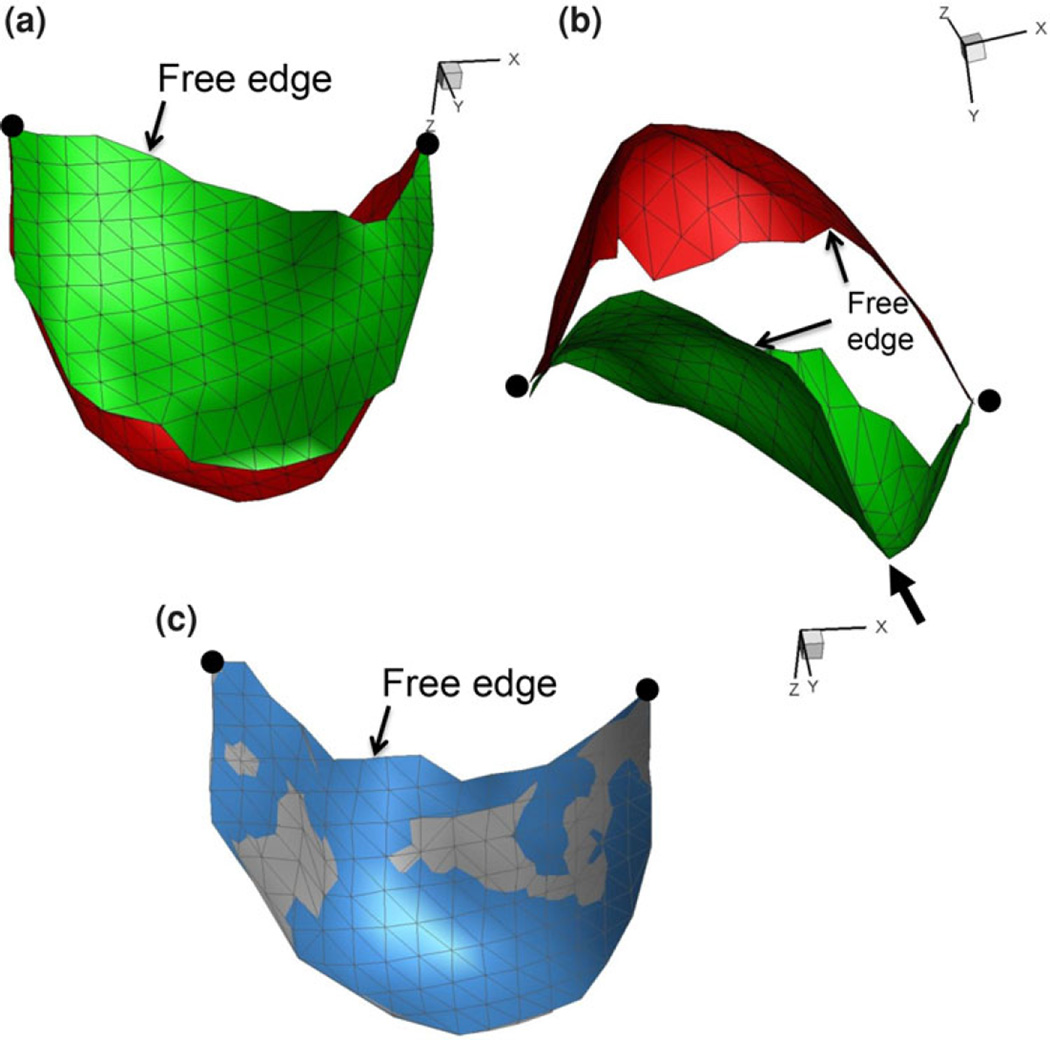
3D reconstruction results demonstrated high fidelity from cycle-to-cycle, as evidenced by virtually identical reconstructions form one cycle to the next (Fig. 3). Of particular note was the ability to recover the entire aortic-side surface at both end-diastolic and full systolic flow states (Fig. 3a and 3b), even with the large leaflet deformations present. Positional stability was also confirmed by both the consistent 3D locations of the commissures and end-diastolic surfaces (Fig. 3c). We also noted the presence of pronounced bends in the leaflet were accurately recovered by the present method (Fig. 3b).
FIGURE 3.
Representative BHV reconstructions at end diastole (red) and end systole (green) states in both the (a) transverse and (b) axial views. In (c) is an end diastolic image from two successive simulated cardiac cycles with the first surface in blue and the second cycle in grey showing excellent reproducibility. As in Fig. 2, the location of the free edge is identified along with large dots indicating the location of the commissures. Also shown is the location of focal high curvature region (arrow) in (b).
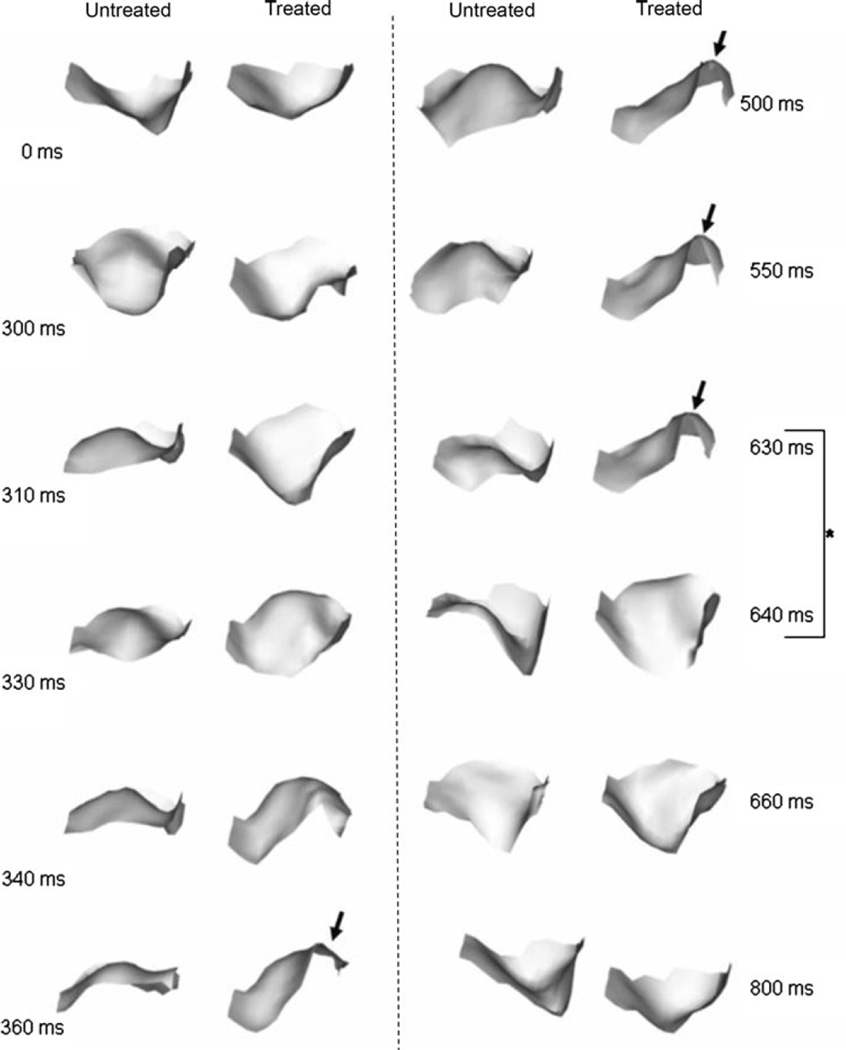
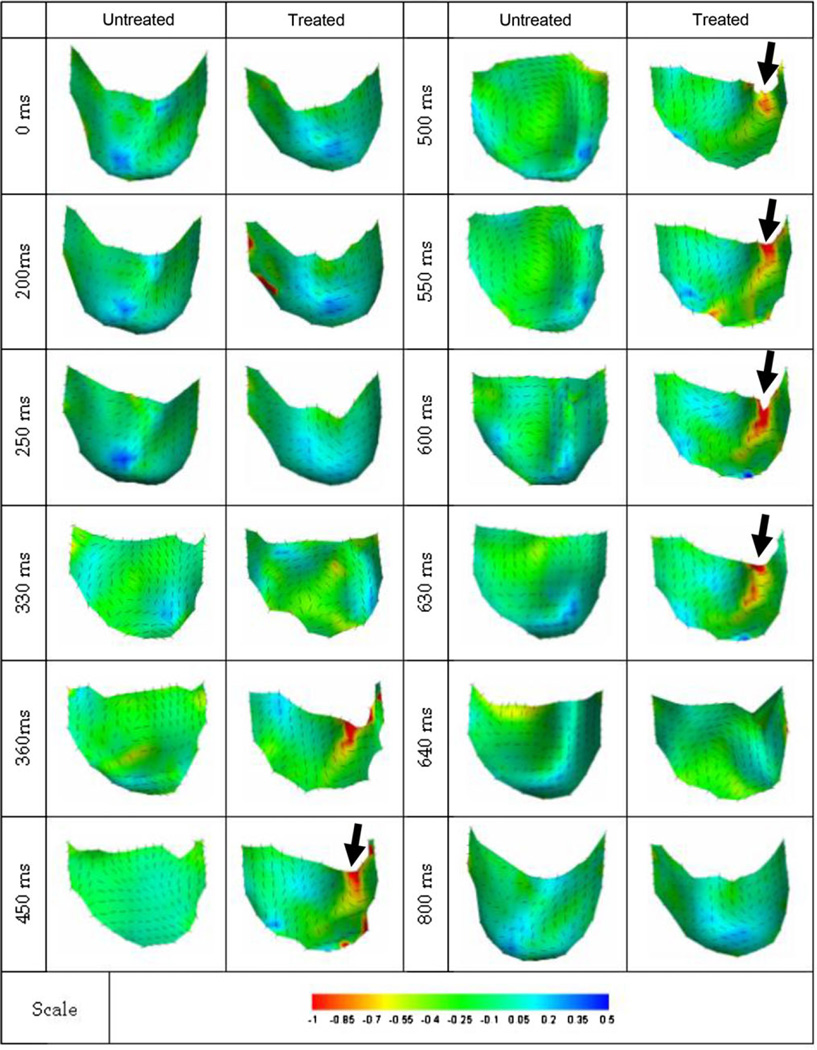
The resultant 3D reconstructed surfaces also demonstrated complex shape changes over the complete cardiac cycle (Fig. 4). The native valve opened earlier and closed later when compared to BHV valve. Native leaflets also continuously shifted in shape, whereas the BHV leaflet opens and maintains the same shape until closure. Of particular note was that while in the closed configuration all leaflet surfaces were smooth, BHV leaflets exhibited regions of significant bending. Moreover, these regions of bending persisted between t = 360 and 630 ms; a 270 ms period. Of particular note was the tendency for the BHV valves to “snap” shut within a time period of ~10 ms, a behavior not observed in the native valves (Fig. 4, rightmost column, time 630–640 ms). We also noted that the measured change in commissural angle was ~80° and the total leaflet excursion ~10 mm for both native and BHV states, with negligible differences between the two states (Table 2). No statistical differences were observed between any group (p <0.05). Thus, chemical fixation does not affect the starting and ending geometry of the aortic valve leaflet.
FIGURE 4.
Sequence of shaded surface renderings of native and BHV leaflets from the same valve going through a complete opening-open-closing cycle. View is axial, looking into the flow. In addition to the observed persistent bend occurring in the BHV leaflet (arrow), the very rapid “snap-like” closing within 10 ms can be seen highlighted in time intervals between 630 and 640 ms.
TABLE 2.
Key dimensional changes from the fully closed to fully opened positions for the five valves studied.
| Valve | Change in commissure angle untreated (°) |
Change in commissure angle treated (°) |
Leaflet excursion untreated (mm) |
Leaflet excursion treated (mm) |
bcirc untreated closed (mm−1) |
bcirc untreated opened (mm−1) |
Δbcirc untreated (mm−1) |
bcirc treated closed (mm−1) |
bcirc treated opened (mm−1) |
Δbcirc treated (mm−1) |
|---|---|---|---|---|---|---|---|---|---|---|
| 1 | 78.5 | 79.5 | 9.31 | 12.41 | 0.112 | −0.172 | 0.284 | 0.190 | −0.076 | 0.266 |
| 2 | 71.0 | 94.0 | 10.88 | 10.48 | 0.200 | −0.083 | 0.283 | 0.407 | −0.102 | 0.509 |
| 3 | 82.5 | 68.0 | 11.48 | 6.93 | 0.259 | −0.090 | 0.349 | 0.272 | −0.161 | 0.433 |
| 4 | 91.5 | 71.0 | 10.76 | 4.96 | 0.126 | −0.219 | 0.345 | 0.110 | −0.135 | 0.245 |
| 5 | 90.0 | 69.0 | 15.81 | 11.64 | 0.234 | −0.146 | 0.380 | 0.173 | −0.117 | 0.290 |
| Mean ± SEM | 82.70 ± 3.78 | 76.40 ± 4.87 | 11.65 ± 1.10 | 9.28 ± 1.43 | 0.186 ± 0.029 | −0.142 ± 0.026 | 0.328 ± 0.019 | 0.230 ± 0.051 | −0.118 ± 0.014 | 0.349 ± 0.052 |
Note that the commissure angle represents the change in angle from fully closed to fully opened, with the mean for both leaflet sides presented for each leaflet. Leaflet excursion was estimated as the distance the points in the central belly region displaced. The circumferential curvature bcirc represents the circumferential section curvature at the mid section of the valve (see Eq. (3)). There were no statistically significant differences between the open and closed states for each parameter using p ≤ 0.05.
Since the time-course changes in 3D leaflet surfaces are complex, we also examined the leaflet along the free edge (Fig. 4).While the native leaflets opened in an overall smooth and orderly fashion, their closing behavior was more complex. In contrast, BHV leaflets opened suddenly, in a snap-like manner, as well as demonstrating focal regions of high curvature, whereas the native leaflet opened more symmetrically.
Surface Curvature
As noted in Fig. 4, native leaflets tended to open in an approximately symmetric manner, whereas as the BHV leaflet often exhibited focal regions of high curvature (arrow, Fig. 5). We noted that both the native and BHV leaflets experienced an approximately 0.33 mm−1 total change in circumferential curvature that did not exhibit any statistical differences (p < 0.05, Table 2).
FIGURE 5.
Cross sectional views of the free edge of a typical valve when opening, with the numbers indicating the frame time in ms. The native valve’s free edge section shows a relatively early opening and smoothly progresses to fully open state at 360 ms. Majority of the bending occurs to the left and right, where the middle stays flat. The BHV leaflet however stays close longer and opens faster. Arrow points to a focal high curvature region that occurred only in the BHV leaflet. Majority of the bending occurs to the left and right, where the middle stays flat. The BHV leaflet however stays closed longer and opens faster. Arrow points to high bending that occurred only in the BHV valves.
Overall, the surface shape changes were best characterized by the minor curvature bII (Fig. 6). Overall, the leaflets exhibited an expected change in sign of bII as the valve opened. Of particular note, portions of the BHV leaflet with severe bending consistently have bending in the circumferential direction (Fig. 6, arrows). The native valve has uniform minor curvature and direction of bending shifts as the cycle progresses. Generally, while the native leaflet experienced localized bending, the intervals were short and not isolated to single location during the cardiac cycle. In contrast, for the BHV leaflet locations of high bending were consistently on one side of the valve during fully opened phase. This area of high bending was typically at least 10% in area and continued for ~200 ms.
FIGURE 6.
Plot of native and BHV leaflet surface showing the minor principal curvature bII (in mm−1) over a complete simulated cardiac cycle. Note for native leaflet, the location of high curvature shifts during cycle, where as the BHV leaflet remains the same. Region of high curvature in the BHV leaflet (arrow) occupied approximately 10% of the total leaflet surface.
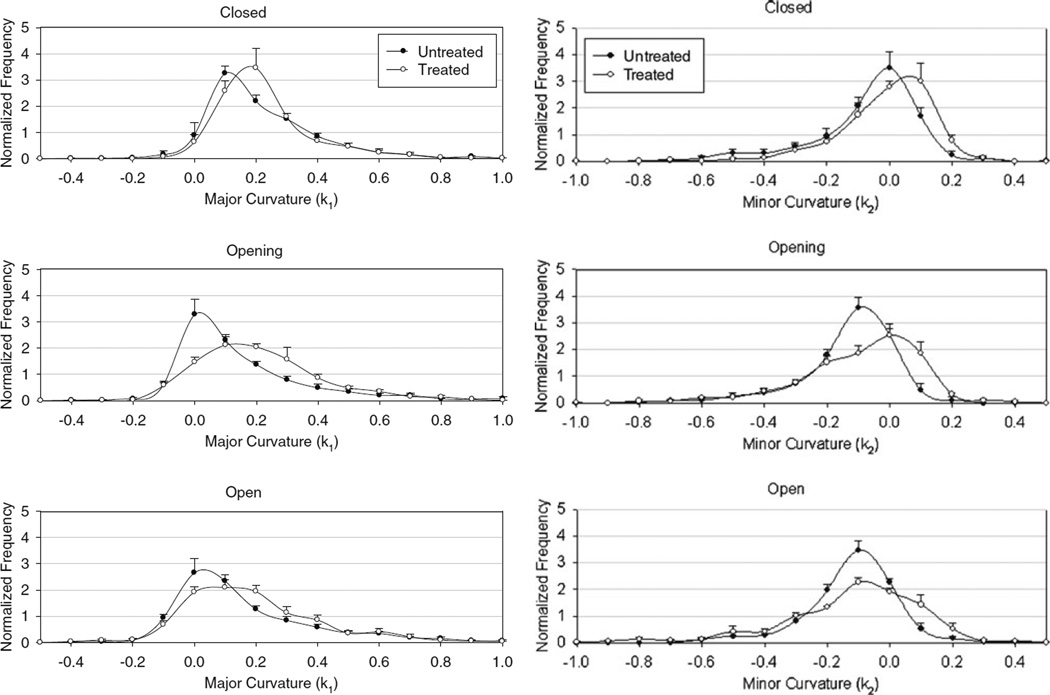
While informative, since the observed spatial and temporal changes in surface curvature were complex, computation of a mean changes in curvature does not fully capture the resulting shape (Table 3). We thus extended our statistical analysis to determine frequency histograms of the principal curvatures over the leaflet surface (Fig. 7). For bI, most of the valve was positively curved, with a skew towards positive direction, and for bI the exact opposite occurred. As the native valves opened the major curvature shifted from positive to near neutral value, indicating the leaflets tend to flatten out, whereas for BHV valves it did not. In terms of minor curvature, native valve exhibited a more curved surface when open, and BHV valve shows a complete reversal in curvature as it opens. The BHV leaflets show twice the amount of change in peak frequency. Furthermore, when the BHV valve opens, the minor curvature plot flattens out, thus indicating the broad range of bending that occurs on a single leaflet.
TABLE 3.
Major (bI) and minor (bII) principal curvature values (in mm−1) for untreated and treated leaflets at key time points (n = 5).
| Pre-open | Opening | Fully open | Closing | Closed | |
|---|---|---|---|---|---|
| Untreated | |||||
| bI | |||||
| Mean | 0.218 | 0.154 | 0.168 | 0.215 | 0.230 |
| Standard deviation | 0.133 | 0.161 | 0.171 | 0.188 | 0.120 |
| Skew | 0.887 | 0.956 | 0.985 | 1.144 | 1.079 |
| Mode | 0.100 | 0.000 | 0.000 | 0.000 | 0.100 |
| Treated | |||||
| bI | |||||
| Mean | 0.227 | 0.222 | 0.188 | 0.227 | 0.240 |
| Standard deviation | 0.115 | 0.161 | 0.155 | 0.165 | 0.122 |
| Skew | 1.107 | 1.382 | 1.211 | 1.380 | 1.146 |
| Mode | 0.100 | 0.000 | 0.000 | 0.000 | 0.100 |
| Untreated | |||||
| bII | |||||
| Mean | −0.072 | −0.125 | −0.120 | −0.114 | −0.042 |
| Standard deviation | 0.140 | 0.120 | 0.120 | 0.136 | 0.129 |
| Skew | −0.512 | −0.207 | −0.165 | −0.105 | −0.324 |
| Mode | 0.000 | −0.100 | −0.100 | −0.100 | 0.000 |
| Treated | |||||
| bII | |||||
| Mean | −0.014 | −0.089 | −0.111 | −0.114 | −0.019 |
| Standard deviation | 0.129 | 0.157 | 0.181 | 0.176 | 0.139 |
| Skew | −0.107 | 0.072 | −0.060 | −0.078 | −0.134 |
| Mode | 0.000 | −0.100 | −0.100 | −0.100 | 0.000 |
FIGURE 7.
Major and minor curvature histograms for all valves averaged at key time points over the simulated cardiac cycle. In general, the BHV valve demonstrated larger regions of higher curvatures, as evidenced by shift in histogram toward larger curvature magnitudes for both principal curvatures.
DISCUSSION
Despite the knowledge that leaflet motion plays a fundamental part of any investigation of native and prosthetic heart-valve mechanics, there have been relatively few studies to quantify aortic valve shape due to practical limitations. While current high-speed video (operating at > 1000 frames/s) or strobe photography are usually sufficient to detect obvious design flaws such as leaflet contact with other valve components, more sophisticated techniques are necessary to resolve subtler aspects such as bending and wrinkling. Given the complexities reported herein of the observed valve motion, the present study underscores the need for additional experimental investigations of heart valve dynamics. This is especially true considering that current computational approaches directed towards understanding valve dynamics clearly will require such information for problem definition and model validation.
Key Findings
The current experimental design allowed us to compare the effects of chemical fixation on valve leaflet kinematics under controlled simulated hemodynamic conditions. We observed several key differences in the dynamic behavior of the native and BHV leaflets. While native leaflets opened in a spatially and temporally complex but overall smooth manner, BHV leaflets tended to stay open and maintain the same overall shape until it rapidly closed (Figs. 4, 5, 6). The increase in tissue rigidity also limited fluttering often observed in the native valve. BHV leaflets also demonstrated significant bending on one side of the leaflet while the middle and other side of the valve stayed flat. Native leaflets would experience similar severe bending, but the location would shift during cardiac cycle. While period of valve opening was the same, the action time to transition from open to close and vice versa was shorter. Specifically, it took 60 and 40 ms for the native valve to open and close, respectively, and for the BHV valve 40 and 30 ms, respectively. Note that both valves would open beginning from the basal region of valve leading to the free edge.
Implications for Valve Durability
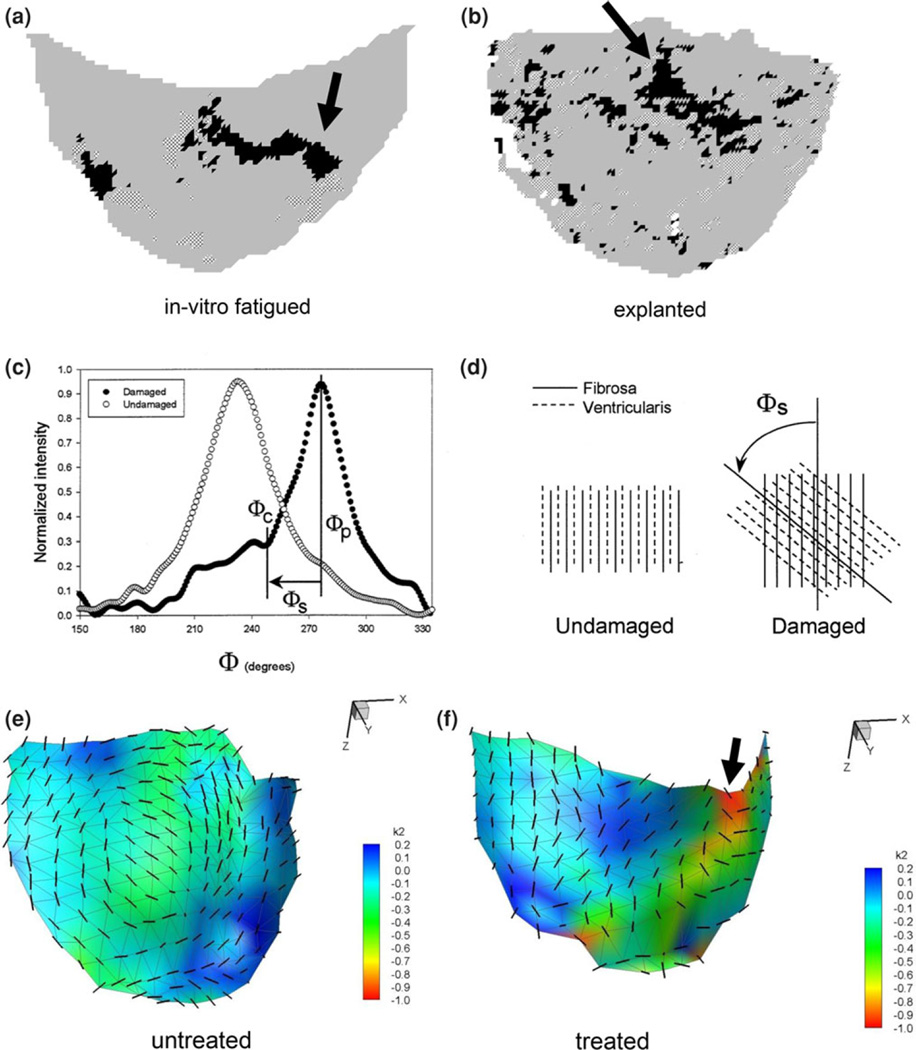
In two previous studies, we quantified collagen fiber disruption in porcine BHVs subjected to either in vitro accelerated wear testing (AWT)28 or explanted from patients after several years of in vivo function for non valve related problems27 (Figs. 8a and 8b). Collagen fiber disruption was quantified as an increase in the skew of the collagen fiber distribution, due to shearing of the fibers (Figs. 8c and 8d).17 When compared to in vitro AWT and human explanted leaflets, the locations of persistent bending were located in similar regions of the leaflet (Figs. 8e and 8f). Note that the regions of high curvature experienced by the leaflet experiences were quantified by the minor curvature bII, since this region of the leaflet surface bends away from the inward directed surface normal and is thus negative (i.e., less than the major curvature bI).
FIGURE 8.
Quantified collagen fiber disruption in porcine BHVs either (a) subjected to in vitro AWT28 or (b) explanted from patients after several years of in vivo function for non valve related problems.27 Here, regions of structural damage to the collagen fiber network are indicated as black or hatched areas (arrows).These damaged regions were detected by the presence of substantial skew, as shown in (c, d). Here, extracted collagen fiber distributions from structurally intact and damage regions show distinct increases in the skew, due to shearing of the fibers shown schematically in (d).17 The spatial locations of persistent bending in the treated leaflets compared untreated were located in similar regions of the leaflet (e, f). An arrow also shows regions of high curvature experienced by the leaflet.
The similarity in location to observed patterns of tissue damage in both in vitro accelerated wear tested and human explants suggests that the pronounced stiffening of the valve leaflet tissue is a significant source of leaflet tissue damage. While the exact mechanisms have to be worked out, we have noted similar sensitivity to flexural (i.e., bending) induced damage in vitro.17 While not definitive, the results of the present study suggest that the substantially higher flexural rigidity induces the abnormal leaflet dynamics, which may contribute to regions of focal flexural fatigue. This hypothesis is supported by our recent study wherein porcine-derived aortic valve heterograft biomaterials were found to be very sensitive to flexural fatigue,17 with delamination of the tissue layers the primary underlying mechanism. This appears to be in contrast to pericardial BHV, wherein high tensile stresses are considered to be the major cause of structural failure.
Limitations
The optical measurement system utilized in this study used non-fixed laser points to quantify leaflet surface geometries, and thus cannot measure strain. It should be noted that due to the geometry of the aortic valve root, a region of ~1 mm in height at the basal attachment of the leaflet was not always visible when the valve was fully closed. This had minimal impact on the curvature studies as the area accounted for less than 2%of total leaflet. We should also note that a key difference was that the valve roots were imaged using a Pyrex aortic root, which was not distensible. Since the focus of the present study was on bioprosthetic valve dynamics, this will not directly affect our results. However, the results for the native leaflets should not be taken as what occurs physiologically. Rather, they represent the upper bound of leaflet deformation that can occur when the surrounding root deformations are fully restricted. It should be noted that most of the radial stretch likely occurs in the coaptation region, between the nodulus of Arantii and the free edge, which has been shown to be more highly compliant in radial direction compared to the rest of the leaflet.3 Finally, we note that the present study will have to be confirmed in vivo with 3D ultrasound or related imaging technologies to verify these results in implanted BHV.
Summary
In the present study, AV leaflet 3D geometry was quantified using a non-contacting imaging system over the complete cardiac cycle. We observed that: (1) the native leaflet exhibited small, high frequency shifts in shape; (2) the treated leaflet demonstrated a more stabile shape, characterized by focal regions of prolonged, high curvature; (3) the BHV leaflet opens and closes faster by ~10 ms compared to native leaflet; (4) for both untreated and treated states, the aortic valve opened from basal region leading to free edge, and (5) during closing, both the untreated and treated tissues close with both free edge and mid-belly regions in approximate synchrony. We conclude that leaflet stiffness has a considerable effect on dynamic valve motion, and induces deleterious bending behaviors that may be associated with tissue breakdown and valve failure.
These findings point towards the need for the development of chemical fixation technologies that minimize flexure induced damage to extend porcine heterograft biomaterial durability. These results clearly indicated that increased leaflet stiffness might induce flexural mode failures in the leaflet tissue. This result has implications for current efforts to improve porcine bioprosthetic valves. Clearly, efforts aimed in developing novel chemical fixation technologies should not only be focused on reducing mineralization, but also in minimizing leaflet stiffness.15,16,30
ACKNOWLEDGMENTS
This research was supported by NIH grants HL-063026, HL-070969, and HL-108330.
Footnotes
CONFLICT OF INTEREST
The authors have no conflicts of interest.
REFERENCES
- 1.Adamczyk MM, Lee TC, Vesely I. Biaxial strain properties of elastase-digested porcine aortic valves. J. Heart Valve Dis. 2000;9(3):445–453. [PubMed] [Google Scholar]
- 2.Amini R, Eckert CE, Koomalsingh K, McGarvey J, Minakawa M, Gorman JH, et al. On the in vivo deformation of the mitral valve anterior leaflet: effects of annular geometry and referential configuration. Ann. Biomed. Eng. 2012 doi: 10.1007/s10439-012-0524-5. Epub 2012/02/14. [DOI] [PMC free article] [PubMed] [Google Scholar]
- 3.Billiar KL, Sacks MS. Biaxial mechanical properties of the natural and glutaraldehyde treated aortic valve cusp—part I: experimental results. J. Biomech. Eng. 2000;122(1):23–30. doi: 10.1115/1.429624. [DOI] [PubMed] [Google Scholar]
- 4.Black MM, Howard IC, Huang XC, Patterson EA. A three-dimensional analysis of a bioprosthetic heart valve. J. Biomech. 1991;24:793–801. doi: 10.1016/0021-9290(91)90304-6. [DOI] [PubMed] [Google Scholar]
- 5.Chandran KB, Kim SH, Han G. Stress distribution on the cusps of a polyurethane trileaflet heart valve prosthesis in the closed position. J. Biomech. 1991;24:385–395. doi: 10.1016/0021-9290(91)90027-k. [DOI] [PubMed] [Google Scholar]
- 6.Connolly JM, Alferiev I, Clark-Gruel JN, Eidelman N, Sacks M, Palmatory E, et al. Triglycidylamine crosslinking of porcine aortic valve cusps or bovine pericardium results in improved biocompatibility, biomechanics, and calcification resistance: chemical and biological mechanisms. Am. J. Pathol. 2005;166(1):1–13. doi: 10.1016/S0002-9440(10)62227-4. [DOI] [PMC free article] [PubMed] [Google Scholar]
- 7.Deiwick M, Glasmacher B, Tjan DT, Reul H, von Bally G, Scheld HH. Holographic interferometry and in vitro calcification: comparing pericardial versus porcine bioprostheses. J. Heart Valve Dis. 1998;7(4):419–427. [PubMed] [Google Scholar]
- 8.Eckert CE, Zubiate B, Vergnat M, Gorman JH, 3rd, Gorman RC, Sacks MS. In vivo dynamic deformation of the mitral valve annulus. Ann. Biomed. Eng. 2009;37(9):1757–1771. doi: 10.1007/s10439-009-9749-3. Epub 2009/07/09. [DOI] [PMC free article] [PubMed] [Google Scholar]
- 9.Ferrans V, Spray T, Billingham M, Roberts W. Structural changes in glutaraldehyde-treated porcine heterografts used as substitute cardiac valves. Am. J. Cardiol. 1978;41:1159–1184. doi: 10.1016/0002-9149(78)90873-1. [DOI] [PubMed] [Google Scholar]
- 10.Gloeckner DC, Billiar KL, Sacks MS. Effects of mechanical fatigue on the bending properties of the porcine bioprosthetic heart valve. ASAIO J. 1999;45(1):59–63. doi: 10.1097/00002480-199901000-00014. [DOI] [PubMed] [Google Scholar]
- 11.Hamid MS, Sabbah HN, Stein PD. Influence of stent height upon stresses on the cusps of closed bioprosthetic valves. J. Biomech. 1986;19:759–769. doi: 10.1016/0021-9290(86)90199-5. [DOI] [PubMed] [Google Scholar]
- 12.Istkov M. Tensor Algebra and Tensor Analysis for Engineers. Berlin: Springer; 2007. [Google Scholar]
- 13.Iyengar AKS, Sugimoto H, Smith DB, Sacks MS. Dynamic in vitro quantification of bioprosthetic heart valve leaflet motion using structured light projection. Ann. Biomed. Eng. 2001;29(11):963–973. doi: 10.1114/1.1415523. [DOI] [PubMed] [Google Scholar]
- 14.Krucinski S, Vesely I, Dokainish MA, Campbell G. Numerical simulation of leaflet flexure in bioprosthetic valves mounted on rigid and expansile stents. J. Biomech. 1993;26:929–943. doi: 10.1016/0021-9290(93)90055-j. [DOI] [PubMed] [Google Scholar]
- 15.Lovekamp JJ, Simionescu DT, Mercuri JJ, Zubiate B, Sacks MS, Vyavahare NR. Stability and function of glycosaminoglycans in porcine bioprosthetic heart valves. Biomaterials. 2006;27(8):1507–1518. doi: 10.1016/j.biomaterials.2005.08.003. [DOI] [PMC free article] [PubMed] [Google Scholar]
- 16.Lovekamp J, Vyavahare N. Periodate-mediated glycosaminoglycan stabilization in bioprosthetic heart valves. J. Biomed. Mater. Res. 2001;56(4):478–486. doi: 10.1002/1097-4636(20010915)56:4<478::aid-jbm1119>3.0.co;2-c. [DOI] [PubMed] [Google Scholar]
- 17.Mirnajafi A, Zubiate B, Sacks MS. Effects of cyclic flexural fatigue on porcine bioprosthetic heart valve heterograft biomaterials. J. Biomed Mater. Res. A. 2010;94(1):205–213. doi: 10.1002/jbm.a.32659. Epub 2010/02/19. [DOI] [PMC free article] [PubMed] [Google Scholar]
- 18.Patterson EA, Howard IC, Thornton MA. A comparative study of linear and nonlinear simulations of the leaflets in a bioprosthetic heart valve during the cardiac cycle. J. Med. Eng. Technol. 1996;20(3):95–108. doi: 10.3109/03091909609008387. [DOI] [PubMed] [Google Scholar]
- 19.Peskin C, McQueen D. Mechanical equilibrium determines the fractal fiber architecture of aortic heart valve leaflets. Am. J. Physiol. 1994;266(1):H319. doi: 10.1152/ajpheart.1994.266.1.H319. [DOI] [PubMed] [Google Scholar]
- 20.Peskin CS, Wolfe AW. The aortic sinus vortex. Fed Proc. 1978;37(14):2784–2792. [PubMed] [Google Scholar]
- 21.Sacks MS. The biomechanical effects of fatigue on the porcine bioprosthetic heart valve. J. Long Term Eff. Med. Implants. 2001;11(3&4):231–247. [PubMed] [Google Scholar]
- 22.Sacks MS, Chuong CJ, Templeton GH, Peshock R. In vivo 3-D reconstruction and geometric characterization of the right ventricular free wall. Ann. Biomed. Eng. 1993;21:263–275. doi: 10.1007/BF02368182. [DOI] [PubMed] [Google Scholar]
- 23.Sacks MS, Hamamoto H, Connolly JM, Gorman RC, Gorman JH, 3rd, Levy RJ. In vivo biomechanical assessment of triglycidylamine crosslinked pericardium. Biomaterials. 2007;28(35):5390–5398. doi: 10.1016/j.biomaterials.2007.08.021. Epub 2007/09/08. [DOI] [PMC free article] [PubMed] [Google Scholar]
- 24.Sacks MS, He Z, Baijens L, Wanant S, Shah P, Sugimoto H, et al. Surface strains in the anterior leaflet of the functioning mitral valve. Ann. Biomed. Eng. 2002;30(10):1281–1290. doi: 10.1114/1.1529194. [DOI] [PubMed] [Google Scholar]
- 25.Sacks MS, Mirnajafi A, Sun W, Schmidt P. Bio-prosthetic heart valve heterograft biomaterials: structure, mechanical behavior and computational simulation. Expert Rev. Med. Devices. 2006;3(6):817–834. doi: 10.1586/17434440.3.6.817. [DOI] [PubMed] [Google Scholar]
- 26.Sacks MS, Schoen FJ, editors. Calcification-Independent Collagen Damage in Explanted Clinical Bioprosthetic Heart Valves. Providence, RI: Society for Biomaterials; 1999. [Google Scholar]
- 27.Sacks MS, Schoen FJ. Collagen fiber disruption occurs independent of calcification in clinically explanted bioprosthetic heart valves. J. Biomed. Mater. Res. 2002;62(3):359–371. doi: 10.1002/jbm.10293. [DOI] [PubMed] [Google Scholar]
- 28.Sacks MS, Smith DB. Effects of accelerated testing on porcine bioprosthetic heart valve fiber architecture. Biomaterials. 1998;19(11–12):1027–1036. doi: 10.1016/s0142-9612(98)00002-7. [DOI] [PubMed] [Google Scholar]
- 29.Schoen FJ. Pathology of heart valve substitution with mechanical and tissue prostheses. In: Silver MD, Gotlieb AI, Schoen FJ, editors. Cardiovascular Pathology. New York: Livingstone; 2001. [Google Scholar]
- 30.Schoen FJ. Cardiac valves and valvular pathology: update on function, disease, repair, and replacement. Cardiovasc. Pathol. 2005;14(4):189–194. doi: 10.1016/j.carpath.2005.03.005. [DOI] [PubMed] [Google Scholar]
- 31.Schoen FJ, Levy RJ. Calcification of bioprosthetic heart valves. In: Bodnar E, Frater RWM, editors. Replacement Cardiac Valves. New York: Pergamon Press; 1991. pp. 125–148. [Google Scholar]
- 32.Schoen F, Levy R. Pathology of substitute heart valves. J. Card. Surg. 1994;9:222–227. doi: 10.1111/j.1540-8191.1994.tb00932.x. [DOI] [PubMed] [Google Scholar]
- 33.Schoen F, Levy R. Tissue heart valves: current challenges and future research perspectives. J. Biomed. Mater. Res. 1999;47:439–465. doi: 10.1002/(sici)1097-4636(19991215)47:4<439::aid-jbm1>3.0.co;2-o. [DOI] [PubMed] [Google Scholar]
- 34.Shimada K, Yamada A, Itoh T, editors. Sixth international meshing roundtable. Sandia National Laboratories; 1997. Anisotropic triangular meshing of parametric surfaces via close packing of ellipsoidal bubbles. [Google Scholar]
- 35.Smith DB, Sacks MS, Pattany PM, Schroeder R. High-resolution magnetic resonance imaging to characterize the geometry of fatigued porcine bioprosthetic heart valves. J. Heart Valve Dis. 1997;6(4):424–432. [PubMed] [Google Scholar]
- 36.Smith DB, Sacks MS, Pattany PM, Schroeder R. Fatigue-induced changes in bioprosthetic heart valve three-dimensional geometry and the relation to tissue damage. J. Heart Valve Dis. 1999;8(1):25–33. [PubMed] [Google Scholar]
- 37.Smith DB, Sacks MS, Vorp DA, Thornton M. Surface geometric analysis of anatomic structures using biquintic finite element interpolation. Ann. Biomed. Eng. 2000;28(6):598–611. doi: 10.1114/1.1306342. [DOI] [PubMed] [Google Scholar]
- 38.Vyavahare N, Ogle M, Schoen FJ, Zand R, Gloeckner DC, Sacks MS, et al. Mechanisms of bioprosthetic heart valve failure: fatigue causes collagen denaturation and glycosaminoglycan loss. J. Biomed. Mater. Res. 1999;46:44–50. doi: 10.1002/(sici)1097-4636(199907)46:1<44::aid-jbm5>3.0.co;2-d. [DOI] [PubMed] [Google Scholar]
- 39.Weiler M, Yap CH, Balachandran K, Padala M, Yoganathan AP. Regional analysis of dynamic deformation characteristics of native aortic valve leaflets. J. Biomech. 2011;44(8):1459–1465. doi: 10.1016/j.jbiomech.2011.03.017. Epub 2011/04/05. [DOI] [PMC free article] [PubMed] [Google Scholar]
- 40.Wells SM, Sellaro T, Sacks MS. Cyclic loading response of bioprosthetic heart valves: effects of fixation stress state on the collagen fiber architecture. Biomaterials. 2005;26(15):2611–2619. doi: 10.1016/j.biomaterials.2004.06.046. [DOI] [PubMed] [Google Scholar]
- 41.Wipperman F. On the fluid dynamics of the aortic valve. J. Fluid Mech. 1985;159:487–501. [Google Scholar]
- 42.Yap CH, Kim HS, Balachandran K, Weiler M, Haj-Ali R, Yoganathan AP. Dynamic deformation characteristics of porcine aortic valve leaflet under normal and hypertensive conditions. Am. J. Physiol. Heart Circ. Physiol. 2010;298(2):H395–H405. doi: 10.1152/ajpheart.00040.2009. Epub 2009/11/17. [DOI] [PubMed] [Google Scholar]


