

Abstract
Sperm viability in aquatic species is increasingly being evaluated by motility analysis via computer-assisted sperm analysis (CASA) following activation of sperm with manual dilution and mixing by hand. User variation can limit the speed and control over the activation process, preventing consistent motility analysis. This is further complicated by the short interval (i.e., less than 15 s) of burst motility in these species. The objectives of this study were to develop a staggered herringbone microfluidic mixer to: 1) activate small volumes of Danio pearl zebrafish (Danio albolineatus) sperm by rapid mixing with diluent, and 2) position sperm in a viewing chamber for motility evaluation using a standard CASA system. A herringbone micromixer was fabricated in polydimethylsiloxane (PDMS) to yield high quality smooth surfaces. Based on fluorescence microscopy, mixing efficiency exceeding 90% was achieved within 5 s for a range of flow rates (from 50 to 250 μL/h), with a correlation of mixing distances and mixing efficiency. For example, at the nominal flow rate of 100 μL/h, there was a significant difference in mixing efficiency between 3.5 mm (75 ± 4%; mean ± SD) and 7 mm (92 ± 2%; P = 0.002). The PDMS micromixer, integrated with standard volumetric slides, demonstrated activation of fresh zebrafish sperm with reduced user variation, greater control, and without morphologic damage to sperm. Analysis of zebrafish sperm viability by CASA revealed a statistically higher motility rate for activation by micromixing (56 ± 4%) than manual activation (45 ± 7%; n = 5, P = 0.011). This micromixer represented a first step in streamlining methods for consistent, rapid assessment of sperm quality for zebrafish and other aquatic species. The capability to rapidly activate sperm and consistently measure motility with CASA using the PDMS micromixer described herein will improve studies of germplasm physiology and cryopreservation.
Keywords: Zebrafish sperm, Micromixer, Mixing efficiency, Activation, Motility
1. Introduction
Zebrafish (Danio species) have become one of the most important vertebrate model organisms for developmental and genetic research [1–4] because of external fertilization, high fecundity, ease of rearing in captivity, and short generation interval. This extensive use of zebrafish has generated several thousand specific strains. The strains are maintained live in stock centers [5,6], resulting in considerable logistic and economic challenges. Cryopreservation of gametes from zebrafish lines is the most cost-effective option for maintaining genetic material [7]. Cryopreservation of sperm requires evaluation of sperm quality from fresh and frozen-thawed samples. Such evaluation involves a scaling up process to high-throughput platforms [8]. However, analysis of zebrafish sperm is challenging because of the small volume of semen per fish, small sperm cell size, short motility duration (<15 s peak burst motility) [9,10], and inconsistent technical procedures for analysis and motility activation [6,11].
For analysis of most aquatic species, sperm motility is initiated through alteration of the osmolality of the aqueous medium, typically accomplished through manual dilution and mixing by hand and estimated subjectively by visual observation, or objectively in volumetric viewing chambers by the use of computer-assisted sperm analysis (CASA) systems [10,12–14]. Manual methods, especially for zebrafish sperm, limit control over the activation process and, therefore, quality analysis. Inconsistent activation methods can result in error-prone evaluation of male reproductive potential. The CASA systems were designed for use with mammalian sperm [12,13] which have longer motility duration (i.e., days) than that of zebrafish. The combined time (from 5 to 15 s) required to activate, load, and measure the sample is a limitation in assessing peak motility of fish sperm in general, which was not a design consideration when developing mammalian CASA systems. Therefore, a need exists to enable rapid mixing and activation of small volumes of zebrafish sperm cells for reliable and accurate sperm assessment with CASA.
Microfluidic platforms with microfabrication technologies have been used to shorten analysis times, reduce volumes of reagents, and enable new discoveries in cell biology [15–17]. These devices have been utilized in studies of gamete and embryo physiology where microchannels have been used for reliable delivery of sperm to oocytes [18], gamete and embryo isolation and culture [19,20], sperm sorting and separation [21–27], and manipulation of oocytes and sperm [28–30]. However, to date there have been no reports regarding the use of microfluidics to activate and analyze aquatic species sperm cells.
Several micromixers have been developed to enhance mixing in passive and active configurations [31,32]. Active micromixers involve recruitment of an external field or force to increase perturbation of fluids [33–37]. However, because of more complex fabrication processes, the requirement for external perturbation sources, and the difficulty of integrating active micromixers into microfluidic platforms, passive micromixers have been preferred in biological and chemical applications [31]. Passive micromixers utilize unique microchannel geometries to achieve mixing. Among passive micromixers the staggered herringbone micromixer with in-floor depressions [38] has been widely used, because of relatively simple fabrication, operation, and high mixing efficiency at low Reynolds numbers [31,39]. This type of micromixer could be a useful means to rapidly introduce aquatic species sperm into diluent to evaluate motility.
The objectives of this study were to develop a staggered herringbone microfluidic mixer to: 1) activate small volumes of Danio pearl zebrafish (Danio albolineatus) sperm by rapid mixing with diluent, and 2) position sperm in a viewing chamber for motility evaluation using a standard CASA system. The micromixer was fabricated in polydimethylsiloxane (PDMS) using a casting method. The mixing efficiency of the device was characterized using fluorescence microscopy in terms of distance and time of sample flow along the device channel. The micromixer was integrated with standard volumetric slides to rapidly and consistently activate zebrafish sperm and allow evaluation using CASA.
2. Materials and methods
2.1. Design and microfabrication of a herringbone micromixer
As a demonstration of a microfluidic platform for zebrafish sperm activation and motility analysis, a mixer based on passive herringbone geometry [38] was designed and microfabricated to mix sperm with diluent solution (Fig. 1). A T-type microchannel was used with two inlet reservoirs (diameter of 0.9 mm) to introduce diluent solution and sperm sample through inlet microchannels (5 mm long, 100 μm wide, and 75 μm deep) into a main mixing microchannel (15 mm long, 200 μm wide, and 75 μm deep) with herringbone features leading to a single outlet. The dimensions of herringbone individual features were width of 60 μm, depth of 25 μm, and spacing of 60 μm. The asymmetry of the herringbone elements was set at a ratio of 3:7 for the length of the short: long arms, and the angle of the herringbones was set at 55° with respect to the center-line of the main microchannel. The direction of asymmetry of the herringbones was alternated at each half cycle, which comprised five herringbone depressions (Fig. 1), and each full cycle of herringbone features was repeated every 1.4 mm, yielding a total of 10 sets in the main microchannel. These geometrical parameters were selected from the reported range of parameters [38,40] and also by taking into account the requirements of micromilling the brass master insert used in fabrication of the device.
Fig. 1.
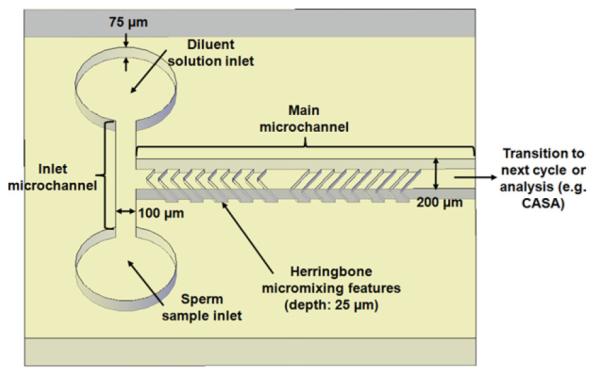
A schematic diagram of a micromixer with one cycle of herringbone depressions for zebrafish activation and motility analysis (dimensions not to scale, additional herringbones and outlet reservoir not shown).
The herringbone micromixers were fabricated in polydimethylsiloxane (PDMS) using a casting method. The choice of PDMS for the micromixers was made because of its optical clarity, bio compatibility, and easy microfabrication via casting at low cost. Instead of using standard photoresist master molds for casting, polymethylmethacrylate (PMMA) master molds were manufactured using a two-step process. First, computer-aided design (CAD) of the herringbone micromixer from Autocad (2004 version, San Rafael, CA, USA) was precisely micromilled into a brass master with a computer-controlled micromilling machine (KERN MMP-2522, KERN Micro Feinwerktechnik GmbH, Eschenlohe, Germany) to create a negative mold with microchannels and herringbone depressions (Fig. 2A). The brass mold was used for micromolding of 2.6-mm thick PMMA sheets using a hot embossing machine (HEX02, Jenoptik Mikrotechnik, Jena, Germany). A molding pressure of 15 000 N was applied to the PMMA sheets for 3 min at a mold temperature of 154 °C, with a demolding temperature of 110 °C. The hot-embossed PMMA served as the master mold with positive relief microstructures for PDMS casting (Fig. 2B). Liquid prepolymer PDMS and curing agent (Sylgard 184 silicone elastomer base and curing agent, Dow Corning Corp., Midland Township, MI, USA) were mixed thoroughly at a 10:1 volume ratio and poured into the PMMA molds to fabricate the PDMS micromixers. A degassing step was carried out down to 600 mm Hg vacuum three to four times to remove air bubbles before and after PDMS casting in a Nalgene transparent polycarbonate desiccator (5311–0250, Thermo Scientific, Waltham, MA, USA) using a vacuum pump (DOA-P104-AA, Gast Manufacturing Inc., Benton Harbor, MI, USA). The poured PDMS was held at room temperature for at least 24 h until fully cured.
Fig. 2.
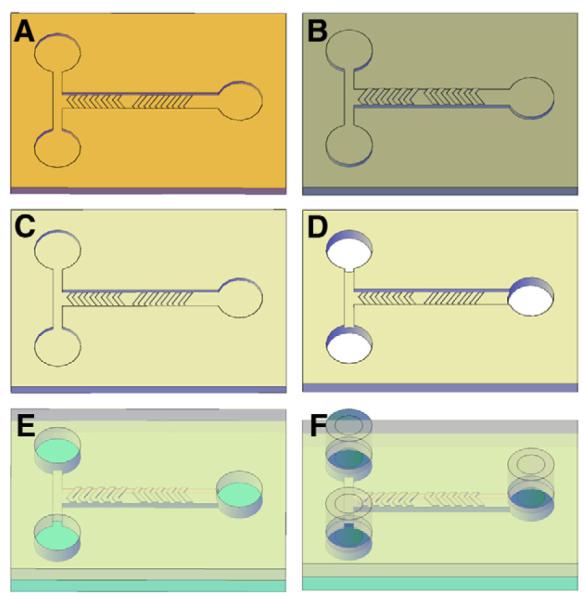
Microfabrication sequences for a PDMS herringbone micromixer. (A) micromilled brass mold, (B) micromolded PMMA master mold, (C) PDMS micromixer, (D) generation of fluidic through-holes, (E) bonding of PMDS micromixer to glass, and (F) incorporation of macro-to-micro interfaces.
After curing, the PDMS was peeled from the PMMA master mold (Fig. 2C) and cut to size, depending on the application. For characterization of mixing efficiency, a PDMS block 2.5 cm by 2.8 cm allowed visualization of the entire 15-mm length of the herringbone channel. Once the minimum number of herringbones sufficient for mixing was determined (Section 3.2.), a block with a shorter channel (10 mm) was used for sperm activation and analysis. The PDMS microfluidic device and the PMMA master mold were inspected using scanning electron microscopy (SEM) and a surface profilometer (Alpha step 500, KLA-Tencor, Milipitas, CA, USA). Before sealing, fluidic through-holes were punched in the PDMS devices (Fig. 2D) using a commercial puncher (Harris Uni-Core, P/N 15 099, Redding, CA, USA).
Two types of glass slides were used for sealing of PDMS devices: microscope slides (P/N 4430, Richard-Allan Scientific, Kalamazoo, MI, USA) for characterization of mixing efficiency and Hamilton Thorne 2X-CEL CASA slides (20-μm slides, P/N 720 299, Hamilton Thorne Biosciences, Beverly, MA, USA) for zebrafish sperm activation and motility analysis. The glass slides were cleaned with isopropyl alcohol and dried with nitrogen gas before surface modification by plasma. For sealing the microchannel in the PDMS device, the glass slide and the PDMS device were surface-modified in a plasma cleaner (PDC-32G, Harrick Plasma, Ithaca, NY, USA) for 60 s using the radio frequency (RF) power set at high and a process pressure of 500 mTorr, based on the manufacturer’s recommendation. Following plasma oxidation, the PDMS device was brought into contact with the glass slide, pressed gently together, and baked at 65 °C for 2 h to form an irreversible bond (Fig. 2E). Syringe needles (21 ga, stainless steel, blunt, lure-lock, polypropylene hub, 25.4-mm length, ID: 0.51 mm, OD: 0.82 mm; http://Smallparts.com, Lexington, KY, USA) and Tygon tubing (R-06148-03; ID, 0.76 mm; OD, 2.29 mm; Cole Parmer, Vernon Hills, IL, USA) were used to incorporate the macro-to-micro interface for the sealed PDMS devices. First, the needles were modified by removing the hubs using a Dremel rotary tool. The modified needles were inserted into the fluidic through-holes in the PDMS device with the opposite end connected to the Tygon tubing, which was connected to syringes used for characterization of mixing efficiency or zebrafish sperm activation and motility analysis (Figs. 2F and 3).
Fig. 3.

Images of (A) the PDMS microfluidic mixing devices, and (B) the experimental set-up for microscopic observation of mixing and motility analysis. The PDMS devices were bonded to standard microscope slides for characterization of mixing efficiency (left), and bonded to standard Hamilton Thorne CASA slides (right) for zebrafish sperm activation and motility analysis, with inset showing a close-up view of the bonding interface of the PDMS device with channel outlet emptying into the volumetric chamber; the black arrow (inset) shows the direction of flow for the mixed sperm sample from the PDMS device to the viewing chamber of the Hamilton Thorne CASA slide. The experimental setup in (B) shows the mixing device on the stage of the CEROS CASA system microscope, with sample flow driven by a syringe pump, where one syringe introduces non-activated sperm and the other syringe introduces deionized water as a diluent for activation.
2.2. Characterization of mixing efficiency
For characterization of mixing efficiency, fluorescence was quantified in the microchannel as deionized water and fluorescein dye were mixed. Two 5-mL glass syringes (1005TLL, Hamilton, Reno, NV, USA) were filled with deionized water or fluorescein dye (fluorescein sodium salt in deionized water, 3.75 × 10⁻² g/L, F6377-100G, Sigma-Aldrich, St. Louis, MO, USA) and simultaneously injected at 100 μL/h into the inlets of the PDMS microdevice using a syringe pump (KDS220 multi-syringe pump, Kd Scientific Inc., MA, USA). The microchannel was imaged from the inlet down its length using an inverted fluorescent microscope (Eclipse, Nikon Instruments Inc. Melville, NY, USA) with a 10-x objective lens and digital camera (Cool-SnapFX Photometrics, Tucson, AZ, USA), and analyzed in Metamorph Software (Universal Imaging, Corp., West Chester, PA, USA). Mixing efficiency was determined using the following equation [41]:
| (1) |
where N is the total number of pixels, Ii is the intensity recorded at pixel i at a specific location, Io is the intensity without mixing or diffusion, and Iperf.mix is the intensity of a perfectly mixed solution. Fluorescence intensity values for Ii were obtained every 0.7 mm along the channel using line scans across the entire width of the main microchannel and repeated three times at each location. Fluorescence intensity values for Iperf.mix were obtained using line scans across the main microchannel at multiple locations after injecting half concentration (1.88 × 10⁻² g/L) of fluorescent dye in both inlets, repeated three times at each location, and averaged. Fluorescence intensity values for Io were obtained using line scans across the two inlet microchannels and repeated three times. Background fluorescence intensity values were measured three times using line scans across the deionized inlet microchannel and subtracted from all measured fluorescence intensity values. All fluorescence intensity values were normalized with respect to maximum fluorescence intensity at the fluorescent inlet microchannel.
The fluorescence measurements were repeated as described above at flow rates of 50, 150, 200, and 250 μL/h to determine the effect of flow rate on mixing efficiency and to determine the variation of mixing efficiency among different PDMS microdevices. Mixing efficiency was evaluated as a function of distance and time traveled from the T-junction at the inlet.
2.3. Zebrafish and sperm collection
Danio pearl zebrafish obtained from Segrest Farms (Gibsonton, FL, USA) were maintained in 3-L tanks (5 fish/L) at 26 °C in an aquarium system (Aquatic Habitats, Apopka, FL, USA), and fed twice daily with scientific hatcheries diet for zebrafish (Aquaneering Inc., San Diego, CA, USA) and live artemia grown from cyst (INVE Group, Salk Lake City, UT, USA). Guidelines from the Institutional Animal Care and Use Committees of Louisiana State University were followed for animal care in this study.
Fresh sperm samples were collected from male Danio pearl zebrafish following anesthetization in a solution of 0.01% (v/v) tricaine methanesulfonate (MS-222 Western Chemical Inc., Ferndale, WA, USA). The fish was placed in a foam rubber holder with a belly facing up, blotted dry, and gently squeezed under a microscope (10-x magnification), and sperm was collected using a micropipette. The collected sperm was suspended in a microcentrifuge tube with 20 μL (~10–20 times of the sperm volume) of Hanks’ balanced salt solution (HBSS) at an osmolality of 300 mosmol/kg [42] and used immediately or stored at 4 °C for later use. The fish were returned to aquarium water for recovery, where they were allowed to recover for at least 2 wk before subsequent sperm collection. Sperm concentration was determined in a microspectrophotometer (NanoDrop 1000, Thermo Scientific, Wilmington, DE, USA) by measuring absorbance of a 2-μL sample at 400 nm [43]. The sperm sample was diluted with HBSS so the sperm concentration was ~1 × 10⁸ cells/mL as reported for reliable CASA measurements of zebrafish sperm [12].
2.4. Zebrafish sperm activation and motility analysis
Sperm from several Danio pearl zebrafish were pooled into a single sample to yield sufficient volume for comparison of manual mixing and micromixing for sperm activation. To evaluate manual mixing, 2 μL of sperm sample were pipetted onto a 2X-CEL viewing chamber slide (20-μm depth, 4-μL volume) followed by addition of 2 μL of deionized water. The sample was mixed with the pipette tip briefly (2–3 s) to reduce the osmolality from 300 mosmol/kg to ~150 mosmol/kg for sperm activation. The slide chamber was sealed with a coverslip and motility was evaluated with an open CASA system (CEROS model, Hamilton Thorne, Beverly, MA, USA) under tungsten filament illumination using 10-x magnification at room temperature (26 °C). A CCD camera was utilized to capture negative phase-contrast images from a light microscope (CX41 Olympus America Corp Center Valley CA USA) which were saved in the CEROS motility program (Animal Motility, Version 12.3). The image acquisition rate was 60 Hz for 30 frames. The minimum cell count was set at 40 pixels and the minimum cell size was set at four pixels. The smoothed path velocity (VAP average velocity of the smoothed cell path in μm/sec) cutoff for progressive sperm was set at 50 μm/sec, and for motile sperm was set at 20 μm/sec, based on reported parameters for similar species [13] and our own empiric data. Measurements were performed five times within 20 s of activation to count the total number, motile number, and progressive number of sperm.
For sperm activation in the micromixer, 100-μL glass syringes (1710TLLX, Hamilton, Reno, NV, USA) were filled with either 50 μL of sperm sample or deionized water, with care taken to ensure that no air was introduced into the syringes when connecting to the device inlet tubing. The contents of the two syringes were simultaneously injected into the inlet microchannels of the PDMS micromixer (Fig. 3B). The viewing chamber with a coverslip was monitored under a microscope until the mixed sample entered, at which time the syringe pump was stopped and CASA initiated. Measurements were performed five times within 20 s of sperm entering the viewing chamber to count the total number, motile number, and progressive number of sperm.
2.5. Data analysis
Data were analyzed using built-in statistical packages in Microsoft Excel (Microsoft, Corp., version 2007, Redmond, WA, USA). One-way anova was used to test the effect of distances on the mixing efficiency and to test the coefficient of variation (CV, standard deviation/mean) for the mixing efficiency with the lowest variance. A Student’s t test was used to determine if there was a statistical difference in zebrafish sperm motility rate. Several CASA parameters, including VAP, curvilinear velocity (VCL), straight line velocity (VSL), straightness (STR, VSL/VAP in percentage), and linearity (LIN, VSL/VCL in percentage) were examined using one-way ANOVA. The data were presented as arithmetic mean ± standard deviation (SD) and the significance level was set at P < 0.05.
3. Results and discussion
3.1. Microfabrication of a herringbone micromixer
Microfluidic devices in PDMS are traditionally microfabricated using photoresist master molds [17] which provide smooth surfaces, but require clean room or semi-clean room facilities. This method also requires additional active alignment processes during photolithography for multilayered microstructures, and the silicon substrate used as a master mold base can break easily because of brittleness. Owing to these limitations PMMA master molds were used for PDMS microfluidic devices using a two-step process, including micromilling of a brass mold and hot embossing of PMMA master molds. Instead of direct PDMS casting in the brass mold, PMMA master molds were used because of the difficulty of removing the PDMS from the brass [44]. This method allowed for convenient multilayer fabrication of three-dimensional microstructures by micromilling [45], provided robust PMMA master molds with little stress and shrinkage [46], and enabled microfabrication of the PDMS microfluidic devices in a non-clean room environment. Inspection by SEM and a surface profilometer revealed that there was no PDMS left in the PMMA master mold after peeling it from the PMMA mold (data not shown), and the microstructures, including microchannels and herringbone depressions were replicated in high quality with a smooth surface roughness of 45.6 ± 4.9 nm (n = 3).
The reliability of bonding between the PDMS devices and glass slides, and the stability of the macro-to-micro interface are critical elements in producing a leakage-free microfluidic device. To form irreversible bonds between the PDMS device and the glass slide, the two interfaces require clean surfaces without contaminating particulates. This facilitates surface modification by either air or oxygen plasma to generate hydrophilic silanol (SiOH) groups on the surface, and to form covalent siloxane (Si–O–Si bond) bonds by a condensation reaction at the two bonding interfaces [47]. The macro-to-micro interface fluidic through-holes were reproducibly punched with a diameter of 758.3 ± 14.4 μm with minimal tears at the reservoirs of the PDMS devices. These through-holes enabled a tight pressure-fit [48] with modified 21-gauge needles (OD: 820 μm). The macro-to-micro interface had no leakage, either at the bonding interface or at the macro-to-micro interfaces at flow rates as high as 2000 μL/h, which was far above the highest flow rate used for this study. The modified needles with Tygon tubing were removed and reinserted to other PDMS devices without causing leakage, confirming the reuse potential and robustness of the macro-to-micro interface. To facilitate the reusability of each device, any residues in the microchannels from each influent streams were eliminated by flushing of the microchannels with deionized water or ethanol.
In current CASA applications, the sperm and activation solution are mixed by hand in a contained viewing area of the standardized volumetric slide before the CASA motility analysis [12]. This ensures confinement of sample in a closed space, limiting fluidic drift, and provides a known volume for determination of the sample concentration. The PDMS micromixers sealed with the Hamilton Thorne standardized volumetric CASA slides provided compatibility with existing sperm analysis technologies. As an alternative for future studies, the sperm analysis viewing chambers could be designed and microfabricated together with microfluidic mixers for a fully integrated, microfluidic sperm analysis system.
3.2. Characterization of mixing efficiency
Rapid and consistent activation of sperm with diluent within the PDMS-based herringbone micromixer is essential for reliable and accurate analysis of motility by CASA. Our goal was to achieve micromixing of two different fluids with at least 90% mixing efficiency in < 5 s. Fluorescent images at three different locations at 0, 3.5, and 7 mm from the T-junction showed the mixing progression of the two solutions, deionized water and fluorescein, qualitatively at a flow rate of 100 μL/h (Fig. 4). The first inset image shows the clear boundary of the two fluids at the inlet intersection without mixing. The second image shows the two fluids stretched and folded with mixing progression because of chaotic advection (with mixing efficiency of 75%). The third image shows the almost complete mixing of the two fluids (with mixing efficiency of 92%). The quantitative result of micromixing at a flow rate of 100 μL/h was obtained by correlating the measured fluorescence intensity values to mixing efficiency as a function of distance from the T-junction. The exponential trend in mixing of two solutions was observed as distance from the T-junction increased, showing a correspondence of distance and mixing efficiency, with a significant difference in mixing efficiency between 75 ± 4% at 3.5 mm and 92 ± 2% at 7.0 mm (anova; P = 0.002, F = 49.860, df =1). The target mixing efficiency of more than 90% at a distance of 7.0 mm from the T-junction corresponded to a calculated fluid transit time of 1.89 s.
Fig. 4.
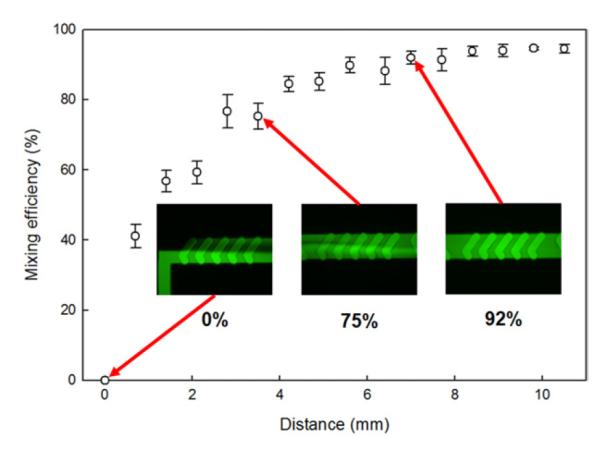
Mixing efficiency of a PDMS herringbone micromixer at a flow rate of 100 μL/h (insets show progress of water and fluorescein micromixing).
Evaluation of the efficiency of the herringbone micromixer at different flow rates was performed to investigate the effects of flow rate and the variation across three identical PDMS micromixers. A mixing efficiency of more than 90% was obtained for 100 μL/h rate and for other flow rates (Fig. 4 and Fig. 5A). For example, 92% mixing was obtained at a distance of 5.4 mm from the T-junction at a flow rate of 50 μL/h, and 90% mixing was obtained at a distance of 8.4 mm from the T-junction at a flow rate of 250 μL/h. The distance required to achieve a given mixing efficiency typically became longer as the flow rate increased, similar to observations in other reports with this style of micromixer [39]. The results confirmed that mixing of >90% required a shorter-distance at slower flow rates, and required a longer-distance at higher flow rates.
Fig. 5.

Mixing efficiencies of PDMS herringbone micromixers at various flow rates (A) as a function of distance (inset showing mixing distance required for 90% mixing, and error bars for SD) and (B) as a function of time required for 90% mixing.
Study of consistency in mixing efficiency among the three replicated devices showed that the standard deviation of mixing efficiency was larger when the efficiency was below 90% (Fig. 5A). In contrast, the standard deviation of mixing efficiency became smaller as the efficiency increased beyond 90%. For example, the standard deviation was ±5% at a distance of 2.8 mm and ±1% at a distance of 8.4 mm for the flow rate of 100 μL/h. This indicates that the mixing efficiency across replicate devices was consistent and reproducible when mixing efficiency was over 90%. Furthermore, there was a significant reduction of CV values from 3 at 6.3 mm to <1 at 7.0 mm, with the lowest CV of 0.06 at 10.5 mm along the channel. Based on the lowest variance observed, the minimum number of herringbone cycles sufficient for mixing of more than 90% was determined to be between 7 cycles (9.8 mm) and 7.5 cycles (10.5 mm), and thus the block of the PDMS micromixing devices was cut at 10 mm from the T-junction for reliable sperm activation and analysis. This eliminated an unnecessarily long channel that would increase residence time and delay CASA measurements. The time required to achieve mixing of at least 90% was calculated using the flow rate and dimensions of the microchannels, and was inversely proportional to the flow rate (Fig. 5B). A non-linear regression of these data points fitted well to an exponential decay function. For instance, mixing of more than 90% occurred within 3.03 s for a flow rate of 50 μL/h, and within 0.91 s for a rate of 250 μL/h. Although the higher rate enabled faster mixing, flow rates should be carefully selected, because the increased rate would, as mentioned above, require a longer microchannel for mixing, and also increase the back-pressure of the microchannel [39]; thus challenging the material bonding and macro-to-micro interfaces.
3.3. Zebrafish sperm activation and motility analysis
Motility analysis of sperm activated in the micromixer was investigated at flow rates of from 50 to 250 μL/h to determine the threshold for a maximal rate that yielded accurate motility data. To ensure the most accurate measurement of sperm motility, it is necessary to produce minimal bulk fluid drift in the CASA viewing chamber. To stop the bulk fluid for accurate motility measurements, the syringe pump was turned off after the cells entered the viewing chamber. With a flow rate of 100 μL/h, a period of 10 s after syringe pump cessation was sufficient to achieve minimal bulk fluid drift before initiating CASA. Figure 6A shows the sperm movement at a flow rate of 100 μL/h after waiting 10 s to reduce the bulk fluid drift.
Fig. 6.
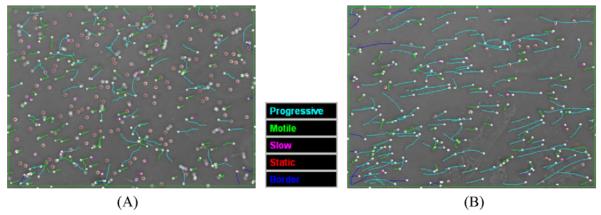
Images of CASA measurements showing traces of sperm movement (A) at a flow rate of 100 μL/h (315 total/167 motile/68 progressive) and (B) at a flow rate of 150 μL/h (242 total/202 motile/142 progressive).
When the flow rate was increased above 100 μL/h, the residence time of sperm in the main microchannel was shorter, resulting in quicker activation. A few sperm cells had faster movement than bulk fluid drift, confirming that increased flow rate enabled faster activation at the peak of sperm motility (Fig. 6B). However, at flow rates of 150 μL/h, there was significant bulk fluid drift, as noted by the multiple unidirectional traces of sperm movement (indicated by cyan and green colors in Fig. 6B) interfering with reliable motility measurement with CASA. After waiting an additional 10 s (for a total of 20 s), this bulk fluid drift stopped but there was a significant reduction in the percentage motility observed (below 40%) because of the delay. The drop in motility at the time of measurement became more significant as flow rate increased above 150 μL/h because of the longer delay period required for bulk flow cessation. This delay period constrained the determination of peak motility, because it is desirable to make measurements within 15 s of activation [9,10].
Therefore, based on the bulk flow results described above with this microfluidic design, 100 μL/h was chosen as the flow rate to achieve rapid mixing with minimal interference of bulk flow in the viewing chamber. Thus, sperm motility observed at this flow rate was compared to motility obtained by manual mixing. The average sperm motility from manual mixing by hand was 45 ± 7% (mean ± SD; n = 5). The total number of sperm cells was between 316 and 409 per viewing field, which is within the range reported for reliable sperm analysis [12]. Sperm activation and motility rates from the micromixer (56 ± 4%; total number of sperm cells: 206 ~ 303) were statistically higher than for hand mixing (n = 5, P = 0.011, F = 2.923, df =8, T = −3.284). The higher percentage of motility resulting from the micromixer could be due to rapid mixing that allowed more of the cells to be analyzed in their peak motile state, or some other factor that the mixer imparts on activation of these cells. There were no significant differences in VAP, VCL, and VSL for sperm motility from hand mixing and micromixing (Table 1). There were differences in STR (P = 0.0003, F = 38.4, df =1) and LIN (P = 0.0003, F = 36, df =1). In the case of LIN, it should be noted that while there was a difference between hand-mixing (80%) and micromixing (88%), neither of these treatments would be statistically different from the zebrafish LIN found by Wilson-Leedy and Ingermann with their custom CASA software system (84 ± 10%) [10]. The micromixer in PDMS had a smaller standard deviation in percent motility than hand mixing, indicating reliable activation with reduced user variation and greater control, although an F test revealed no significant difference between the standard deviations of the two methods (P = 0.162 F = 2.923, df =4) based on our studies done with experienced personnel. Overall these data support the feasibility of the micromixer device in being comparable to manual mixing of zebrafish sperm with diluent for activation.
Table 1.
Summary of CASA parameters for zebrafish sperm motility measurement activated by hand mixing and micromixing.
| Hand mixing | Micromixing | P | |
|---|---|---|---|
| VAP (μm/sec) | 77 ± 11 | 69 ± 14 | 0.303 |
| VSL(μm/sec) | 71 ± 11 | 65 ± 13 | 0.449 |
| VCL(μm/sec) | 86 ± 11 | 74 ± 13 | 0.132 |
| STR (%) | 89 ± 1 | 94 ± 1 | 0.0003 |
| LIN (%) | 80 ± 2 | 88 ± 2 | 0.0003 |
The observation of higher percent motility from microfluidic-mixed samples indicated that the potential shear stresses that sperm could encounter within the microchannels and herringbone depressions did not cause damage that precluded swimming behavior. While direct assays of cell damage such as viability stains or functional assessment such as fertilization tests were not performed, it can be concluded that because these sperm were motile at higher rates than those observed for mixing by hand, the mixer did not shear off sperm tails or induce other gross damage. It is important to note that shear forces could also be significant at the orifice of the micropipette tips used to manually mix sperm by hand, where flow profiles into and out of the pipette can vary based on user technique. At all the flow rates tested in the micromixer, no gross damage to sperm cells was observed, although at the lower flow rate of 50 μL/h, some sperm cells were trapped within the herringbone depressions.
There was a tradeoff in increasing flow through the mixer (which achieved rapid activation and transit of sperm to the viewing chamber) because longer delay times for cessation of bulk flow in the chamber were necessary for accurate CASA measurements. Further characterization of sperm cell velocities in the transition from mixing to viewing chamber regions would be useful for optimization of this device, and future design revisions could be used to address this problem. For example, this could be overcome by integrating a custom viewing chamber with the micromixer, and completely stopping the bulk fluid using valves or by regulating the microchannel flow rate [49] such that bulk fluid velocity is smaller than the cutoff VAP setting in the CASA software. In this study, standard zebrafish CASA parameters and viewing chamber slides were used so that direct comparison could be made to previous reports of hand-mixed sperm [12]. Stopping bulk flow within the Hamilton Thorne 2X-CEL CASA slides would be difficult without altering their structure. Future efforts are underway to stop the bulk fluid in an integrated device to reduce the delay period for flow cessation, which should improve the capability of the micromixer to measure immediate activation percentages and motility duration curves, yielding more reliable sperm motility analysis.
The current micromixer cast in PDMS and used for zebrafish sperm activation and motility analysis is practical to individually analyze samples and the device was reusable with subsequent samples after cleaning as described above. However, in the current prototype configuration, the rate of sample analysis by the micromixer was approximately one to two min longer compared to hand mixing analysis because of the set-up time for micromixing, and transition time of the influent streams from the syringes to the viewing chamber of the CASA slide. This hurdle will be addressed in future work by design with integrated viewing chambers, control of fluids within the device, and microfabrication of the micromixer in an array format to enable sample multiplexing to produce a high throughput evaluation platform for aquatic species sperm quality analysis.
4. Conclusions
The feasibility of using microfluidic mixing elements was demonstrated to decrease and standardize time to analysis, and to homogenize influent streams of zebrafish sperm with diluent for reliable estimation of motility analysis across users and laboratories. As such, this microfluidic mixing represents a step in streamlining methods of rapid, high-throughput aquatic species sperm quality evaluation with standardized, robust CASA techniques. This effort is in line with current work in development of high-throughput platforms for aquatic species sperm cryopreservation [50,51]. The micromixer fabricated in PDMS demonstrated rapid and consistent activation of zebrafish sperm with reduced user variation, greater control, and accurate analysis with standard CASA instrumentation and parameters. Using the micromixer resulted in statistically higher motility with a smaller standard deviation than for manual activation. Additionally, the high sperm motility suggests shear stress from herringbone depressions in microchannels did not appreciably affect viability.
The capability to rapidly homogenize a sperm sample with diluent in the PDMS-based herringbone micromixer is applicable not only to freshwater aquatic species, but also to saltwater species, where sperm activation is achieved by increasing the osmolality of the sperm medium. This reduces the need for multiple methods to activate sperm from diverse aquatic species, regardless of activation mechanism, and could improve germplasm studies for additional factors that affect sperm motility, such as media salinity. The compatibility of the PDMS micromixer with existing CASA systems makes practical laboratory use of the mixer easier to implement. As a result, the mixer is an initial step towards a high-throughput platform for accurate and consistent evaluation of sperm motility. Further studies with PDMS micromixers for activation and motility analysis of fresh and thawed zebrafish sperm could provide significant benefits for cryopreservation evaluation for aquatic species sperm, including the effects of cryoprotectants and other relevant factors (such as handling or refrigerated storage at 4 °C) on sperm viability.
Acknowledgments
We thank J. Guy, J. Audiffred, C. Kennedy, and J. Scheibal for design, fabrication, and discussion of early prototypes, and the Center for Advanced Microstructures and Devices (CAMD) at LSU for microfabrication support. We thank H. Yang, C. Quitadamo, R. Cuevas-Uribe, E. Tan, J. Atiliano, and M. Christensen for technical assistance with sperm collection and computer-assisted sperm analysis (CASA) analysis. This work was supported in part by funding from the NIH National Center for Research Resources (R24-RR023998-02 and ARRA supplement) and the LSU College of Agriculture undergraduate research grants.
References
- [1].Dooley K, Zon LI. Zebrafish: a model system for the study of human disease. Curr Opin Genet Dev. 2000;10:252–6. doi: 10.1016/s0959-437x(00)00074-5. [DOI] [PubMed] [Google Scholar]
- [2].Grunwald DJ, Eisen JS. Headwaters of the zebrafish - emergence of a new model vertebrateHeadwaters of the zebrafish – emergence of a new model vertebrate. Nat Rev Genet. 2002;3:717–24. doi: 10.1038/nrg892. [DOI] [PubMed] [Google Scholar]
- [3].Spitsbergen JM, Kent ML. The state of the art of the zebrafish model for toxicology and toxicologic pathology research–advantages and current limitations. Toxicol Pathol. 2003;31:62–87. doi: 10.1080/01926230390174959. [DOI] [PMC free article] [PubMed] [Google Scholar]
- [4].Ny A, Autiero M, Carmeliet P. Zebrafish and Xenopus tadpoles: small animal models to study angiogenesis and lymphangiogenesis. Exp Cell Res. 2006;312:684–93. doi: 10.1016/j.yexcr.2005.10.018. [DOI] [PubMed] [Google Scholar]
- [5].Yang H, Tiersch TR. Current status of sperm cryopreservation in biomedical research fish models: zebrafish, medaka, and Xiphophorus. Comp Biochem Physiol C. 2009;149:224–32. doi: 10.1016/j.cbpc.2008.07.005. [DOI] [PMC free article] [PubMed] [Google Scholar]
- [6].Hagedorn M, Ricker J, McCarthy M, Meyers SA, Tiersch TR, Varga ZM, et al. Biophysics of zebrafish (Danio rerio) sperm. Cryobiology. 2009;58:12–9. doi: 10.1016/j.cryobiol.2008.09.013. [DOI] [PMC free article] [PubMed] [Google Scholar]
- [7].Yang H, Tiersch TR. Sperm cryopreservation in biomedical research fish models. In: Tiersch TR, Green CC, editors. Cryopreservation in aquatic species. 2nd ed World Aquaculture Society; Baton Rouge, LA: 2011. pp. 439–54. [Google Scholar]
- [8].Tiersch TR. Process pathways for cryopreservation research, application and commercialization. In: Tiersch TRGreen CC, editor. Cryopreservation in aquatic species. 2nd ed World Aquaculture Society; Baton Rouge, LA: 2011. pp. 646–71. [Google Scholar]
- [9].Wolenski JS, Hart NH. Scanning electron microscope studies of sperm incorporation into the zebrafish (Brachydanio) egg. J Exp Zool. 1987;243:259–73. doi: 10.1002/jez.1402430211. [DOI] [PubMed] [Google Scholar]
- [10].Wilson-Leedy JG, Ingermann RL. Development of a novel CASA system based on open source software for characterization of zebrafish sperm motility parameters. Theriogenology. 2007;67:661–72. doi: 10.1016/j.theriogenology.2006.10.003. [DOI] [PubMed] [Google Scholar]
- [11].Alavi SM, Cosson J. Sperm motility in fishes. (II) effects of ions and osmolality: a review. Cell Biol Int. 2006;30:1–14. doi: 10.1016/j.cellbi.2005.06.004. [DOI] [PubMed] [Google Scholar]
- [12].Verstegen J, Iguer-Ouada M, Onclin K. Computer assisted semen analyzers in andrology research and veterinary practice. Theriogenology. 2002;57:149–79. doi: 10.1016/s0093-691x(01)00664-1. [DOI] [PubMed] [Google Scholar]
- [13].Yang H, Tiersch TR. Application of computer-assisted sperm analysis (CASA) to aquatic species. In: Tiersch TR, Green CC, editors. Cryopreservation in aquatic species. 2nd ed World Aquaculture Society; Baton Rouge, LA: 2011. pp. 240–54. [Google Scholar]
- [14].Park DS, Quitadamo C, Tiersch TR, Monroe WT. Microfluidic mixers for standardization of computer-assisted sperm analysis. In: Tiersch TR, Green CC, editors. Cryopreservation in aquatic species. 2nd ed World Aquaculture Society; Baton Rouge, LA: 2011. pp. 261–72. [Google Scholar]
- [15].Beebe DJ, Mensing GA, Walker GM. Physics and applications of microfluidics in biology. Annu Rev Biomed Eng. 2002;4:261–86. doi: 10.1146/annurev.bioeng.4.112601.125916. [DOI] [PubMed] [Google Scholar]
- [16].Fiorini GS, Chiu DT. Disposable microfluidic devices: fabrication, function, and application. BioTechniques. 2005;38:429–46. doi: 10.2144/05383RV02. [DOI] [PubMed] [Google Scholar]
- [17].Weibel DB, DiLuzio WR, Whitesides GM. Microfabrication meets microbiology. Nat Rev Microbiol. 2007;5:209–18. doi: 10.1038/nrmicro1616. [DOI] [PubMed] [Google Scholar]
- [18].Suh RS, Zhu X, Phadke N, Ohl DA, Takayama S, Smith GD. IVF within microfluidic channels requires lower total numbers and lower concentrations of sperm. Hum Reprod. 2006;21:477–83. doi: 10.1093/humrep/dei323. [DOI] [PubMed] [Google Scholar]
- [19].Suh RS, Phadke N, Ohl DA, Takayama S, Smith GD. Rethinking gamete/embryo isolation and culture with microfluidics. Hum Reprod Update. 2003;9:451–61. doi: 10.1093/humupd/dmg037. [DOI] [PubMed] [Google Scholar]
- [20].Smith GD, Takayama S. Gamete and embryo isolation and culture with microfluidics. Theriogenology. 2007;68:S190–5. doi: 10.1016/j.theriogenology.2007.04.033. [DOI] [PubMed] [Google Scholar]
- [21].Cho BS, Schuster TG, Zhu X, Chang D, Smith GD, Takayama S. Passively driven integrated microfluidic system for separation of motile sperm. Anal Chem. 2003;75:1671–5. doi: 10.1021/ac020579e. [DOI] [PubMed] [Google Scholar]
- [22].Suh R, Takayama S, Smith GD. Microfluidic applications for andrology. J Androl. 2005;26:664–70. doi: 10.2164/jandrol.05119. [DOI] [PubMed] [Google Scholar]
- [23].Wu JM, Chung Y, Belford KJ, Smith GD, Takayama S, Lahann J. A surface-modified sperm sorting device with long-term stability. Biomed Microdevices. 2006;8:99–107. doi: 10.1007/s10544-006-7705-7. [DOI] [PubMed] [Google Scholar]
- [24].Seo D-B, Agca Y, Feng Z, Critser J. Development of sorting, aligning, and orienting motile sperm using microfluidic device operated by hydrostatic pressure. Microfluid Nanofluid. 2007;3:561–70. [Google Scholar]
- [25].Sano H, Matsuura K, Naruse K, Funahashi H. Application of a microfluidic sperm sorter to the in-vitro fertilization of porcine oocytes reduced the incidence of polyspermic penetration. Theriogenology. 2010;74:863–70. doi: 10.1016/j.theriogenology.2010.04.011. [DOI] [PubMed] [Google Scholar]
- [26].Horsman KM, Barker SLR, Ferrance JP, Forrest KA, Koen KA, et al. Separation of sperm and epithelial cells in a microfabricated device: potential application to forensic analysis of sexual assault evidence. Anal Chem. 2004;77:742–9. doi: 10.1021/ac0486239. [DOI] [PubMed] [Google Scholar]
- [27].Norris JV, Evander M, Horsman-Hall KM, Nilsson J, Laurell T, Landers JP. Acoustic differential extraction for forensic analysis of sexual assault evidence. Anal Chem. 2009;81:6089–95. doi: 10.1021/ac900439b. [DOI] [PubMed] [Google Scholar]
- [28].Zeggari R, Wacogne B, Pieralli C, Roux C, Gharbi T. A full micro-fluidic system for single oocyte manipulation including an optical sensor for cell maturity estimation and fertilisation indication. Sens Actuat Bchem. 2007;125:664–71. [Google Scholar]
- [29].Ohta AT, Garcia M, Valley JK, Banie L, Hsu HY, Jamshidi A, et al. Motile and non-motile sperm diagnostic manipulation using optoelectronic tweezers. Lab Chip. 2010;10:3213–7. doi: 10.1039/c0lc00072h. [DOI] [PubMed] [Google Scholar]
- [30].Lopez-Garcia MD, Monson RL, Haubert K, Wheeler MB, Beebe DJ. Sperm motion in a microfluidic fertilization device. Biomed Microdevices. 2008;10:709–18. doi: 10.1007/s10544-008-9182-7. [DOI] [PubMed] [Google Scholar]
- [31].Nguyen N-T, Wu Z, Micromixers A review. J Micromech Microeng. 2005;15:R1. [Google Scholar]
- [32].Hessel V, Löwe H, Schönfeld F. A review on passive and active mixing principles. Chem Eng Sci. 2005;60:2479–501. [Google Scholar]
- [33].Glasgow I, Aubry N. Enhancement of microfluidic mixing using time pulsing. Lab Chip. 2003;3:114–20. doi: 10.1039/b302569a. [DOI] [PubMed] [Google Scholar]
- [34].El Moctar AO, Aubry N, Batton J. Electro-hydrodynamic micro-fluidic mixer. Lab Chip. 2003;3:273–80. doi: 10.1039/b306868b. [DOI] [PubMed] [Google Scholar]
- [35].Oddy MH, Santiago JG, Mikkelsen JC. Electrokinetic instability micromixing. Anal Chem. 2001;73:5822–32. doi: 10.1021/ac0155411. [DOI] [PubMed] [Google Scholar]
- [36].Bau HH, Zhong J, Yi M. A minute magneto hydro dynamic (MHD) mixer. Sens. Actuators B: Chem. 2001;79:207–15. [Google Scholar]
- [37].Liu RH, Yang J, Pindera MZ, Athavale M, Grodzinski P. Bubble-induced acoustic micromixing. Lab Chip. 2002;2:151–7. doi: 10.1039/b201952c. [DOI] [PubMed] [Google Scholar]
- [38].Stroock AD, Dertinger SK, Ajdari A, Mezic I, Stone HA, Whitesides GM. Chaotic mixer for microchannels. Science. 2002;295:647–51. doi: 10.1126/science.1066238. [DOI] [PubMed] [Google Scholar]
- [39].Williams MS, Longmuir KJ, Yager P. A practical guide to the staggered herringbone mixer. Lab Chip. 2008;8:1121–9. doi: 10.1039/b802562b. [DOI] [PMC free article] [PubMed] [Google Scholar]
- [40].Hossain S, Husain A, Kim K-Y. Shape optimization of a micromixer with staggered-herringbone grooves patterned on opposite walls. Chem Eng J. 2010;162:730–7. [Google Scholar]
- [41].Johnson TJ, Ross D, Locascio LE. Rapid microfluidic mixing. Anal Chem. 2002;74:45–51. doi: 10.1021/ac010895d. [DOI] [PubMed] [Google Scholar]
- [42].Yang H, Carmichael C, Varga ZM, Tiersch TR. Development of a simplified and standardized protocol with potential for high-throughput for sperm cryopreservation in zebrafish Danio rerio. Theriogenology. 2007;68:128–36. doi: 10.1016/j.theriogenology.2007.02.015. [DOI] [PMC free article] [PubMed] [Google Scholar]
- [43].Tan E, Yang H, Tiersch TR. Determination of sperm concentration for small-bodied biomedical model fishes by use of microspectrophotometry. Zebrafish. 2010;7:233–40. doi: 10.1089/zeb.2010.0655. [DOI] [PMC free article] [PubMed] [Google Scholar]
- [44].Hupert M, Guy W, Llopis S, Situma C, Rani S, et al. High-precision micromilling for low-cost fabrication of metal mold masters. Proc SPIE Int Soc Opt Eng. 2006:61120B/1–20B/12. [Google Scholar]
- [45].Hupert M, Guy W, Llopis S, Shadpour H, Rani S, et al. Evaluation of micromilled metal mold masters for the replication of microchip electrophoresis devices. Microfluid Nanofluid. 2007;3:1–11. [Google Scholar]
- [46].Park DS-W, Chen P-C, You BH, Kim N, Park T, et al. Titer plate formatted continuous flow thermal reactors for high throughput applications: fabrication and testing. J Micromech Microeng. 2010;20:055003. [Google Scholar]
- [47].Duffy DC, McDonald JC, Schueller OJ, Whitesides GM. Rapid prototyping of microfluidic systems in poly(dimethylsiloxane) Anal Chem. 1998;70:4974–84. doi: 10.1021/ac980656z. [DOI] [PubMed] [Google Scholar]
- [48].Christensen AM, et al. Characterization of interconnects used in PDMS microfluidic systems. J Micromech Microeng. 2005;15:928. [Google Scholar]
- [49].Bong KW, Chapin SC, Pregibon DC, Baah D, Floyd-Smith TM, Doyle PS. Compressed-air flow control system. Lab Chip. 2011;11:743–7. doi: 10.1039/c0lc00303d. [DOI] [PubMed] [Google Scholar]
- [50].Hu E, Yang H, Tiersch TR. High-throughput cryopreservation of spermatozoa of blue catfish (Ictalurus furcatus): establishment of an approach for commercial-scale processing. Cryobiology. 2011;62:74–82. doi: 10.1016/j.cryobiol.2010.12.006. [DOI] [PMC free article] [PubMed] [Google Scholar]
- [51].Hu E, Tiersch TR. Development of high-throughput cryopreservation for aquatic species. In: Tiersch TR, Green CC, editors. Cryopreservation in aquatic species. 2nd ed World Aquaculture Society; Baton Rouge, LA: 2011. pp. 995–1003. [Google Scholar]