

Abstract
Objective
Several lines of evidence implicate gray matter abnormalities in the prefrontal cortex and anterior cingulate cortex in patients with bipolar disorder. Findings however, have been largely inconsistent across studies. Differences in patients’ medication status or mood state, or the application of traditional volumetric methods that are insensitive to subtle neuroanatomic differences may have contributed to these inconsistent findings. Given this, we used magnetic resonance imaging (MRI) in conjunction with cortical pattern matching methods to assess cortical thickness abnormalities in euthymic bipolar subjects who were not treated with lithium.
Method
Sixty-five subjects, including 34 lithium-free euthymic subjects with bipolar (type I) disorder and 31 healthy subjects were scanned using magnetic resonance imaging (MRI). Data were processed to measure cortical gray matter thickness. Cortical pattern matching methods associated homologous brain regions across subjects. Spatially normalized thickness maps were analyzed to assess illness effects and associations with clinical variables.
Results
Relative to healthy subjects, euthymic bipolar I subjects had significantly thinner gray matter in bilateral prefrontal cortex (Brodmann Areas 11, 10, 8 and 44) and left anterior cingulate cortex (Brodmann Areas 24/32). Additionally, thinning in these regions was more pronounced in patients with a history of psychosis. No areas of thicker cortex were detected in bipolar subjects versus healthy subjects.
Conclusions
Using a technique that is highly sensitive to subtle neuroanatomic differences, significant regional cortical thinning was found in euthymic subjects with bipolar disorder. Clinical implications are discussed.
Introduction
Bipolar disorder affects 1.5–3% of the population (1), yet the neurophysiologic basis for this disorder remains unknown. Structural neuroimaging studies using region of interest based techniques have reported that bipolar subjects exhibit volumetric reductions in gray matter subregions of the frontal lobe, including left subgenual (2, 3), left dorsomedial (4), bilateral inferior and middle prefrontal cortex (4, 5) and bilateral anterior cingulate cortex (6). However, other region of interest-based studies of bipolar disorder have reported increased volume (7) or no change (8) in these regions relative to healthy subjects. Studies using methods that compare gray matter on a point-by-point basis, such as voxel based morphometry, have found similar gray matter deficits in left subgenual (9), left middle (9), bilateral inferior prefrontal cortex (10) and left anterior cingulate cortex (10). Yet other voxel based morphometry studies have found either no change in frontal regions (11, 12), or an increase in gray matter in patients compared to healthy subjects (13).
Among the possible causes for these inconsistencies is the heterogeneity of patient samples. Most studies have included patients treated with lithium, a medication associated with increases in cortical and subcortical gray matter volume (14–16). Most prior reports have also included patients in various mood states at the time of scanning, despite recent evidence demonstrating volume reductions in depressed versus euthymic bipolar subjects (8, 17). A majority of prior reports have additionally not controlled for the wide variations in gyral patterning that naturally exist between individuals, and which may cause errors in registration and subsequent morphometric analyses (18).
Given these issues, we sought to examine cortical thickness abnormalities using surface-based brain mapping methods in a sample of bipolar I subjects who were free from lithium medication and were in a euthymic mood state. We employed a specialized registration procedure, known as cortical pattern matching, which improves upon traditional registration approaches by aligning structural or functional MR images across subjects using sulcal features. Through explicitly identifying sulcal landmarks and using these as anchors in a warping process, cortical pattern matching achieves an overlapping sulcal alignment across subjects. This matching of sulcal anatomy eliminates much of the confounding anatomical variance when pooling data and significantly boosts power, making it easier to identify and localize subtle differences in brain structure between groups (19). Using these methods, we hypothesized, based on previous structural neuroimaging studies and studies of neurocognitive function (4, 9), that lithium-free, euthymic bipolar subjects would show reduced gray matter thickness in prefrontal cortex and anterior cingulate cortex compared to healthy subjects.
Method
Subjects
The Institutional Review Boards at UCLA and the VA Greater Los Angeles Healthcare System approved the study. Each subject provided written informed consent. Subjects with bipolar I disorder were recruited through the outpatient UCLA Mood Disorders Clinic, and the outpatient Bipolar Disorders Clinic of the Veterans Affairs Greater Los Angeles Health Care System. Healthy subjects were recruited by advertisement in local newspapers and campus flyers. Exclusion criteria for all subjects included left-handedness, hypertension, neurological illness, metal implants and a history of skull fracture or head trauma with loss of consciousness >5 minutes.
All bipolar and healthy subjects were evaluated using the Structured Clinical Interview for DSM-IV (SCID) to confirm diagnosis or absence thereof. Bipolar subjects with other active Axis I co-morbidities or current lithium use were excluded. Current lithium use was defined as treatment with lithium medication within one month prior to scanning. Healthy subjects were excluded for current or past psychiatric diagnosis (including history of substance abuse) or current medication use.
In total, 34 subjects with bipolar type I disorder (13f; 38.1±12.0 years), currently euthymic, and 31 healthy subjects (13f; 37.8±13.1years) were included in the study. Demographic and clinical characteristics for all subjects are presented in Table 1. Euthymia was defined as a lack of meeting criteria for a current manic, hypomanic or depressive mood episode for the past month as assessed by the SCID interview. Additionally, a Young Mania Rating Scale (YMRS) (20) score of <7, and a 21-item Hamilton Depression Rating Scale (HAM-D) (21) score of <7 on the day of scanning were required for participation. History of psychosis was assessed using SCID interviews.
Table 1.
Sample demographics
| Demographic variable | Subjects with bipolar disorder (N=34) | Healthy Subjects (N=31) | Group difference | ||
|---|---|---|---|---|---|
|
| |||||
| Mean | SD | Mean | SD | ||
| Age (years) | 38.1 | 12.0 | 37.8 | 13.1 | t=−0.110, p=0.91 |
| Education levela | 3.0 | 0.6 | 3.2 | 0.6 | p=0.36 |
| HAMDb | 4.5 | 2.3 | - | - | - |
| YMRSc | 1.7 | 2.2 | - | - | - |
| Duration of illness (years) | 19.8 | 12.5 | - | - | - |
| Age at onset | 18.2 | 7.5 | - | - | - |
| Prior manias | 7.7 | 11.6 | - | - | - |
| Prior depressions | 8.4 | 11.0 | - | - | - |
| Prior hospitalizations | 2.6 | 2.7 | - | - | - |
| Prior hospitalizations for mania | 1.7 | 1.7 | - | - | - |
| Prior hospitalizations for depression | 0.9 | 1.3 | - | - | - |
| Duration between diagnosis and first medication treatment (years) | 8.5 | 9.9 | - | - | - |
|
| |||||
| N | % | N | % | ||
|
| |||||
| Female | 13 | 38 | 13 | 42 | p=1.00 |
| Race | |||||
| Caucasian | 25 | 73 | 21 | 67 | p=0.18 |
| Asian | 2 | 6 | 7 | 23 | - |
| African American | 6 | 18 | 3 | 10 | - |
| Other | 1 | 3 | 0 | 0 | - |
| History of psychosis | 17 | 50 | - | - | - |
| Patient medications | |||||
| Unmedicated | 10 | 29 | - | - | - |
| Lithium | 0 | 0 | - | - | - |
| Anticonvulsantsd | 18 | 53 | - | - | - |
| Antipsychoticse | 17 | 50 | - | - | - |
| Antidepressantsf | 9 | 26 | - | - | - |
| Benzodiazapineg | 1 | 3 | - | - | - |
Educational level for each subject was rated on a four-point scale (1, grade 8 or less; 2, grade 9–12; 3, 1–4 years of college or university; 4, four or more years of college or university);
Hamilton Depression Rating Scale;
Young Mania Rating Scale;
includes treatment with Divalproex sodium (N=5), Lamotrigine (N=10), Oxcarbazepine (N=1) or Carbamazepine (N=2);
includes treatment with Aripiprazole (N=8), Risperidone (N=1), Ziprasidone (N=1), Olanzapine (N=3), Quetiapine (N=4);
includes treatment with Paroxetine (N=1), Fluoxetine (N=2), Citalopram (N=1), Escitalopram (N=1), Venlafaxine (N=1), Bupropion (N=2), Trazodone (N=1);
includes treatment with Temazepam (N=1). Months euthymic indicated time euthymic prior to scanning. All p values indicate 2-tailed significance levels.
Information on prior course of illness and prior and current medication use for patients was obtained by self-report, by reference to medical records when available, and by corroboration of family members or significant others when subjects allowed this. No patients were taking lithium medication at the time of scanning; only 8 (27%) had taken this medication in the past; 10 were taking no medications at the time of scanning, and 24 were taking other medications (Table 1).
Data acquisition
Contiguous sagittal high-resolution three-dimensional MP-RAGE T1-weighted images were obtained using a 1.5 Tesla Siemens Sonata MRI scanner, at the UCLA Ahmanson-Lovelace Brain Mapping Center (160 slices, field of view: 256 mm; isotropic voxel size 1 mm3; TR=1900 ms; TE=4.38 ms; flip angle: 15 degrees; averages=4; total scan time=8.14 min).
Data analysis
Analysis of demographic variables
Statistical analysis of demographic variables was performed using the R statistical software package (http://www.r-project.org). Group differences in categorical and continuous demographic variables were checked for using 2-tailed Fisher’s exact and independent t-tests, respectively. Statistical significance was defined at α=0.05.
Analysis of image data
MR images were processed on a Silicon Graphics Reality Monster supercomputer by an image analyst (L.C.F.R.) who was blinded to subject information using a series of manual and automated procedures that are described below and summarized in Figure 1.
Figure 1.
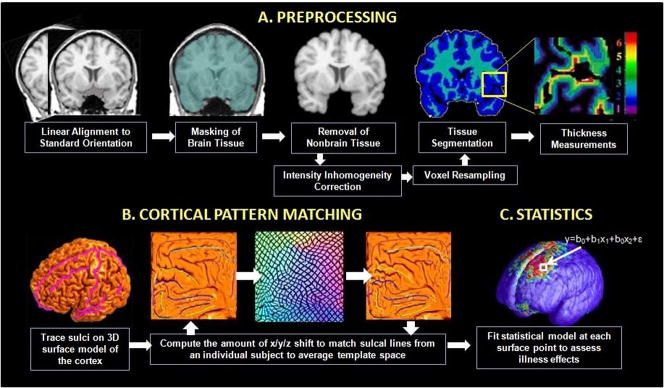
(A) Steps required to derive cortical thickness maps from the each subject’s MR image volume (for details, see Data Analysis). (B) Cortical pattern matching is used to align cortical features across subjects to bring cortical thickness maps into correspondence; this procedure involves the flattening of individual cortical surfaces for alignment with a group average sulcal pattern. (C) Once aligned to the mean template, group differences in gray matter thickness can be mapped at each cortical surface point.
Image preprocessing
Image preprocessing steps consisted of: (1) adjustment for head position and transformation of data into a common stereotaxic coordinate system without scaling (http://www.bic.mni.mcgill.ca/software); (2) automated removal of cerebellum and non-brain tissue (22); (3) correction of artifactual intensity non-uniformities (23); (4) resampling at 0.33mm cubic voxels to allow estimation of cortical thickness with sub-voxel accuracy, and (5) automatic classification of voxels into gray matter, white matter and cerebrospinal fluid (CSF) using a partial volume classification method (22).
Analysis of whole brain and segmented tissue volumes
Total brain volume was calculated from preprocessed MRI volumes. Total gray and white matter volume were calculated from segmented MRI volumes. Diagnosis effects on gray matter volume and white matter volume were examined in R using multiple regression, controlling for age, gender and total brain volume. Diagnosis effects on total brain volume were examined controlling for age and gender.
Measurement of cortical gray matter thickness
Prior to registration using cortical pattern matching, cortical thickness was first computed separately for each subject. Thickness was defined as the shortest three-dimensional distance from the cortical white-gray matter boundary to the hemispheric surface without crossing voxels classified as CSF. The three-dimensional Eikonal equation (19) was applied to voxels segmenting as gray matter to compute this distance (in millimeters) in a fully automated manner at each point along the cortical surface. Because we expected to find differences at approximately the size of a gyrus or larger, we used a uniform spatial filter of a radius of 15mm. These methods have been shown to produce thickness measurements that agree with those found in postmortem samples (24, 25), and that are stable over time in validation studies using short-interval repeat scanning of multiple subjects (25).
Cortical pattern matching procedure
Following image preprocessing, each subject’s scan was processed to create a three-dimensional surface model of the cortex using automated software that deforms a spherical mesh surface to fit cortical surface tissue using a threshold intensity value that differentiates extra-cortical CSF from brain tissue (26). Thirty-one separate sulci were then manually delineated on each subject’s surface model. Sulcal tracing was performed using the MNI-Display software package (http://www.bic.mni.mcgill.ca/software) by a trained researcher (J.S.) who was blind to subject characteristics using a previously validated surface-based anatomical protocol (25). Tracer reliability was measured using the three-dimensional root mean square difference (in mm) between sulci in a set of six test brains and those of a gold standard set. Disparities between the test and gold standard brains were computed to be <2mm for all landmarks.
Warping algorithms computed the amount of shift in the x, y and z directions needed to explicitly match each sulcus in each subject to that of the average anatomical study template, generated from subjects in the current study (patients and healthy subjects, combined) (19). Importantly, cortical pattern matching algorithms were used to associate the same parameter space coordinates across subjects, without actually warping cortical surface models. This process re-parameterized individual cortical models so that corresponding anatomy across subjects bears the same coordinate locations.
Group differences in cortical thickness
Following the alignment of individual subject thickness maps using cortical pattern matching procedures, statistical analyses were performed at each cortical surface point to assess group differences in gray matter thickness using R (http://www.r-project.org). Between-group (healthy versus bipolar) differences in cortical gray matter thickness were determined using a general linear model at each of 65,536 points across the cortical surface while controlling for age, gender and total brain volume. Statistics from this analysis were mapped as uncorrected color-coded p values to provide a visual representation of illness effects. The maps were corrected for multiple comparisons using the procedures described below.
Based on our strong a priori hypotheses regarding specific brain regions that might be affected in bipolar illness, we assessed thickness in two regions, the prefrontal cortex and anterior cingulate cortex. The anatomic boundaries for each of the two regions of interest have been defined previously (14). Briefly, the prefrontal cortex contained all cortical gray matter anterior to the precentral sulcus and superior and anterior to the cingulate sulcus. The anterior cingulate cortex contained all cortical gray matter anterior to the paracentral sulcus, inferior to the cingulate sulcus and posterior to the pericallosal sulcus. Exploratory follow-up analyses were also conducted to determine which subregions of the prefrontal and anterior cingulate cortex were driving any overall significant findings. These smaller subregions were positioned within the broader prefrontal cortex and anterior cingulate regions of interest and defined using Brodmann’s Areas that were deformed to the study-specific average anatomical template using the Deformable Brodmann Area Atlas (27) (Figure 2).
Figure 2.
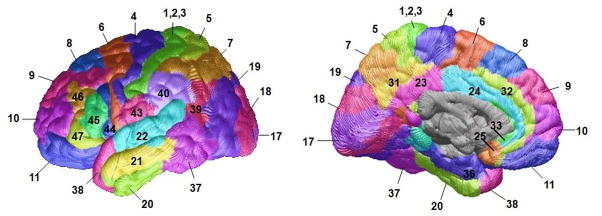
Brodmann Areas deformed to the average anatomical template using the Deformable Brodmann Area Atlas (27).
For these and all other thickness analyses, correction for multiple comparisons (arising from fitting a separate model at each surface point within each region) was performed using permutation testing (19). This method randomly permutes group membership 1,000,000 times to measure the distribution of features in the statistical maps that would be observed by accident. This resulted in a single p value for each region of interest that was corrected for multiple comparisons across surface points contained within that region. A two-tailed alpha level of 0.05 was set as the threshold for statistical significance. Given that our primary hypotheses were limited to two brain regions, and given that the follow-up subregional (Brodmann Area) analyses were exploratory in nature, no additional correction (e.g. Bonferroni) was made for the number of regions tested.
Association of cortical thickness with course of illness variables
Point-wise associations between gray matter thickness and continuous course of illness variables were explored using partial correlation analyses. Gender and total brain volume were included as covariates in analyses of course of illness variables that were highly collinear with age, such as illness duration (r=0.82, p< 0.0001). All other analyses controlled for gender, total brain volume and age. Correlations were screened for within search regions defined by areas showing a significant group difference in the analysis of diagnosis effects in prefrontal cortex and anterior cingulate cortex.
Examination of history of psychosis effects on cortical thickness
To examine whether a history of psychosis was associated with alterations in cortical gray matter, patients with and without a history of psychosis were compared using multiple linear regression at each cortical surface point, controlling for age, gender and total brain volume.
Results
Subject demographics
Bipolar subjects did not differ significantly from healthy subjects in age, gender, handedness, educational level or race (Table 1). On the day of the scan, bipolar patients’ average HAMD and YMRS scores were 4.5±2.3 and 1.7± 2.2, respectively. Seventeen (50%) of the bipolar subjects had experienced psychotic symptoms during prior manic or depressive episodes, as determined during SCID interviews, and were classified as having a history of psychosis.
Whole brain tissue volumes
Multiple regression analyses revealed no significant effects of diagnosis on cortical tissue volumes, including total brain volume (F=0.70, df=1, 61, p=0.407), gray matter volume (F=1.48, df=1, 60, p=0.228) or white matter volume (F=0.44, df=1, 60, p=0.508).
Cortical gray matter thickness
Pointwise analysis of cortical gray matter thickness, controlling for age, gender and total brain volume, revealed significant effects of diagnosis across widespread areas of the cortex. Spatial patterns of regional thinning in patients relative to healthy subjects are mapped onto the three-dimensional group averaged hemispheric surface model as uncorrected p values (Figure 3). These uncorrected two-tailed probability maps are thresholded at a value of 0.05 with more significant regions encoded by corresponding color bars. Regional corrected p values, obtained using permutation methods described above, are shown in Table 2. Permutation testing results revealed a significant effect of diagnosis in prefrontal cortex bilaterally (left: F=6.88, df=1, 60, p=0.011; right: F=4.41, df=1, 60, p=0.040,) and in the left anterior cingulate cortex (left: F=5.53, df=1, 60, p=0.022; right: F=0.91, df=1, 60, p=0.343). Within the prefrontal cortex, permutation testing revealed that cortical thinning in patients was localized to bilateral orbital (Brodmann Area 11, F=8.12, df=1, 60, p=0.006), left dorsomedial (Brodmann Area 8, F=4.15, df=1, 60, p=0.046), left ventrolateral (Brodmann Area 44, F=4.50, df=1, 60, p=0.038) and left frontopolar cortex (Brodmann Area 10, F=5.62, df=1, 60, p=0.021). Within the anterior cingulate cortex, permutation testing showed thinning was localized to the left anterior cingulate (Brodmann Area 24, F=7.08, df=1, 60, p=0.010) and left pericingulate (Brodmann Area 32, F=6.14, df=1, 60, p=0.016) cortices. No areas of thicker cortex were detected in patients relative to healthy subjects. While these subregional analyses were intended as exploratory, we note that several of the results would survive an additional correction for multiple comparisons. In particular, a Bonferroni correction for the 8 Brodmann’s Areas within the prefrontal cortex would reduce the significance threshold from α=0.05 to α*=0.00625 (0.05/8), a standard that is met by thinning in bilateral orbitofrontal cortex (Brodmann Area 11, p=0.006). Similarly, thinning in the left anterior cingulate (Brodmann Area 24, p=0.0100) would survive a correction to α*=0.0125 (0.05/4) for the 4 Brodmann’s Areas contained within this area.
Figure 3.

Cortical thickness maps showing gray matter decreases (A) and increases (B) in bipolar subjects (N=34) relative to healthy subjects (N=31). Percent difference maps (C) show the magnitude of cortical thickness reductions in patients. Probability maps show thresholded, uncorrected p values in color for areas showing a regional cortical thickness difference between groups. Corrected p values are presented in Table 2.
Table 2.
Frontal lobe subregions showing different cortical thickness between subjects with bipolar disorder and healthy subjects
| Cortical region | Hemisphere | BA | p value |
|---|---|---|---|
| Orbital PFC | Left | 11 | 0.006 |
| Right | 11 | 0.006 | |
| Frontopolar PFC | Left | 10 | 0.021 |
| Ventrolateral PFC | Left | 44 | 0.038 |
| Dorsomedial PFC | Left | 8 | 0.046 |
| Right | 8 | 0.085 | |
| Left | 9 | 0.071 | |
| ACC | Left | 24 | 0.010 |
| Left | 32 | 0.016 |
BA = Brodmann Area; PFC = prefrontal cortex; ACC = anterior cingulate cortex; p values indicate corrected 2-tailed significance levels after controlling for age, gender and total brain volume following permutation testing.
The impact of current medications on cortical thickness was additionally explored through direct pointwise group comparisons between euthymic patients who were currently (N=24) or were not currently (N=10) treated with medications at the time of scanning. These analyses revealed no areas of significant difference (all p’s>0.05).
Furthermore, to examine the influence of prior lithium exposure as a potential confound on cortical gray matter thickness, analyses were conducted comparing cortical thickness between patients who had (N=8) and who had not (N=22) been clearly documented to have taken this medication in the past. Results from this analysis showed no areas of significant group difference in cortical thickness (all p’s>0.05), suggesting that prior lithium use itself was not a significant confounder.
Association with prior course of illness
Within prefrontal and anterior cingulate cortex Brodmann Areas of patients, thickness was negatively associated in the left hemisphere with duration of illness (Brodmann Areas 24, 43 and 8, F≥4.17, df=1, 30, p≤0.05), duration of time between illness onset and initiation of medication treatment (Brodmann Areas 24, 32 and 8; F≥4.17, df=1, 30, p≤0.05) and prior number of depressions (Brodmann Areas 8, 10 and 11; F≥4.17, df=1, 30, p≤0.03). However, because age shared a high collinearity with these variables, we, like prior studies (28, 29), could not disentangle course of illness effects from the effects of normal aging. Additionally, although no main effect of illness was detected in subgenual region of the left prefrontal cortex (Brodmann Area 25), a highly significant positive association was detected in this region between thickness and prior number of hospitalizations for mania (F=5.21, df=1, 29, p=0.030).
Examination of history of psychosis effects on cortical thickness
Relative to patients without a history of psychosis, those with such a history demonstrated significantly greater thinning within left ventrolateral prefrontal cortex (Brodmann Area 44, F=4.57, df=1, 29, p=0.041), left dorsomedial prefrontal cortex (Brodmann Area 8, F=4.22, df=1, 29, p=0.049) and the left temporal pole (Brodmann Area 38, F=8.43, df=1, 29, p=0.007).
Discussion
Using cortical matching methods in conjunction with tools for measuring gray matter thickness, we found significant thinning in bilateral prefrontal and left anterior cingulate cortices in euthymic bipolar subjects relative to healthy subjects. Within these regions, thinning was localized to specific subregions including bilateral orbital (Brodmann Area 11), left frontopolar (Brodmann Area 10), left dorsomedial (Brodmann Area 8), left ventrolateral prefrontal cortex (Brodmann Area 44), left anterior cingulate (Brodmann Area 24) and left pericingulate (Brodmann Area 32) cortices.
Only two studies, to our knowledge, have examined brain structure in recurrently ill adult subjects with bipolar disorder using cortical thickness methods in conjunction with MRI. Lyoo et al. (29) reported thinning of prefrontal cortical gray matter in 25 bipolar subjects relative to 21 healthy subjects in left Brodmann Areas 46, 24 and 32 and right Brodmann Area 10. And, in a region of interest-driven study, Fornito et al. (6) found thinning in left Brodmann Area 24 and right Brodmann Area 32 in 24 patients relative to 24 healthy subjects. In the current study, which used a larger sample of 34 patients and 31 healthy subjects, cortical pattern matching methods were used to allow a more precise mapping of thickness abnormalities in bipolar disorder (30, 31). These methods improve upon the traditional registration approaches by aligning corresponding anatomy across subjects using sulcal features, eliminating much of the confounding anatomical variance when pooling data across subjects, thereby making it easier to identify and localize subtle group differences in brain structure (19). Using this highly sensitive technique, we replicated and extended the above prior study findings.
The current study has several unique strengths. First, unlike a majority of previous studies which have either not specified (32), or included a number of patients who were receiving treatment with lithium at the time of scanning (4, 8, 10, 12, 29), all subjects in our patient sample were free from current treatment with this medication. This aspect may be particularly important given recent evidence showing that lithium medication is associated with significant increases in cortical gray matter. Moore et al. (33) observed total gray matter volume increased by 3%, on average, in bipolar subjects after 4 weeks of lithium treatment. Sassi et al. (16, 34) found larger total gray matter volume in lithium-treated bipolar subjects, compared to both untreated patients and healthy subjects. And Bearden et al. (14) found prefrontal cortical gray matter density was greater in bipolar subjects treated with lithium relative to both healthy subjects and bipolar subjects not treated with this medication. Our group has also found lithium-associated gray matter enlargement of subcortical structures in bipolar subjects (15). Use of lithium, therefore, may serve to explain why some prior structural neuroimaging studies of bipolar disorder have either failed to detect gray matter reductions in patients (11), or found group differences in the opposite direction (i.e., gray matter increases in bipolar versus healthy subjects (7, 12, 13)).
A second strength of the current study is that all bipolar subjects in our patient sample were in the same mood state (euthymia) at the time of scanning. Although prior studies have not controlled for this factor, recent data from our group (17) and others (8) suggest that, it, too may in fact impact MRI results. Brooks et al. (17) found, compared to euthymic bipolar subjects, that depressed bipolar subjects exhibited lower gray matter density in dorsal prefrontal cortices. Nery et al. (8) also found gray matter reductions in the orbitofrontal cortex of depressed relative to euthymic bipolar patients. A similar pattern of gray matter volume reductions has been more recently found by our group in patients scanned longitudinally (in different mood states) as well (J.O. Brooks et al., unpublished 2010 data).
A third strength of our study is that all subjects in the current patient sample were diagnosed with bipolar I (not II) disorder. Whether bipolar subtype (I or II) is associated with distinct cortical abnormalities is not known, but could add to the heterogeneity in structural neuroimaging findings. Only one study, to our knowledge, has specifically examined the impact of subtype on brain structure. In this study, unmedicated patients with bipolar type I disorder were found to exhibit smaller volumes of the left amygdala compared to unmedicated patients with bipolar type II disorder (35). This finding, as well as data from studies which show bipolar type I disorder to be associated with greater neuropsychological impairment (36), a higher risk for psychosis, and more severe manias than bipolar type II disorder, suggests that bipolar subtype could be associated with distinct patterns of thinning in cortical gray matter. Studies that directly compare cortical gray matter in patients with bipolar type I versus bipolar type II disorder are needed, however, to more thoroughly examine this issue.
With these efforts to study a more homogenous bipolar population and to control for some known confounds, we found reduced thickness in the prefrontal and anterior cingulate cortices of patients with bipolar disorder. The etiology of this thinning remains to be further understood. One possibility is that reduced thickness in the prefrontal and anterior cingulate cortex of patients is the result of an underlying neurodegenerative process associated with possible toxic effects of mood episodes. In line with this, and consistent with prior studies (28, 29, 37), we found significant widespread negative associations between cortical thickness and prior course of illness. Although it is tempting to speculate that decreased thickness in patients is causally associated with greater illness duration and a higher number of prior depressive episodes, because these variables were highly correlated with age, we, like prior studies (28, 29) could not disentangle these effects. Future studies that sample from bipolar patient groups that have a very narrow age range but a wide range in the number of prior depressive episodes or other course of illness measures are needed to tease apart these factors.
Another possibility is that reduced cortical thickness is present early in the course of the disorder, possibly prior to illness onset, and that such thinning might alter normal inhibitory cortico-limbic networks, resulting in an increased vulnerability to emotion dysregulation. Data to support this comes from studies finding gray matter abnormalities in the prefrontal cortex of unaffected relatives of individuals with bipolar and unipolar depressive disorder (38, 39). Whether these individuals with cortical thinning go on to develop the disorder is unclear, however, and longitudinal studies that more thoroughly explore the relation between cortical thinning and illness onset would be of interest.
Thinning of the prefrontal and anterior cingulate cortices could contribute to some of the behavioral changes that are observed in bipolar disorder. Lesion studies show focal damage to the orbitofrontal cortex leads to a diminished ability for individuals to properly gauge the positive or negative emotional consequences to their actions (40), and damage to anterior cingulate cortex results in symptoms which include inattention and emotional instability (41, 42). At least one functional neuroimaging study, to our knowledge, has reported activation in both the orbitofrontal and anterior cingulate cortex in healthy subjects during the conscious regulation of negative emotional states (43). This same study found activation in the orbitofrontal cortex was negatively correlated with that of the amygdala, suggesting an inhibitory connection between these regions. Other studies involving emotion regulatory paradigms, however, have found frontal activation (and corresponding negative correlations with amygdala activation) to be localized to the lateral portion of prefrontal cortex (e.g. Brodmann Area 47) (44–46). Although thinning in this ventrolateral region was not observed in patients here, it is well established that robust structural connections run between the lateral (e.g. Brodmann Area 47) and medial (e.g. Brodmann Area 11) sectors of the orbitofrontal cortex, but that only the medial subdivision sends direct inhibitory projections to the amygdala (47, 48). The lateral sector of orbitofrontal cortex, therefore, may suppress amygdala output via intermediary projections from the medial orbitofrontal cortex. Given this, it is interesting that our group has observed increased activation of the amygdala and decreased activation of the lateral orbitofrontal cortex (44, 49, 50), but thinning in the medial orbitofrontal cortex (shown here). The current study data could, therefore, provide a structural etiology for the functional abnormalities previously observed by our group. Additional studies examining the relation between brain structure and function in emotion regulatory circuits are currently underway in our laboratory.
With the exception of thinning in orbitofrontal cortex, which was bilateral, most of the thinning observed in patients of the present study was localized to the left hemisphere. This hemispheric pattern agrees with prior studies; of the four that have reported abnormal structure of the anterior cingulate (i.e., Brodmann Area 24/32), three (10, 29, 51) found deficits in the left hemisphere only, one (6) found deficits in bilateral anterior cingulate, and no studies found deficits that were restricted to the right hemisphere. The reason for this laterality is not known, although the concept of hemispheric lateralization of mood regulation is well-documented. Current models of emotional processing suggest that positive (or approach-related) emotions are lateralized toward the left hemisphere, whereas negative (or withdrawal-related) emotions are lateralized toward the right hemisphere (52). Lesions to the left prefrontal cortex, for example, have been associated with an increased risk for depressive symptoms (53).
In addition to the negative associations observed here between cortical thickness and illness duration and prior number of depressive episodes, there are two findings that require further investigation. First, thickness in left subgenual prefrontal cortex was positively associated with the number of prior of hospitalizations for mania, a finding that remained significant when age was controlled for in our statistical model. It is possible, given recent evidence suggesting that mood state may affect brain structure (8, 17), that the manic state itself, particularly when severe enough to require hospitalization, may have enduring hypertrophic effects on gray matter. Future studies, however, are needed to address this possibility. Second, a history of psychosis in patients was associated with significantly greater thinning in left ventrolateral prefrontal cortex (Brodmann Area 44), left dorsomedial prefrontal cortex (Brodmann Area 8) and left temporal pole (Brodmann Area 38). More pronounced thinning in these regions may suggest that psychotic and non-psychotic forms of bipolar disorder could be characterized by distinct patterns of gray matter abnormalities. This pattern of deficit is congruent with neurocognitive studies that show bipolar patients with a history of psychosis to be impaired on some prefrontal functions such as executive functioning and spatial working memory compared with bipolar patients without such a history (54). Moreover, studies of patients with chronic schizophrenia (55, 56) and psychosis (57, 58) consistently show reductions in gray matter of the left dorsomedial region of prefrontal cortex (Brodmann Area 8). Cortical gray matter loss in this region, therefore, may be associated with psychosis in particular. Unlike patients with schizophrenia however, cortical gray matter in dorsolateral prefrontal cortex (e.g. Brodmann Area 46) was relatively spared in patients of the current study. Thus, although distinct and identifiable patterns of neuroanatomic pathology could potentially distinguish these two disorders, future studies are needed to more accurately address this possibility.
Our study has several limitations. First, many of our patients were taking other medications, of which the long- and short-term effects on brain structure are not known. Our comparisons of cortical thickness between medicated and unmedicated patients, however, showed no evidence for a significant effect of this factor. Second, some patients had reported taking lithium in the years prior to scanning, and prior exposure to this medication could have affected our results. As lithium increases gray matter volume (33) however, it would be expected that any enduring hypertrophic effects of prior treatment with this medication would have produced group differences opposite to those observed here. Additionally, comparisons between patients who had and had not previously taken this medication indicate that prior lithium use itself was not a significant confounder.
In conclusion, using sensitive cortical pattern matching methods, in conjunction with tools developed by our group to measure cortical gray matter thickness, we found significant gray matter thinning in the prefrontal cortex and anterior cingulate cortex of a bipolar patient sample that was carefully recruited to control for the potential confounding effects of lithium status, mood state and diagnosis subtype. Thinning within these areas of the brain was localized to bilateral orbital (Brodmann Area 11), left frontopolar (Brodmann Area 10), left ventrolateral (Brodmann Area 44), left dorsomedial (Brodmann Area 8) and left anterior cingulate cortex cortices (Brodmann Area 24 and Brodmann Area 32), brain areas which are critical for the modulation of emotion, motivation, and attention. Studies that examine possible associations between cortical thinning and behavior, and the impact of structural alterations on neural circuit function are currently underway by our laboratory.
Acknowledgments
The authors gratefully acknowledge Katherine L. Narr, Ph.D., for methodological consultations, and the National Institute of Mental Health (NIMH; MH078556 to LCFR, and MH075944 and MH01848 to LLA) and the National Association for Research on Schizophrenia and Affective Disorders (NARSAD (LLA)). Additional support for algorithm development was provided by the National Institute on Aging (NIA), the National Institute of Biomedical Imaging and Bioengineering (NIBIB), and the National Center for Research Resources (NCRR; AG016570, EB01651, RR019771 to PT). For their generous support, the authors also thank the Brain Mapping Medical Research Organization, Brain Mapping Support Foundation, Pierson-Lovelace Foundation, The Ahmanson Foundation, William M. and Linda R. Dietel Philanthropic Fund at the Northern Piedmont Community Foundation, Tamkin Foundation, Jennifer Jones-Simon Foundation, Capital Group Companies Charitable Foundation, Robson Family and Northstar Fund. The project was also supported by Grant Numbers RR12169, RR13642 and RR00865 from the NCRR. The contents of this article are solely the responsibility of the authors and do not necessarily represent the official views of NCRR or NIH. Requests for data sharing will be considered by the corresponding author.
Footnotes
Location of work and address for reprints: From the UCLA Department of Psychiatry and Biobehavioral Sciences; the Laboratory of Neuro Imaging (LONI), the Department of Psychiatry, VA Greater Los Angeles Healthcare System, West Los Angeles Healthcare Center, Los Angeles; and the Ahmanson-Lovelace Brain Mapping Center, UCLA School of Medicine, Los Angeles.
Previous presentation: Presented in part at the 39th annual meeting of the Society for Neuroscience, Chicago, Illinois, 2009.
Financial Disclosures: The authors have no competing financial interests.
References
- 1.Angst J. The emerging epidemiology of hypomania and bipolar ii disorder. J Affect Disord. 1998;50:143–151. doi: 10.1016/s0165-0327(98)00142-6. [DOI] [PubMed] [Google Scholar]
- 2.Hirayasu Y, Shenton M, Salisbury D, Kwon J, Wible C, Fischer I, Yurgelun-Todd D, Zarate C, Kikinis R, Jolesz F, McCarley R. Subgenual cingulate cortex volume in first episode psychosis. Am J Psychiatry. 1999;156:1091–1093. doi: 10.1176/ajp.156.7.1091. [DOI] [PMC free article] [PubMed] [Google Scholar]
- 3.Drevets W, Price J, Simpson J, Todd R, Reich T, Vannier M, Raichle M. Subgenual prefrontal cortex abnormalities in mood disorders. Nature. 1997;386:824–827. doi: 10.1038/386824a0. [DOI] [PubMed] [Google Scholar]
- 4.Lopez-Larson M, DelBello M, Zimmerman M, Schwiers M, Strakowski S. Regional prefrontal gray and white matter abnormalities in bipolar disorder. Biol Psychiatry. 2002;52:93–100. doi: 10.1016/s0006-3223(02)01350-1. [DOI] [PubMed] [Google Scholar]
- 5.Frangou S. The maudsley bipolar disorder project. Epilepsia. 2005;46:19–25. doi: 10.1111/j.1528-1167.2005.463005.x. [DOI] [PubMed] [Google Scholar]
- 6.Fornito A, Malhi GS, Lagopoulos J, Ivanovski B, Wood SJ, Saling MM, Pantelis C, Yücel M. Anatomical abnormalities of the anterior cingulate and paracingulate cortex in patients with bipolar I disorder. Psychiatry Res. 2008;162:123–132. doi: 10.1016/j.pscychresns.2007.06.004. [DOI] [PubMed] [Google Scholar]
- 7.Javadapour A, Malhi GS, Ivanovski B, Chen X, Wen W, Sachdev P. Increased anterior cingulate cortex volume in bipolar I disorder. Aust N Z J Psychiatry. 2007;41:910–916. doi: 10.1080/00048670701634978. [DOI] [PubMed] [Google Scholar]
- 8.Nery FG, Chen HH, Hatch JP, Nicoletti MA, Brambilla P, Sassi RB, Mallinger AG, Keshavan MS, Soares JC. Orbitofrontal cortex gray matter volumes in bipolar disorder patients: a region-of-interest MRI study. Bipolar Disord. 2009;11:145–153. doi: 10.1111/j.1399-5618.2009.00662.x. [DOI] [PubMed] [Google Scholar]
- 9.Frangou S, Hadjulis M, Chitnis X, Baxter D, Donaldson S, Raymont V. The Maudsley bipolar disorder project: Brain structural changes in bipolar 1 disorder. Bipolar Disord. 2002;4:123–124. [Google Scholar]
- 10.Lyoo IK, Kim MJ, Stoll AL, Demopulos CM, Parow AM, Dager SR, Friedman SD, Dunner DL, Renshaw PF. Frontal lobe gray matter density decreases in bipolar I disorder. Biol Psychiatry. 2004;55:648–651. doi: 10.1016/j.biopsych.2003.10.017. [DOI] [PubMed] [Google Scholar]
- 11.Scherk H, Kemmer C, Usher J, Reith W, Falkai P, Gruber O. No change to grey and white matter volumes in bipolar I disorder patients. Eur Arch Psychiatry Clin Neurosci. 2008;258:345–349. doi: 10.1007/s00406-007-0801-8. [DOI] [PMC free article] [PubMed] [Google Scholar]
- 12.Chen X, Wen W, Malhi GS, Ivanovski B, Sachdev PS. Regional gray matter changes in bipolar disorder: a voxel-based morphometric study. Aust N Z J Psychiatry. 2007;41:327–336. doi: 10.1080/00048670701213229. [DOI] [PubMed] [Google Scholar]
- 13.Adler CM, Levine AD, DelBello MP, Strakowski SM. Changes in gray matter volume in patients with bipolar disorder. Biol Psychiatry. 2005;58:151–157. doi: 10.1016/j.biopsych.2005.03.022. [DOI] [PubMed] [Google Scholar]
- 14.Bearden CE, Thompson PM, Dalwani M, Hayashi KM, Lee AD, Nicoletti M, Trakhtenbroit M, Glahn DC, Brambilla P, Sassi RB, Mallinger AG, Frank E, Kupfer DJ, Soares JC. Greater cortical gray matter density in lithium-treated patients with bipolar disorder. Biol Psychiatry. 2007;62:7–16. doi: 10.1016/j.biopsych.2006.10.027. [DOI] [PMC free article] [PubMed] [Google Scholar]
- 15.Foland LC, Altshuler LL, Sugar CA, Lee AD, Leow AD, Townsend J, Narr KL, Asuncion DM, Toga AW, Thompson PM. Increased volume of the amygdala and hippocampus in bipolar patients treated with lithium. Neuroreport. 2008;19:221–224. doi: 10.1097/WNR.0b013e3282f48108. [DOI] [PMC free article] [PubMed] [Google Scholar]
- 16.Sassi RB, Nicoletti M, Brambilla P, Mallinger AG, Frank E, Kupfer DJ, Keshavan MS, Soares JC. Increased gray matter volume in lithium-treated bipolar disorder patients. Neurosci Lett. 2002;329:243–245. doi: 10.1016/s0304-3940(02)00615-8. [DOI] [PubMed] [Google Scholar]
- 17.Brooks JO, Bonner JC, Rosen AC, Wang PW, Hoblyn JC, Hill SJ, Ketter TA. Dorsolateral and dorsomedial prefrontal gray matter density changes associated with bipolar depression. Psychiatry Res. 2009;172:200–204. doi: 10.1016/j.pscychresns.2008.06.007. [DOI] [PMC free article] [PubMed] [Google Scholar]
- 18.Thompson P, Woods R, Mega M, Toga A. Mathematical/ computational challenges in creating deformable and probabilistic atlases of the human brain. Human Brain Mapping. 2000;9:81–92. doi: 10.1002/(SICI)1097-0193(200002)9:2<81::AID-HBM3>3.0.CO;2-8. [DOI] [PMC free article] [PubMed] [Google Scholar]
- 19.Thompson PM, Hayashi KM, Sowell ER, Gogtay N, Giedd JN, Rapoport JL, de Zubicaray GI, Janke AL, Rose SE, Semple J, Doddrell DM, Wang Y, van Erp TG, Cannon TD, Toga AW. Mapping cortical change in Alzheimer’s disease, brain development, and schizophrenia. Neuroimage. 2004;23:S2–18. doi: 10.1016/j.neuroimage.2004.07.071. [DOI] [PubMed] [Google Scholar]
- 20.Young RC, Biggs JT, Ziegler VE, Meyer DA. A rating scale for mania: reliability, validity and sensitivity. Br J Psychiatry. 1978;133:429–435. doi: 10.1192/bjp.133.5.429. [DOI] [PubMed] [Google Scholar]
- 21.Hamilton M. A rating scale for depression. J Neurol Neurosurg Psychiatry. 1960;23:56–62. doi: 10.1136/jnnp.23.1.56. [DOI] [PMC free article] [PubMed] [Google Scholar]
- 22.Shattuck D, Leahy R. BrainSuite: an automated cortical surface identification tool. Med Image Anal. 2002;6:129–42. doi: 10.1016/s1361-8415(02)00054-3. [DOI] [PubMed] [Google Scholar]
- 23.Zijdenbos A, Dawant B. Brain segmentation and white matter lesion detection in mr images. Crit Rev Biomed Eng. 1994;22:401–465. [PubMed] [Google Scholar]
- 24.Von Economo C. The cytoarchitectonics of the human cerebral cortex. London: Oxford Medical Publications; 1929. [Google Scholar]
- 25.Sowell ER, Thompson PM, Leonard CM, Welcome SE, Kan E, Toga AW. Longitudinal mapping of cortical thickness and brain growth in normal children. J Neurosci. 2004;24:8223–8231. doi: 10.1523/JNEUROSCI.1798-04.2004. [DOI] [PMC free article] [PubMed] [Google Scholar]
- 26.MacDonald D. A method for identifying geometrically simple surfaces from three dimensional images. McGill University; 1998. [Google Scholar]
- 27.Rasser P, Johnston P, Lagopoulos J, Ward P, Schall U, Thienel R, Bender S, Toga A, Thompson P. A deformable brodmann area atlas. In: Leahy R, editor. Proc IEEE International Symposium on Biomedical Imaging. 2004. pp. 400–403. [Google Scholar]
- 28.Frey BN, Zunta-Soares GB, Caetano SC, Nicoletti MA, Hatch JP, Brambilla P, Mallinger AG, Soares JC. Illness duration and total brain gray matter in bipolar disorder: evidence for neurodegeneration? European Neuropsychopharmacology. 2008;18:717–722. doi: 10.1016/j.euroneuro.2008.04.015. [DOI] [PubMed] [Google Scholar]
- 29.Lyoo IK, Sung YH, Dager SR, Friedman SD, Lee JY, Kim SJ, Kim N, Dunner DL, Renshaw PF. Regional cerebral cortical thinning in bipolar disorder. Bipolar Disorders. 2006;8:65–74. doi: 10.1111/j.1399-5618.2006.00284.x. [DOI] [PubMed] [Google Scholar]
- 30.Aganj I, Sapiro G, Parikshak N, Madsen SK, Thompson PM. Measurement of cortical thickness from MRI by minimum line integrals on soft-classified tissue. Hum Brain Mapp. 2009;30:3188–3199. doi: 10.1002/hbm.20740. [DOI] [PMC free article] [PubMed] [Google Scholar]
- 31.Protas HD, Huang SC, Kepe V, Hayashi K, Klunder A, Braskie MN, Ercoli L, Bookheimer S, Thompson PM, Small GW, Barrio JR. FDDNP binding using MR derived cortical surface maps. Neuroimage. 2009;49:240–248. doi: 10.1016/j.neuroimage.2009.08.035. [DOI] [PMC free article] [PubMed] [Google Scholar]
- 32.Strakowski SM, DelBello MP, Sax KW, Zimmerman ME, Shear PK, Hawkins JM, Larson ER. Brain magnetic resonance imaging of structural abnormalities in bipolar disorder. Arch Gen Psychiatry. 1999;56:254–260. doi: 10.1001/archpsyc.56.3.254. [DOI] [PubMed] [Google Scholar]
- 33.Moore GJ, Bebchuk JM, Wilds IB, Chen G, Manji HK. Lithium-induced increase in human brain grey matter. Lancet. 2000;356:1241–1242. doi: 10.1016/s0140-6736(00)02793-8. [DOI] [PubMed] [Google Scholar]
- 34.Sassi RB, Brambilla P, Hatch JP, Nicoletti MA, Mallinger AG, Frank E, Kupfer DJ, Keshavan MS, Soares JC. Reduced left anterior cingulate volumes in untreated bipolar patients. Biol Psychiatry. 2004;56:467–475. doi: 10.1016/j.biopsych.2004.07.005. [DOI] [PubMed] [Google Scholar]
- 35.Savitz J, Nugent AC, Bogers W, Liu A, Sills R, Luckenbaugh DA, Bain EE, Price JL, Zarate C, Manji HK, Cannon DM, Marrett S, Charney DS, Drevets WC. Amygdala volume in depressed patients with bipolar disorder assessed using high resolution 3T MRI: The impact of medication. Neuroimage. 2010;49:2966–2976. doi: 10.1016/j.neuroimage.2009.11.025. [DOI] [PMC free article] [PubMed] [Google Scholar]
- 36.Torrent C, Martínez-Arán A, Daban C, Sánchez-Moreno J, Comes M, Goikolea JM, Salamero M, Vieta E. Cognitive impairment in bipolar II disorder. Br J Psychiatry. 2006;189:254–259. doi: 10.1192/bjp.bp.105.017269. [DOI] [PubMed] [Google Scholar]
- 37.Ekman CJ, Lind J, Rydén E, Ingvar M, Landén M. Manic episodes are associated with grey matter volume reduction - a voxel-based morphometry brain analysis. Acta Psychiatr Scand. doi: 10.1111/j.1600-0447.2010.01586.x. in press. [DOI] [PubMed] [Google Scholar]
- 38.McDonald C, Bullmore ET, Sham PC, Chitnis X, Wickham H, Bramon E, Murray RM. Association of genetic risks for schizophrenia and bipolar disorder with specific and generic brain structural endophenotypes. Arch Gen Psychiatry. 2004;61:974–984. doi: 10.1001/archpsyc.61.10.974. [DOI] [PubMed] [Google Scholar]
- 39.Peterson BS, Warner V, Bansal R, Zhu H, Hao X, Liu J, Durkin K, Adams PB, Wickramaratne P, Weissman MM. Cortical thinning in persons at increased familial risk for major depression. Proc Natl Acad Sci U S A. 2009;106:6273–6278. doi: 10.1073/pnas.0805311106. [DOI] [PMC free article] [PubMed] [Google Scholar]
- 40.Bechara A, Damasio AR, Damasio H, Anderson SW. Insensitivity to future consequences following damage to human prefrontal cortex. Cognition. 1994;50:7–15. doi: 10.1016/0010-0277(94)90018-3. [DOI] [PubMed] [Google Scholar]
- 41.Tow PM, Whitty CW. Personality changes after operation on the cingulate gyrus in man. J Neurol Neurosurg Psychiatry. 1953;16:186–193. doi: 10.1136/jnnp.16.3.186. [DOI] [PMC free article] [PubMed] [Google Scholar]
- 42.Corkin S, Twitchell TE, Sullivan EV. Safety and efficacy of cingulotomy for pain and psychiatric disorder. North Holland, New York: Elsevier; 1979. [Google Scholar]
- 43.Urry HL, van Reekum CM, Johnstone T, Kalin NH, Thurow ME, Schaefer HS, Jackson CA, Frye CJ, Greischar LL, Alexander AL, Davidson RJ. Amygdala and ventromedial prefrontal cortex are inversely coupled during regulation of negative affect and predict the diurnal pattern of cortisol secretion among older adults. J Neurosci. 2006;26:4415–4425. doi: 10.1523/JNEUROSCI.3215-05.2006. [DOI] [PMC free article] [PubMed] [Google Scholar]
- 44.Foland LC, Altshuler LL, Bookheimer SY, Eisenberger N, Townsend J, Thompson PM. Evidence for deficient modulation of amygdala response by prefrontal cortex in bipolar mania. Psychiatry Res. 2008;162:27–37. doi: 10.1016/j.pscychresns.2007.04.007. [DOI] [PMC free article] [PubMed] [Google Scholar]
- 45.Hariri AR, Bookheimer SY, Mazziotta JC. Modulating emotional responses: effects of a neocortical network on the limbic system. Neuroreport. 2000;11:43–48. doi: 10.1097/00001756-200001170-00009. [DOI] [PubMed] [Google Scholar]
- 46.Lieberman MD, Eisenberger NI, Crockett MJ, Tom SM, Pfeifer JH, Way BM. Putting feelings into words: affect labeling disrupts amygdala activity in response to affective stimuli. Psychological Science. 2007;18:421–428. doi: 10.1111/j.1467-9280.2007.01916.x. [DOI] [PubMed] [Google Scholar]
- 47.Quirk GJ, Likhtik E, Pelletier JG, Paré D. Stimulation of medial prefrontal cortex decreases the responsiveness of central amygdala output neurons. J Neurosci. 2003:23. doi: 10.1523/JNEUROSCI.23-25-08800.2003. [DOI] [PMC free article] [PubMed] [Google Scholar]
- 48.Amaral D, Price J, Pitakanen A, Carmichael S. Anatomical organization of the primate amygdaloid complex. New York: Wiley-Liss; 1992. [Google Scholar]
- 49.Altshuler L, Bookheimer S, Proenza MA, Townsend J, Sabb F, Firestine A, Bartzokis G, Mintz J, Mazziotta J, Cohen MS. Increased amygdala activation during mania: a functional magnetic resonance imaging study. Am J Psychiatry. 2005;162:1211–1213. doi: 10.1176/appi.ajp.162.6.1211. [DOI] [PubMed] [Google Scholar]
- 50.Altshuler LL, Bookheimer SY, Townsend J, Proenza MA, Eisenberger N, Sabb F, Mintz J, Cohen MS. Blunted activation in orbitofrontal cortex during mania: a functional magnetic resonance imaging study. Biol Psychiatry. 2005;58:763–769. doi: 10.1016/j.biopsych.2005.09.012. [DOI] [PubMed] [Google Scholar]
- 51.Fornito A, Yücel M, Wood SJ, Bechdolf A, Carter S, Adamson C, Velakoulis D, Saling MM, McGorry PD, Pantelis C. Anterior cingulate cortex abnormalities associated with a first psychotic episode in bipolar disorder. Br J Psychiatry. 2009;194:426–433. doi: 10.1192/bjp.bp.107.049205. [DOI] [PubMed] [Google Scholar]
- 52.Rotenberg VS. The peculiarity of the right-hemisphere function in depression: solving the paradoxes. Prog Neuropsychopharmacol Biol Psychiatry. 2004;28:1–13. doi: 10.1016/S0278-5846(03)00163-5. [DOI] [PubMed] [Google Scholar]
- 53.MacFall JR, Payne ME, Provenzale JE, Krishnan KR. Medial orbital frontal lesions in late-onset depression. Biol Psychiatry. 2001;49:803–806. doi: 10.1016/s0006-3223(00)01113-6. [DOI] [PubMed] [Google Scholar]
- 54.Glahn DC, Bearden CE, Barguil M, Barrett J, Reichenberg A, Bowden CL, Soares JC, Velligan DI. The neurocognitive signature of psychotic bipolar disorder. Biol Psychiatry. 2007;62:910–916. doi: 10.1016/j.biopsych.2007.02.001. [DOI] [PubMed] [Google Scholar]
- 55.Ananth H, Popescu I, Critchley HD, Good CD, Frackowiak RS, Dolan RJ. Cortical and subcortical gray matter abnormalities in schizophrenia determined through structural magnetic resonance imaging with optimized volumetric voxel-based morphometry. Am J Psychiatry. 2002;159:1497–1505. doi: 10.1176/appi.ajp.159.9.1497. [DOI] [PubMed] [Google Scholar]
- 56.Hulshoff Pol HE, Schnack HG, Mandl RC, van Haren NE, Koning H, Collins DL, Evans AC, Kahn RS. Focal gray matter density changes in schizophrenia. Arch Gen Psychiatry. 2001;58:1118–1125. doi: 10.1001/archpsyc.58.12.1118. [DOI] [PubMed] [Google Scholar]
- 57.Farrow TF, Whitford TJ, Williams LM, Gomes L, Harris AW. Diagnosis-related regional gray matter loss over two years in first episode schizophrenia and bipolar disorder. Biol Psychiatry. 2005;58:713–723. doi: 10.1016/j.biopsych.2005.04.033. [DOI] [PubMed] [Google Scholar]
- 58.Job DE, Whalley HC, McConnell S, Glabus M, Johnstone EC, Lawrie SM. Structural gray matter differences between first-episode schizophrenics and normal controls using voxel-based morphometry. Neuroimage. 2002;17:880–889. [PubMed] [Google Scholar]