

Abstract
Lobules 10 and 9 in the caudal posterior vermis [also known as nodulus and uvula (NU)] are thought important for spatial orientation and balance. Here, we characterize complex spike (CS) and simple spike (SS) activity in response to three-dimensional vestibular stimulation. The strongest modulation was seen during translation (CS: 12.8 ± 1.5, SS: 287.0 ± 23.2 spikes/s/G, 0.5 Hz). Preferred directions tended to cluster along the cardinal axes (lateral, fore-aft, vertical) for CSs and along the semicircular canal axes for SSs. Most notably, the preferred directions for CS/SS pairs arising from the same Purkinje cells were rarely aligned. During 0.5 Hz pitch/roll tilt, only about a third of CSs had significant modulation. Thus, most CSs correlated best with inertial rather than net linear acceleration. By comparison, all SSs were selective for translation and ignored changes in spatial orientation relative to gravity. Like SSs, tilt modulation of CSs increased at lower frequencies. CSs and SSs had similar response dynamics, responding to linear velocity during translation and angular position during tilt. The most salient finding is that CSs did not always modulate out-of-phase with SSs. The CS/SS phase difference varied broadly among Purkinje cells, yet for each cell it was precisely matched for the otolith-driven and canal-driven components of the response. These findings illustrate a spatiotemporal mismatch between CS/SS pairs and provide the first comprehensive description of the macaque NU, an important step toward understanding how CSs and SSs interact during complex movements and spatial disorientation.
Introduction
The vestibulo-cerebellum (flocculus, ventral paraflocculus, nodulus, and uvula) is phylogenetically old and thus potentially important in providing insights into its highly conserved, exquisite circuitry (Eccles et al., 1966; Eccles, 1967; Fox et al., 1967). Historically, much attention has focused on the role of the flocculus and ventral paraflocculus in motor learning (for review, see du Lac et al., 1995; Raymond et al., 1996; Blazquez et al., 2004; Boyden et al., 2004), whereas the functions of lobules 10 (nodulus) and 9 (uvula) of the caudal vermis, areas thought to be involved in spatial orientation, are less well characterized.
Vestibular mossy fibers to the primate nodulus/uvula (NU) arise from primary afferents ipsilaterally (Newlands et al., 2003), and all but the lateral vestibular nucleus (VN) and the nucleus prepositus hypoglossi bilaterally (Rubertone and Haines, 1981; Brodal and Brodal, 1983, 1985; Carleton and Carpenter, 1983; Belknap and McCrea, 1988). Climbing fibers originate mostly from the contralateral inferior olive, primarily the caudal subgroups c (also known as β-nucleus) and d of the medial accessory olive and dorsomedial cell column (Brodal and Kawamura, 1980; Brodal and Brodal, 1981, 1982; Whitworth et al., 1983). Efferents from the primate NU project back to the ipsilateral vestibular and fastigial nuclei (Dow, 1938; Haines, 1977; Carleton and Carpenter, 1983).
Until very recently, the best stimulus for simple spike (SS) and complex spike (CS) responses of NU Purkinje cells was thought to be low-frequency tilt, based on studies in anesthetized rabbits (Barmack and Shojaku, 1995; Fushiki and Barmack, 1997), mice (Yakhnitsa and Barmack, 2006), and cats (Marini et al., 1976). Using for the first time three-dimensional (3D) translation and rotation stimuli at multiple frequencies, Yakusheva et al. (2007, 2008) have recently shown that the strongest and most likely functionally relevant SS modulation is observed during translation. At mid/high frequencies, SSs selectively respond to 3D translation and ignore changes in spatial orientation relative to gravity. Thus, their activity reflects a solution to the otolith afferent ambiguity (Angelaki et al., 1999, 2004; Merfeld et al., 1999), which was shown to arise through convergence of spatially and temporally matched signals from otoliths and semicircular canals, such that they cancel each other out during tilt (Yakusheva et al., 2007). At low frequencies (less than ∼0.1 Hz), the convergent canal/otolith signals are no longer temporally matched and thus SSs cease to be selective for translation and respond to tilt as well (Yakusheva et al., 2008).
Here, we characterize CS activity in response to 3D vestibular stimulation. Special care was taken to simultaneously record both CS and SS activity for a direct comparison of their response properties. We show that CS and SS responses share many similarities, including a strong modulation during 3D translation and low-frequency tilt. However, they also show important differences, including distinct but remarkably consistent spatial and temporal misalignment. Preliminary aspects of this work have appeared in abstract form (Yakusheva et al., 2009).
Materials and Methods
Animals and experimental setup
Three Maccaca mulatta and one Maccaca fascicularis monkeys were chronically implanted with a circular molded, lightweight Delrin ring that was anchored to the skull by titanium inverted T bolts, as well as with scleral search coils to measure eye movements. A Delrin platform with arrays of holes spaced 0.8 mm apart was attached inside the Delrin ring using stereotaxic coordinates. This recording platform provided access to lobules 9 and 10 of the cerebellum bilaterally. In two animals, the recording platform was implanted at a double angle, i.e., it was slanted 10° mediolaterally and 10° anteroposteriorally relative to the horizontal plane; this was done to provide better access to the medial parts of the NU close to the midline. The holes in the Delrin platform allowed insertion of microelectrodes into the brain via transdural guide tubes. All surgical and experimental procedures were approved by the Animal Care and Use Committee at Washington University (St. Louis, MO).
Experimental setup and recording procedures were identical to those used for the characterization of SS responses (Yakusheva et al., 2007, 2008). During experiments, animals were seated upright in a primate chair that was secured inside one of two motion systems. One of the systems consists of a three-axis rotator mounted on top of a 2 m linear sled and allows rotations around three axes (pitch, roll, and yaw) and translation along any direction in the horizontal plane (Acutronic). The second system, which was used only for the characterization of the cells during 3D translation (lateral, fore-aft, and vertical), consists of a six-degrees-of-freedom motion platform (series 6DOF2000E, Moog). The animals and the primate chair were positioned such that all three rotational axes (yaw, pitch, and roll) crossed the center of the head and the horizontal stereotaxic plane was aligned with the earth-horizontal plane.
Neural recording and experimental protocol
Epoxy-coated tungsten microeletrodes (4–6 MΩ impedance; FHC) were inserted into 26 gauge guide tubes and advanced into the cerebellar nodulus-uvula using a hydraulic microdrive. Raw signals from the electrodes were amplified, filtered (0–10 kHz with notch filter at 60 Hz), digitized at 35 kHz (model 1401, Cambridge Electronics Design), and stored on disk for off-line spike sorting (using Spike2 software, Cambridge Electronics Design). The remaining analog signals (linear acceleration, angular velocity, eye coil output) were filtered (200 Hz; 6 pole Bessel filter) and digitized at a rate of 833.33 Hz (model 1401, 16 bit resolution, Cambridge Electronics Design).
The nodulus and uvula were localized based on stereotaxic coordinates and anatomical location with respect to the abducens, vestibular, and fastigial nuclei. CSs and SSs were identified based on their characteristic waveforms (Fig. 1A). SSs had action potentials that lasted 1–2 ms and spontaneous firing rates of ∼20–60 spikes/s. In contrast, CSs had action potentials lasting 4–6 ms and spontaneous firing rates of 1–5 spikes/s. These values are similar to those reported previously (Barmack and Shojaku, 1995; Yakhnitsa and Barmack, 2006).
Figure 1.
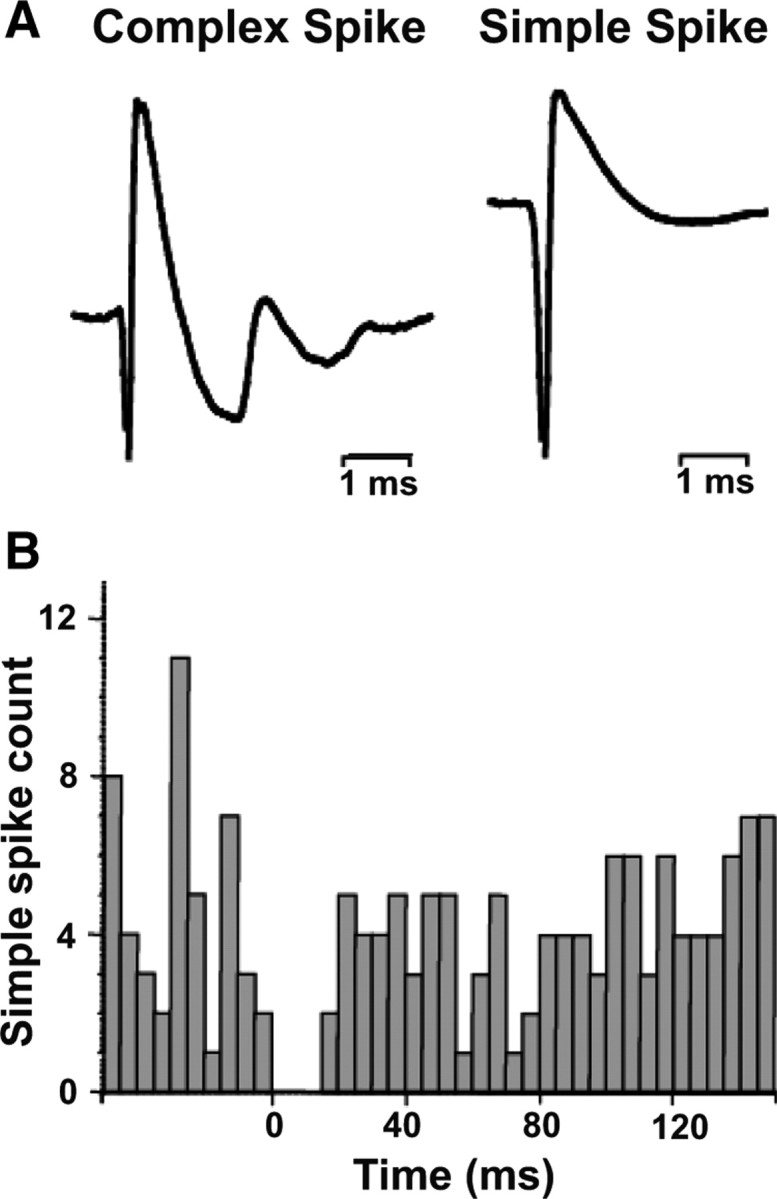
Identification of complex spikes and simple spikes. A, Typical waveform of a CS (left) and SS (right). CSs have multipeaked action potentials lasting ∼4–6 ms, while SSs show a single-peaked and short-lasting action potential. B, CS-triggered histogram of SSs illustrates that SSs pause for ∼15 ms following CSs (the record accumulates spikes over 45 trials, each trial corresponding to one CS).
SSs and CSs recorded simultaneously were sorted off-line using principal component analysis, which clusters spikes by amplitude, duration, and waveform (Spike2 software, Cambridge Electronics Design). Whenever both simple and complex spikes were isolated, CS-triggered SS histograms were used off-line to confirm pause (15–25 ms) in SS activity after occurrence of a CS (Fig. 1B). For all SS/CS comparisons we used only the pairs that could be reliably identified as belonging to the same Purkinje cell based on such CS-triggered SS histograms. In the remainder of the article, we use the word “CS/SS pairs” to identify those CS/SS recordings where the two types of spikes were shown to arise from the same Purkinje cell.
While the electrode was lowered into the cerebellum, a search stimulus consisting of combinations of 0.5 Hz translations and rotations about the cardinal axes (lateral and fore-aft for translation; yaw, pitch, and roll for rotation) was used. For initial experiments with the Acutronic sled system, we recorded from a cell only when there was an audible SS modulation during either lateral/fore-aft translation or yaw/pitch/roll rotation. However, in later experiments (which include all experiments characterizing 3D motion sensitivity on the motion platform), we recorded from each well isolated complex spike, regardless of whether a simultaneously recorded simple spike was modulated or not. Thus, data collected with the 3D translation protocol represents a relatively unbiased sampling of CS modulation in the nodulus/uvula.
The experimental protocol used here for the characterization of CS responses is identical to that used by Yakusheva et al. (2007, 2008) to characterize SS responses, with only one exception. To ensure adequate CS characterization, each protocol was delivered for a minimum of 200 s (typically 300 s). The protocols discussed in the following paragraphs were delivered in total darkness once a CS was isolated.
Protocol 1.
All Purkinje cells were first tested with 0.5 Hz (±20 cm; 0.2 G) sinusoidal translation along the lateral and fore-aft directions. Some Purkinje cells were also tested during translation at different frequencies: 0.16 Hz (95.6 cm; 0.1 G) and 1 Hz (2.16 cm; 0.2 G). Translational motion activates exclusively otolith afferents.
Protocol 2.
When good cell isolation was maintained after completion of the translation protocol, Purkinje cells were then tested during roll and/or pitch tilt, first at 0.5 Hz (±11.3°) and later (if isolation was maintained) at other frequencies: 1 Hz (±5°), 0.25 Hz (±22.6°), 0.1 Hz (±30°), 0.05 Hz (±30°), and 0.02 Hz (±30°). These stimuli change the animal's position relative to gravity and thus activate both otolith and vertical semicircular canal afferents.
Protocol 3.
A few Purkinje cells were also tested during yaw rotation at 0.5 Hz (31.4°/s; ±10°). Yaw rotation from an upright orientation activates horizontal semicircular canal afferents.
Protocol 4.
Purkinje cells were also characterized during combinations of translation and tilt stimuli at 0.5 Hz (for details, see Angelaki et al., 1999, 2004; Shaikh et al., 2005; Meng et al., 2007; Yakusheva et al., 2007). These stimuli consisted of either pure translation (translation), pure tilt (tilt), or combined translation and tilt (tilt minus translation and tilt plus translation). The tilt stimulus was a 0.5 Hz sinusoidal pitch or roll rotation from upright with a peak amplitude of 11.3 ° (36°/s). Because this motion reorients the head relative to gravity, otolith afferents are stimulated by a 0.5 Hz linear acceleration component in the horizontal plane with a peak magnitude of ∼0.2 G (G = 9.81 m/s2). The amplitude of the translation stimulus was adjusted to match that induced by the head tilt (0.2 G, 20 cm). During combined tilt and translation stimulation, inertial and gravitational acceleration components combined either additively or subtractively, depending on the relative directions of the two stimuli. As a result, the net gravitoinertial acceleration activating the otolith receptors in the horizontal plane either doubled (tilt plus translation) or was nearly zero (tilt minus translation), even though the actual translation of the animal remained the same as that during translation-only motion. Importantly, whereas translation activates only otolith (but not canal) afferents, tilt minus translation activates only canal (not otolith) afferents. Thus, these two stimuli are particularly important in isolating the two vestibular afferent contributions to each response.
These stimuli allowed us to test whether CS responses correlated best with net linear acceleration (i.e., the sum of translational plus gravitational acceleration), like otolith afferents (Angelaki et al., 2004), or with translation, like SS responses (Yakusheva et al., 2007). Note that because during combined tilt minus translation stimuli net linear acceleration is zero, otolith afferents are not activated. Thus, tilt minus translation can be used to isolate and characterize the properties of the vertical semicircular canal contribution to Purkinje cell firing rates (Angelaki et al., 2004; Yakusheva et al., 2007, 2008). These protocols were delivered either during lateral motion and roll tilt and/or fore-aft motion and pitch tilt, whichever gave the largest response modulation. Note that the tilt plus translation protocol was delivered last, and thus responses were only available for a small number of cells.
Protocol 5.
Finally, a subpopulation of Purkinje cells was tested during 3D motion, using 0.5 Hz translation (±10 cm, 0.1 G) delivered along the three cardinal directions: lateral (left-right), fore-aft, and vertical (up-down). Note that we recorded from all well isolated SSs or CSs; thus, the percentage of translation-responding NU Purkinje cells could be determined.
Protocols 1–4 were delivered using the Acutronic three-axis rotator/sled. Protocol 5 was delivered in the Moog motion platform. Note that no attempt was made to systematically characterize spontaneous activity. This is because most (in not all) NU Purkinje cells are sensitive to static tilt, so really “spontaneous” activity is not easily defined.
Histology
For two of the animals (D and F) we pressure injected 0.2 μl of 2% horseradish peroxidase-wheat germ agglutinin or 0.3 μl of 10% biotinylated dextran amine into the deep cerebellar nuclei using a 1.0 μl Hamilton syringe. After a postinjection survival time of 48 h, the animals were killed under sodium pentobarbital (50 mg/kg, i.v.) and perfused through the heart with a buffered saline prewash followed by a solution containing 1.0% paraformaldehyde and 1.25% glutaraldehyde in 0.1 m phosphate buffer (PB), pH 7.2. The brain was blocked in the frontal plane and removed. It was cryoprotected in 30% sucrose PB before being frozen and sectioned at a thickness of 80 μm on a sliding microtome. For the recorded neurons of the animals with histology, each cell location was reconstructed according to the relationship between its recorded position (based on the predrilled recording grid hole and micromanipulator depth reading) and the location of the bilateral abducens and deep cerebellar nuclei (which also allowed estimation of distance from midline). For the remaining two animals, where histology is not yet available, we followed the same procedure to place the recorded cells into the sections drawn from animal F (Fig. 2).
Figure 2.
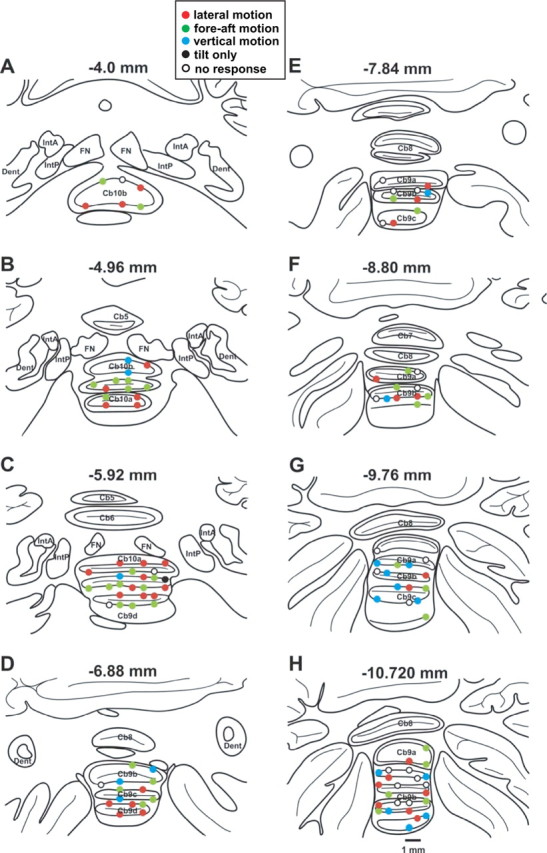
Histological reconstruction of Purkinje cells. A–H, Drawings of coronal sections (80 μm thickness, shown every 12 slices) through the cerebellar nodulus (lobule 10, Cb10) and uvula (lobule 9, Cb9) of animal F, laid out from rostral (A) to caudal (H). Reconstruction of recordings from all animals were plotted over the coronal sections of animal F. Filled circles: CSs showing significant vestibular modulation (n = 93); open circles: CSs without vestibular modulation (n = 22; note that because most neurons were only tested during translation in the horizontal plane, some of the “nonresponsive” cells might in reality be “vertically preferring neurons”). Data have been color coded according to the translation direction (lateral, fore-aft, or vertical) with the largest response modulation. Red fill: CSs with maximum modulation during lateral motion (n = 38); green fill: CSs with maximum modulation during fore-aft motion (n = 35); cyan fill: CSs with maximum modulation during vertical motion (n = 19, note that only a subpopulation of cells was tested during vertical translation). Finally, black-filled circles illustrate CSs with significant modulation only to tilt, not translation (n = 1). Numbers on top of each panel correspond to distance from the abducens nucleus. Anatomical structures and lobules were identified according to Madigan and Carpenter (1971) and Paxinos et al. (2000). FN, Fastigial nuclei; IntA, interpositus anterior; IntP, interpositus posterior, Dent, dentate.
Data analysis and statistics
CS activity was isolated off-line using spike sorting (Spike2 software, Cambridge Electronics Design). Subsequently, data were imported into Matlab (MathWorks) and analyzed similarly as done previously for SSs (Yakusheva et al., 2007, 2008). First, responses were binned (40 bins per cycle) and subjected to a permutation analysis to characterize the statistical significance of the response modulation (p < 0.01) (for details, see Yakusheva et al., 2008). Briefly, the 40 response bins were shuffled randomly, thus destroying the systematic modulation in the data but maintaining the inherent variability of the responses. A “Fourier ratio” (FR) was then defined as the ratio of the fundamental over the maximum of the first 20 harmonics as the randomization process was repeated 1000 times. If the FR for the original data exceeded that for 99% of the permuted datasets, the temporal modulation was considered to be statistically significant (p < 0.01).
Subsequently, neural activity was converted into instantaneous firing rate (IFR), computed as the inverse of interspike interval. We then stacked responses to repeated stimulus cycles into a single IFR cycle. Gain and phase were then calculated by fitting both neural response and stimulus with a sine function (first and second harmonics and DC offset) using a nonlinear least-squares algorithm (Levenberg–Marquardt methods). Modulation amplitude was then measured to be half the peak-to-trough sinusoidal fit. Neuronal gain for translation was computed as the ratio of response modulation amplitude over the stimulus (in units of spikes/s/G, where G = 9.81 m/s2); phase was expressed relative to linear acceleration. For rotation, gain and phase were expressed relative to angular velocity (e.g., gain is in units of spikes/s/degree/s). Note that because IFRs from multiple cycles were stacked, many data points appear on each of these single cycle IFRs despite low CS firing rates (e.g., Fig. 3A,B, right columns).
Figure 3.

A, B, Examples of CS and SS responses from three NU Purkinje cells during lateral (A) and fore-aft (B) translation. Data are shown either as raw spikes (left, bottom traces), isolated CSs (left, top traces), or instantaneous firing rate for SSs (left, middle traces). Right: Responses were analyzed by stacked instantaneous firing rates from multiple cycles and fitting with a sinusoidal function (gray lines). Peak modulation amplitudes for CSs were as follows: A, 3.3 spikes/s (cell 1), 0.19 spikes/s (cell 2), and 1.9 spikes/s (cell 3); B, 0.1 spikes/s (cell 1), 1.5 spikes/s (cell 2), and 2.2 spikes/s (cell 3). Note that multiple dots appear on these IFR plots despite low CS firing rates (see spikes for the unfolded data on the left). CSs modulate during lateral motion for cell 1, during fore-aft motion for cell 2, and during both motion directions for cell 3. SSs modulate significantly during both lateral and fore-aft translation in all three Purkinje cells. Hacc is linear acceleration stimulus.
The neuronal gain and phase during translation and tilt from two directions (i.e., lateral and/or fore-aft motion or pitch and roll tilt) were fitted with a two-dimensional (2D) spatiotemporal model (Angelaki, 1991, 1992), which computes the preferred direction in the horizontal plane together with the response gain and phase along that direction. For the subpopulation of cells tested with 3D translation, preferred direction was defined in spherical coordinates as follows. First, the preferred direction was computed in the horizontal plane (thus defining the azimuth of the 3D vector). Subsequently, the vertical gain and phase, along with the preferred direction in the horizontal plane, were used to calculated the elevation of the 3D preferred direction (for details, see Yakusheva et al., 2008; Liu and Angelaki, 2009).
We quantified whether a measured distribution was significantly different from a uniform distribution by performing a resampling analysis as follows: (1) we calculated the sum-squared error (across bins) between the measured distribution and an ideal uniform distribution containing the same number of observations; (2) we also calculated the sum-squared error between a random distribution that was created by drawing the same number of data points from a uniform distribution and the ideal uniform distribution; (3) this second step was repeated 1000 times to generate a distribution of sum-squared error values that represent random deviations from an ideal uniform distribution; (4) if the sum-squared error for the experimentally measured distribution lay outside the 95% confidence interval of values from the randomized distributions, then the measured distribution was considered to be significantly different from uniform (p < 0.05). For nonuniform distributions, a modality test was also performed to further test whether they are unimodal or bimodal (for details, see Takahashi et al., 2007). The test generated two p values, with the first one (puni) for the test of unimodality and the second one (pbi) for the test of bimodality.
Finally, to determine whether the CS of each Purkinje cell correlated best with translation or net linear acceleration, linear regression analysis was used to simultaneously fit the cumulative cycles of cell modulation during each of the translation, tilt, and combined stimuli with net acceleration- and translation-coding models (for details, see Angelaki et al., 2004; Green et al., 2005). Briefly, these models assume that neural firing rate modulation is due either to the net acceleration or to the translational acceleration component. How well each of these two models fitted the data was evaluated using a partial correlation analysis. To remove the influence of correlations between the predictions themselves, we calculated partial correlation coefficients, which were subsequently converted to z-scores using Fisher's r-to-z transform to facilitate the interpretation of statistical significance independently of the number of data points (for further details of this analysis, see Angelaki et al., 2004; Green et al., 2005; Yakusheva et al., 2007). The advantage of this comparison is that when z-scores for one model are plotted versus the respective z-scores for the other model, the plot can be easily separated into regions in which data points can be distinguished as being better correlated with one model as compared with the other at a particular level of significance. Only CS responses obtained for all four stimulus combinations (translation, tilt, tilt minus translation, and tilt plus translation) were used for this analysis.
Results
We recorded complex spike activity from 115 Purkinje cells in the cerebellar nodulus and uvula (lobules 10 and 9, respectively) of four monkeys (animal V: 63 cells; animal W: 28 cells; animal F: 10 cells; and animal D: 14 cells). Of these, both SSs and CSs were recorded from all but three cells for which only CSs (but not SSs) were isolated. Among these 112 simultaneously recorded CS/SSs, 81 pairs were confirmed to arise from the same Purkinje cell, by observing a pause of 10–20 ms in SS activity following each CS (Fig. 1B) (Granit and Phillips, 1956); only this group of cells for which CS-triggered silencing of the simultaneously recorded SS could be confirmed were used in CS/SS comparisons. Note that although the SS response properties of a smaller population of Purkinje cells have been presented by Yakusheva et al. (2007, 2008), basic findings are replotted in Figures 4, 5, and 12 whenever relevant for comparisons with CS responses.
Figure 4.
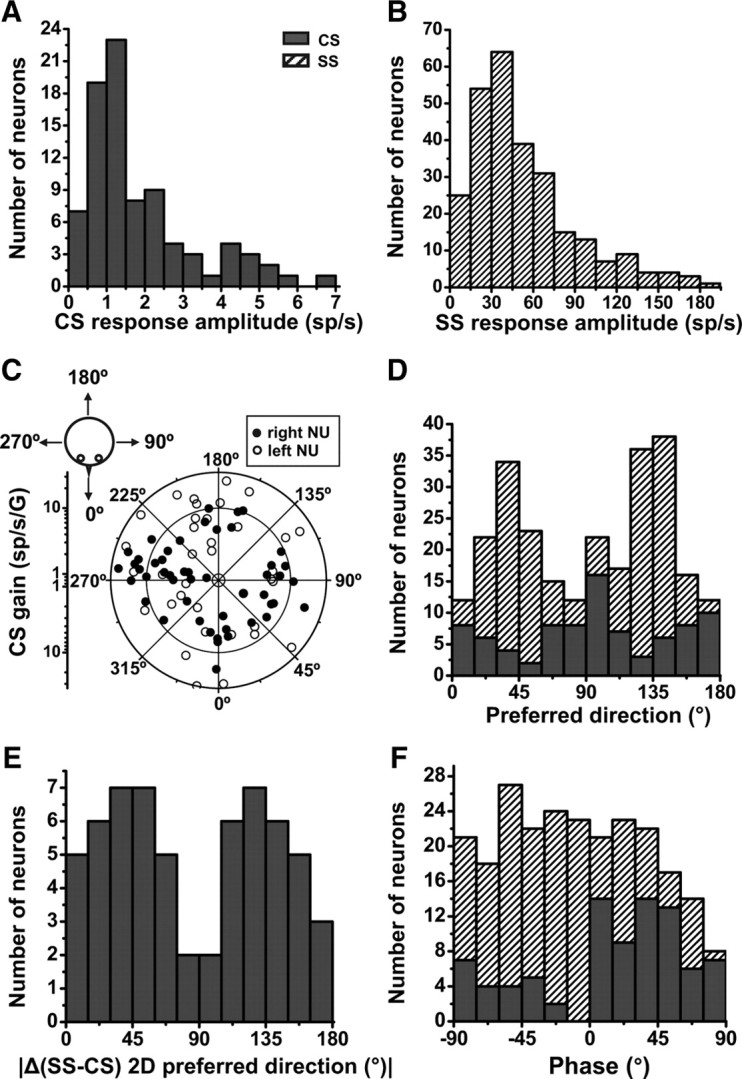
Spatial organization of CSs and SSs during translation (0.5 Hz) in the horizontal plane. A, B, Distributions of response amplitudes [from sinusoidal fit; units are spikes per second (sp/s)] along the maximum response direction for CSs (n = 85) and SSs (n = 269), respectively. C, Polar plot illustrating preferred direction gain (in units of spikes/s/G) and orientation (see drawing, upper left). Each data point corresponds to one Purkinje cell (CS) that shows significant modulation (p < 0.01) during at least one direction (lateral or fore-aft, n = 85). Note that translation responses are not lateralized in the NU; i.e., there is no obvious difference in the preferred direction distribution for cells recorded in the right (filled symbols) versus left (open symbols) NU. D, Stacked bar plot of the distributions of translation preferred directions for both CSs (n = 85, filled bars) and SSs (n = 269, hatched bars). E, Distribution of preferred direction difference between CSs and SSs, |Δ(CS-SS), 2D preferred direction| (computed only for the CS/SS pairs that were confirmed to arise from the same Purkinje cell; n = 61). F, Distribution of CS (filled bars) and SS (hatched bars) response phase during 0.5 Hz sinusoidal translation along the preferred direction (n = 85).
Figure 5.

CS and SS responses during 3D translation. A, Example of CS and SS responses (overlaid cycles with sinusoidal fit) of a NU Purkinje cell during lateral, fore-aft, and vertical motion (0.5 Hz). CS and SS modulation was larger for vertical than fore-aft and lateral motion. B, C, Preferred directions for CSs (n = 48) and SSs (n = 96) during 3D translation are shown both as scatter plots and as marginal distributions. Each circle in the scatter plot corresponds to the [azimuth, elevation] coordinates of the 3D preferred direction computed for each CS or SS showing significant modulation along at least one axis of translation (lateral, fore-aft, vertical). Data are plotted in spherical coordinates using the Lambert scale for elevation (Gu et al., 2006) and color-coded as follows: data with |elevation| >45° are shown in red (CS) or blue (SS); those with |elevation| <45° are shown black. Arrows in the scatter plot point to the CS and SS response from the Purkinje cell shown in A (note that the SS plot includes more cells than previously shown by Yakusheva et al., 2008, thus allowing for easier evaluation of the trends in the data).
Figure 12.

Distribution of z-scored partial correlation coefficients for fits of each response with translation-coding and net acceleration-like models. Dashed lines divide plots into two quadrants: an upper left quadrant corresponding to cell responses that were significantly (p < 0.01) better fitted by the translation-coding model, and a lower right quadrant corresponding to cells that were better fitted by the net acceleration model. The area in between the two quadrants indicates cells not significantly fitted by either model. CS responses correlate better with either translation-like or net acceleration models (black circles, n = 15), in contrast to SS responses (gray circles, n = 87; data replotted from Yakusheva et al., 2007). Arrows indicate example cells 1 and 2 from Figure 10.
Recording tracks were later confirmed histologically in animals F and D (Yakusheva et al. 2007, their supplemental Figs. 1, 2). Figure 2 plots all recorded CSs projected onto coronal sections through the cerebellar nodulus and uvula of animal F. Note that recordings extended into lobules 9 and 10, including the ventral (folia 9d and 9c) and dorsal (folia 9a and 9b) uvula (Fig. 2). The properties of CSs described here were characteristic of both nodulus and ventral/dorsal uvula, and we found little difference in vestibular responses within folia 9a, 9b, 9c, 9d, and 10 (see Discussion). There was no evidence of topography for either response type or translation preferred direction within the nodulus and uvula. We started by comparing the properties of CS and SS responses during translation, which is the stimulus we tested first upon isolation of a complex spike.
CS responses during translation: 2D spatial properties
Of 115 well isolated CSs tested during 0.5 Hz translation in the horizontal plane, 52 (45%) and 55 (48%) modulated significantly during lateral and/or fore-aft motion, respectively (Table 1). Examples of simultaneously recorded CS and SS responses during lateral and fore-aft translation are shown for three Purkinje cells in Figure 3, A and B. Responses from four cycles of 0.5 Hz translation are illustrated as raw CSs and SSs (left column, bottom traces), as well as separately as discriminated CSs (Fig. 3A,B, left columns, top traces marked “CS”) and instantaneous firing rate for SSs (Fig. 3A,B, left columns, middle traces marked “SS”).
Table 1.
Percentage of significant CS modulation encountered for each stimulus condition
| Experimental protocol | Lateral motion/Roll tilt rotation | Fore-aft motion/Pitch tilt rotation | Vertical motion |
|---|---|---|---|
| Translation | |||
| 0.5 Hz | 52/115 (45%) | 55/115 (48%) | 21/57 (37%) |
| Tilt rotation | |||
| 0.5 Hz | 13/39 (33%) | 17/50 (34%) | |
| 0.05 Hz | 10/23 (43%) | 14/23 (61%) | |
| Tilt-translation | |||
| 0.5 Hz | 12/36 (33%) | 17/40 (42%) |
Instantaneous firing rates from multiple cycles were overlaid and fitted with a sinusoidal function (Fig. 3A,B, right columns, top: CSs, bottom: SSs). Please note that because IFRs from multiple cycles were stacked, many data points appear on each of these single-cycle IFRs. As reported previously (Bauswein et al., 1983; Kano et al., 1991; Barmack and Shojaku, 1995; Yakhnitsa and Barmack, 2006), CSs had low spontaneous firing rates and were typically driven to modulation amplitudes of 0.23–6.7 spikes/s (mean ± SEM: 1.85 ± 0.15, n = 85) as illustrated in Figure 4A, which plots the distribution of CS response amplitudes along the maximum response direction from sinusoidal fits such as those shown in Figure 3 (gray lines). This range is comparable to the modulation previously reported during low-frequency tilt in anesthetized rabbits (Barmack, 2003). The modulation amplitude for SSs was larger (Fig. 4B), ranging from 10 to 183 spikes/s, with an average of 54.1 ± 2.4 (±SEM; n = 269).
In addition to response modulation amplitude, other differences between CSs and SSs can already be seen in these representative examples. SSs typically modulated during both lateral and fore-aft translation; in contrast, most CSs (63/115) responded only to translation along one of the two motion directions (e.g., cell 1: lateral motion; cell 2: fore-aft motion). Only a few (22/115) CSs had significant modulation during both lateral and fore-aft translation (e.g., cell 3). As shown later, these representative examples reflect an overall tendency of CS responses to prefer cardinal (i.e., lateral, fore-aft, or vertical) movement directions.
For 85 (74%) CSs that modulated significantly along either lateral or/and fore-aft translation at 0.5 Hz, the preferred direction in the horizontal plane was computed using a spatiotemporal model (Angelaki, 1991, 1992; Angelaki and Dickman, 2000) (see Materials and Methods). The resulting polar plot showing both maximum response gain and preferred direction is shown in Figure 4C. Here, each dot corresponds to a cell's CS response, with the distance to the origin illustrating response gain (in units of spikes/s/G), and its angular location illustrating the preferred direction (Fig. 4C, drawing, upper left). Translation response gains along the horizontal plane (2D) preferred direction averaged 9.8 ± 0.8 spikes/s/G (±SE).
The preferred directions of CSs were not lateralized, such that both leftward and rightward preferred directions were encountered in the right and left NU (Fig. 4C, filled vs open circles). There was, however, a tendency for CS preferred directions to cluster along the cardinal axes. This was quantified in Figure 4D (filled bars), which plots the histogram of preferred directions in the range [0°, 180°], where 0°/180° and 90° correspond to forward/backward and lateral motion directions, respectively. The distribution was not uniform (uniformity test, p = 0.016) and appeared to have peaks around the cardinal axes, 0°/180° and 90°, although the distribution was not significantly bimodal (modality test, puni = 0.09, pbi = 0.95). The distribution of the preferred directions for CSs contrasts that for SSs (Fig. 4D, hatched bars), which were clustered along oblique axes (45°/135°) (Yakusheva et al. 2008).
To further emphasize the difference in preferred translation direction for CSs and SSs, the histogram of the absolute direction difference between simultaneously recorded SSs and CSs (confirmed to be from the same Purkinje cell, as in Fig. 1B) is illustrated in Figure 4E. At the level of individual Purkinje cells, the preferred direction difference between CS and SS responses to translation tend to cluster around 45° and 135° (n = 61; due to the small sample size, the distribution was not different from uniform; p = 0.08). For both CSs and SSs, the distribution of translation response phase (expressed relative to linear acceleration) was broad (Fig. 4F) (Yakusheva et al., 2007, 2008). We will compare other properties of CSs and SSs (e.g., gain and phase) later in this section. First, we will quantify the relationship between CS and SS preferred directions during 3D translation.
CS responses during translation: 3D spatial properties
A subpopulation (57) of well isolated CSs was tested during 3D translation. CS and SS responses from an example Purkinje cell that preferred vertical over horizontal translation are shown in Figure 5A. Twenty-one (37%) CSs had significant modulation (p < 0.01, permutation test; see Materials and Methods) during vertical translation (Table 1), and 48 (84%) CSs showed significant modulation along at least one of the lateral, fore-aft, or vertical motion directions. Most (31/48, 65%) responding CSs modulated during translation along only one of the three cardinal directions. Importantly, only nine (16%) CSs were unresponsive to translation when tested in 3D.
From a total of 48 CS/SS pairs (verified to arise from the same Purkinje cell) (Fig. 1B), 38 (79%) CSs and 46 (96%) SSs modulated significantly for at least one translation direction. For 36 (75%) pairs, there was a significant modulation of both SSs and CSs, whereas only SS modulation was seen in 10 cells and only CS modulation was seen in 2 Purkinje cells. Thus, 0.5 Hz translation stimuli were very effective in eliciting both SS and CS modulation.
For cells with significant modulation along at least one stimulus direction, the 3D preferred direction gain, phase, and orientation were computed using a spatiotemporal model (Angelaki et al., 1992; Liu and Angelaki, 2009) (see Materials and Methods). Translation response gains along the 3D preferred direction (at 0.5 Hz and computed only for responsive cells) averaged 12.8 ± 1.5 (±SE) spikes/s/G (CS) and 287.0 ± 23.2 spikes/s/G (SS). The orientation of the 3D preferred direction was defined using spherical coordinates, i.e., each preferred direction was described by two angles, azimuth and elevation. These angles are illustrated in Figure 5B (CS) and 5C (SS), both as scatter plots (elevation vs azimuth) and as marginal distributions. Each data point in the plot corresponds to the preferred direction of one Purkinje cell, defined by a set of two angles, azimuth and elevation. For example, when [azimuth, elevation] = [0°,0°], the preferred direction points forward, [90°,0°] is leftward, whereas elevation angles of 90° and −90° illustrate upward and downward preferring directions.
For CS preferred directions, the distribution of elevation angles was not uniform (uniformity test, p = 0.003), with some Purkinje cells preferring vertical directions and others preferring horizontal directions (Fig. 5B). A similar but less dramatic organization also characterized the distribution of elevation angles for SSs (Fig. 5C) (uniformity test, p = 0.027). For illustrative purposes, cells with |elevation| >45° have been labeled red (CS) or blue (SS) to distinguish them from horizontally tuned cells (black dots) in subsequent figures.
For the 36 CS/SS pairs with significant 3D translation responses of both CSs and SSs, the absolute angular difference in 3D preferred directions (|Δ(CS-SS), 3D preferred direction|) has been compared with the corresponding preferred direction difference in 2D (i.e., the horizontal plane, |Δ(CS-SS), 2D preferred direction|) in the scatter plot of Figure 6A. For Purkinje cells whose SS and CS preferred directions both lie within 45° of the horizontal plane, data points fall along the unity-slope diagonal (Fig. 6A, black dots). This is not surprising, since for horizontally tuned cells, |Δ(CS-SS), 3D preferred direction| ≈ |Δ(CS-SS), 2D preferred direction|. As illustrated in Figure 6A (black bars), marginal distributions tended to cluster around 45° and 135° (see also Fig. 4E).
Figure 6.
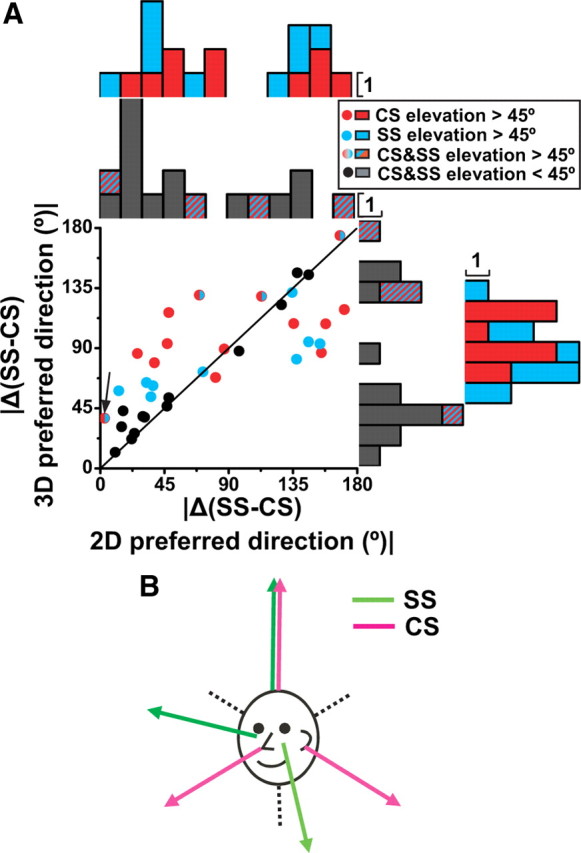
Preferred direction difference between CS and SS during translation. A, Relationship between the 3D and 2D (horizontal plane) CS-SS preferred direction difference, where the |Δ(CS-SS) 3D preferred direction| is plotted versus |Δ(CS-SS) 2D preferred direction|. Each data point corresponds to a NU Purkinje cell with significant translation responses for both CSs and SSs (n = 36), color coded according to whether either CS (red) or SS (blue) has 3D preferred direction with |elevation| >45° (as in Fig. 5B) (cells for which both CSs and SSs have |elevation| >45° are shown in mixed red/blue). Purkinje cells for which both CSs and SSs have |elevation| <45° are shown as black dots. Arrow marks the cell of Figure 5A. Histograms along the abscissa and ordinate show marginal distributions plotted separately for cells with either one |elevation| >45° (red and blue) and both |elevation| <45° (black) or both |elevation| >45° (mixed red/blue). B, Drawing summarizing the coordinate systems for CS (magenta) and SS (green) preferred directions.
However, when only one of the preferred directions has |elevation| >45° and the other has |elevation| <45° (i.e., when one preferred direction is near vertical but the other is near horizontal), the |Δ(CS-SS), 3D preferred direction| is ∼90° (Fig. 6A, right, red and blue marginal histograms), whereas the difference in the vectors' projection onto the horizontal plane, |Δ(CS-SS), 2D preferred direction|, remains clustered around 45° and 135° (Fig. 6A, top, red and blue marginal histograms). This occurs because the preferred directions for CSs and SSs appear to cluster along 3D orthogonal axes, of which the vertical axis is common, but the horizontal axes are rotated relative to each other by 45° (Fig. 6B).
Thus, in summary, CSs respond to 3D translation, as do SSs. However, CS preferred directions tend to be organized in the cardinal 3D coordinate system (i.e., vertical, lateral, fore-aft) (Fig. 6B, magenta arrows), whereas SS preferred directions use the semicircular canal coordinate system (i.e., vertical and oblique directions in the horizontal plane) (Fig. 6B, green arrows). Note also that preferred directions for CS and SS responses from a single Purkinje cell are rarely aligned in 3D. For approximately half of Purkinje cells (19/36), one (either CS or SS) prefers vertical translation and the other horizontal translation (Fig. 6A, red and blue symbols/bars). For another 13/36 cells, both CSs and SSs have preferred directions close to the horizontal plane, 45/135° apart from each other (Fig. 6A, black symbols/bars). Finally, only four Purkinje cells have |elevation| >45° for both SSs and CSs (Fig. 6A, mixed red/blue dots and bars). This spatial misalignment (by either 45° or 90°) of CS/SS pairs is striking (see Discussion).
CS responses during translation: dynamics
How CS modulation changes as a function of frequency is illustrated with an example cell in Figure 7A. Note that responses were characterized during either lateral or fore-aft motion, to whichever stimulus the cell responded best. For both CSs and SSs, modulation decreased as frequency was increased (Fig. 7A). CS gain and phase, plotted as a function of frequency, have been summarized for 13 Purkinje cells in Figure 7, B and C, respectively. CS gains decreased with increasing frequency (ANCOVA, F(2,35) = 12.4, p < 0.001), but phase was independent of frequency (ANCOVA, F(2,35) = 1.5, p = 0.18).
Figure 7.

CS response dynamics during translation. A, Examples of CS and SS responses during lateral translation at 0.16, 0.5, and 1 Hz. B, C, Neuronal gain (B) and phase (C) (expressed relative to linear acceleration) are plotted as a function of frequency for individual CS responses (n = 13). D, Normalized average gains are shown for both CSs (black solid line) and SSs (gray dashed line). Gains have been normalized by dividing each gain value by the cell's 0.5 Hz gain before the calculation of the average.
To directly compare the dynamics of CSs and SSs during translation, we first normalized gains to 1 at 0.5 Hz and then computed averages as a function of frequency (Fig. 7D). Gain versus frequency slopes were larger for CSs (−1.24, CI = [−1.68, −0.81]) than for SSs (−0.70, CI = [−0.98, −0.41]) (where CI is confidence interval), although the difference was not significant (overlapping 95% confidence intervals). These near-unity slopes in log-log frequency plots suggest a temporal integration (Ogata, 1970), i.e., responses appear to follow linear velocity rather than linear acceleration. Indeed, when we recalculated gains relative to linear velocity, CS gains were independent of frequency (ANCOVA, F(2,35) = 0.14, p = 0.86) and the slope was not significantly different from zero (−0.20, CI = [−0.68, 0.19]). By comparison, the velocity gains of SSs show a significant increase with frequency (ANCOVA, F(2,35) = 5.3, p = 0.009), with a slope of 0.56 (CI = [0.23, 0.78]) (Yakusheva et al., 2008). Thus, although similar, CS/SS response dynamics may not be identical because CSs follow linear velocity, whereas SSs respond to combinations of linear velocity and linear acceleration.
CS responses during pitch/roll rotation (tilt)
After the translation stimuli, and as long as isolation was maintained, Purkinje cells were also tested during pitch and/or roll tilt, first at 0.5 Hz, then at 0.05 Hz, and subsequently at additional frequencies (see Materials and Methods). Example SS/CS responses during pitch and roll tilt at 0.5 and 0.05 Hz are illustrated in Figure 8A. Note that preferred directions are again not aligned. This particular cell preferred roll with its CS response and pitch with its SS response. Also note that the modulation magnitude of both SSs and CSs increased at 0.05 Hz as compared with 0.5 Hz.
Figure 8.

CS response dynamics during tilt. A, Examples of CS and SS responses from the same Purkinje cells during pitch (top) and roll (bottom) at 0.5 (left) and 0.05 Hz (right). Data are shown as raw spikes, discriminated CSs, or instantaneous firing rate (see Fig. 3 legend). B and C, CS gain (B) and phase (C) (expressed relative to angular velocity) are plotted as a function of frequency (n = 19). D, Normalized gains are shown for both CSs (black solid line) and SSs (gray dashed line). Gains have been normalized by dividing each gain value by the cell's 0.5 Hz gain before the calculation of the average.
About a third of CSs modulated significantly during 0.5 Hz tilt, and this percentage nearly doubled at 0.05 Hz (Table 1); of 23 CSs tested with 0.05 Hz roll/pitch rotations, 17 (74%) modulated significantly for either pitch and/or roll. The increase in gain with decreasing frequency was a consistent finding for all Purkinje cells, as illustrated in Figure 8B, which summarize CS gain as a function of frequency. The dependence of gain on frequency was significant (ANCOVA, F(4,89) = 8.7, p < 0.001), whereas, as evident in Figure 8C, phase was independent of frequency (ANCOVA, F(4,89) = 0.4, p = 0.8).
Average CS and SS dynamics during tilt were similar (Fig. 8D), with slopes of −1.09 (CI = [−1.30, −0.87]) and −0.82 (CI = [−0.94, −0.70]) for CSs and SSs, respectively. For a given peak velocity, the monkey moved much more during 0.05 Hz tilt than during 0.5 Hz tilt. Thus, when expressed relative to tilt position, gains became independent of frequency (CS: ANCOVA, F(4,100) = 0.21, p = 0.88 and SS: F(4,132) = 0.45, p = 0.76; data not shown) (but see Yakusheva et al., 2008). Thus, both CS and SS responses follow head position during tilt.
CS preferred directions during 0.5 Hz, 0.05 Hz, and 0.02 Hz tilt (computed using the spatiotemporal model; see Materials and Methods) are shown as polar plots in Figure 9A and as histogram distributions in Figure 9, B (0.5 Hz) and C (0.05 and 0.02 Hz). Although the data sample of tilt-responding cells is too small for statistical comparisons, there is some trend for 0.5 Hz preferred directions to cluster around roll (90°/270°) and low frequency (0.05 and 0.02 Hz) preferred directions to cluster around pitch (0°/180°). Such potential change in tilt preferred direction needs to be scrutinized in future studies.
Figure 9.

Spatial properties of CS responses during tilt. A, Polar plot illustrating preferred direction gain (in units of spikes/s/degree/s) and orientation (see drawings). Each data point corresponds to one Purkinje cell (CS) that shows significant modulation (p < 0.01) during at least one direction (pitch or roll) at 0.5 Hz (black-filled circles), 0.05 Hz (gray-filled circles), and 0.02 Hz (open circles). B, C, Distribution of tilt preferred directions at 0.5 Hz (black filled bars in B, n = 22), as well as 0.05 Hz (gray bars in C, n = 17) and 0.02 Hz (hatched bars in C, n = 7).
CS responses during combinations of tilt and translation
Using combinations of 0.5 Hz tilt and translation stimuli, we have previously shown that SS responses correlate best with translation rather than with net linear acceleration (i.e., the sum of tilt-related gravitational and translational accelerations, which is the stimulus activating otolith afferents) (Yakusheva et al., 2007, 2008). To test whether CS responses also selectively correlate with translation and ignore changes in the orientation of the head relative to gravity during tilt, we recorded CS responses during tilt, translation, and combined tilt/translation at 0.5 Hz (tilt minus translation and tilt plus translation; see Materials and Methods) (Angelaki et al., 2004), as shown with the schematics of Figure 10 (top). Because peak tilt amplitude is such that the horizontal linear acceleration due to gravity is the same as that during translation, when both translation and tilt are presented together, the net horizontal acceleration is either zeroed (tilt minus translation) or doubled (0.4 G, tilt plus translation, see Materials and Methods).
Figure 10.

Examples of CS and SS responses from two NU Purkinje cells during translation, tilt, tilt minus translation, and tilt plus translation. For cell 1, both SS and CS responses correlate best with translation (same modulation during translation, tilt minus translation, and tilt plus translation and no response during tilt). For cell 2, CS responses correlate best with net linear acceleration, whereas SS responses are selective for translation. Bottom traces illustrate stimuli: Hvel, tilt angular velocity; Hacc, head translational acceleration; and Net acc, net linear (gravitoinertial) acceleration.
Representative examples of simultaneously recorded SS and CS responses are shown in Figure 10 for two Purkinje cells. Although net acceleration was the same during translation and tilt, both CS and SS responses of Purkinje cell 1 modulated more strongly during translation than during tilt (compare peak-to-trough sinusoidal modulation of firing rate). When translation and tilt were presented simultaneously, such that net horizontal linear acceleration was either zero (tilt minus translation) or double (tilt plus translation), CS/SS responses for cell 1 appeared similar to those during translation. Thus, cell 1, typical of all SS responses in the NU (Yakusheva et al., 2007), had both CS and SS responses following translation rather than net linear acceleration. Results differed for the CS responses of cell 2. Unlike the SS modulation, which was selective for translation, the CS responses of cell 2 followed net acceleration; i.e., responses were similar (although small) for translation and tilt, negligible during tilt minus translation and twice as big during tilt plus translation.
Results are summarized in Figure 11, where CS response amplitude and phase during tilt, tilt minus translation, and tilt plus translation have been plotted versus the respective responses during translation. If responses follow net acceleration, data should fall along the gray dashed lines. In contrast, if responses follow translation, data should fall along the solid black lines. Data are mixed, with a few CSs falling along the gray dashed lines (indicating net acceleration-like responses) and others along the solid black lines (indicating translation-coding responses). Importantly, most CS responses modulated during tilt minus translation, although primary otolith afferents do not respond to this stimulus (because the net horizontal plane linear acceleration is zero). Across the population, CS responses to both tilt and tilt minus translation were significantly smaller compared with those during translation [Wilcoxon rank test: p < 0.001 (Fig. 11A), p = 0.002 (Fig. 11B)] but similar during tilt plus translation and translation [Wilcoxon rank test, p = 0.53 (Fig. 11C)]. Similarly for the response phase, some data points fell along the predictions of net acceleration (gray dashed lines), but others fell along the predictions of translation coding (Fig. 11D–F, solid black lines).
Figure 11.

Summary of CS response amplitude and phase during tilt (n = 28) (A, D), tilt minus translation (n = 30) (B, E), and tilt plus translation (n = 15) (C, F) plotted versus the corresponding responses during translation. Solid black and gray dashed lines show predictions for translation-coding and net acceleration models, respectively. Black dotted line in E shows the unity-slope line. Note that no phase predictions are illustrated when amplitude predictions are zero (translation coding in D and net acceleration coding in E). Arrows indicate example cells 1 and 2 from Figure 10.
To quantify these observations, multiple linear regression analysis was used in n = 15 cells that were tested under all four stimulus conditions to compute partial correlation coefficients of how well each CS response to translation, tilt, tilt minus translation, and tilt plus translation could be predicted by net acceleration or translation-coding models, e.g., how well the modulation of the cells in Figure 10 could be described by the pattern of modulation of Hacc (head translational acceleration), illustrating the translation model, and Net Acc, illustrating the net acceleration model (for details, see Green et al., 2005; Yakusheva et al., 2007). To simplify plotting and visual interpretation, the variances of these partial correlation coefficients were normalized using Fisher's r-to-z transform (Angelaki et al., 2004). Figure 12 shows the resulting scatter plot, where dashed lines mark the 0.01 level of significance (which is a straight line because of the z-transform). Data points that fall above the top dashed line illustrate Purkinje cells whose responses fit better with the translation model, whereas data points below the lower dashed line illustrate responses that fit better with the net acceleration model (data points between the two dashed lines correspond to responses for which a best-fit model could not be distinguished at a significance level of p = 0.01.
In addition to CS data (black circles), Fig. 12 also plots SS data from Yakusheva et al. (2007) for comparison (gray circles). The majority (11/15, 2 cells in the nodulus, 6 cells in the ventral uvula, and 3 cells in the dorsal uvula) fall in the upper-left quadrant, illustrating that their firing rates were better correlated with translation; the remaining 4/15 CS responses (2 in the ventral uvula and 2 in the dorsal uvula) were better correlated with net acceleration (Fig. 12, lower-right quadrant). Thus, the distribution of CS responses is similar to that of SS responses in that most correlate best with translation than with net linear acceleration. Still, CS responses are distinct from SS responses in that about a quarter of them correlate best with net linear acceleration. In contrast, none of the SS responses we encountered correlated best with net linear acceleration. Importantly, even for those four CS responses that correlated best with net linear acceleration, responses were generally weak and modulation to tilt was not significant (permutation test, see Materials and Methods). Because the correlation analysis uses the responses to all four stimuli simultaneously, the highest correlation with net linear acceleration came about because of the following: (1) smaller responses during tilt minus translation than translation; and (2) larger responses during tilt plus translation than tilt and translation (as with the example cell 2 in Fig. 10).
CS responses during yaw rotation
Yaw responsiveness (0.5 Hz) was also tested in a subpopulation (n = 15) of cells, as illustrated with an example in Figure 13A. None of the SSs showed a significant modulation during yaw rotation (see also Yakusheva et al., 2007, 2008). In contrast to SSs, CS yaw modulation was significant in 4/15 (27%) Purkinje cells, as illustrated with the example of Figure 13A, and with the summary data of Figure 13B. One of those yaw-responding cells was located in the ventral uvula, whereas the remaining three cells with significant yaw responses were encountered in the dorsal uvula. The yaw-responding cell in the ventral uvula was one of the cells in Figure 12 correlating better with translation than with net linear acceleration. Among the yaw-responding cells in the dorsal uvula, one responded to neither tilt nor translation, another responded to translation but not tilt, and the third responded to tilt and vertical (but not horizontal plane) translation.
Figure 13.

CS responses during yaw rotation. A, Example of CS and SS responses from a Purkinje cell with significant CS modulation (0.5 Hz). Hvel, Head angular velocity. B, Distribution of CS gains during 0.5 Hz yaw rotation. Dark-filled bars indicate significant modulation (p < 0.01, n = 4). Hatched bars illustrate CS without significant modulation (n = 11). Note that none of the Purkinje cells had significant SS responses during yaw rotation (Yakusheva et al. 2008).
Gain and phase relationship between SSs and CSs during vestibular stimulation
We now return to the relationship between response properties of CS and SS, identified as simultaneously recorded pairs (as in Fig. 1). How response gains for simultaneously recorded CS/SS pairs relate to each other has been illustrated in Figure 14, A (translation) and B (tilt). This analysis only included CS/SS pairs for which data were collected for both lateral/fore-aft (translation) and roll/pitch (tilt) stimuli and were applied to the gain of the preferred direction (horizontal plane) of both CSs and SSs. This is important, because preferred directions for CS/SS responses did not match; thus, any attempt to correlate CS/SS translation or tilt modulation gain along a single axis could be misleading. There was a significant correlation between the CS/SS gain during tilt (Fig. 14B) (Spearman rank correlation, p < 0.001), but not during translation (Fig. 14A) (Spearman rank correlation. p = 0.63). Note, however, that these comparisons were based on 0.5 Hz data for translation and mainly lower frequency data for tilt. Thus, they could reflect either translation/tilt or high-/low-frequency differences; for example, it is possible that a better CS/SS gain correlation might also exist for low-frequency translation. At present, these data do not allow a firm conclusion.
Figure 14.

Relationship between CS/SS gain and phase. A, B, Response gain during translation and tilt (computed along the preferred direction in the horizontal plane). C, Relationship between the (SS-CS) phase difference during 0.5 Hz lateral and fore-aft translation, along with marginal distributions (lateral motion, n = 47; fore-aft motion, n = 49). D, Relationship between the (SS-CS) phase difference during roll and pitch tilt, along with marginal distributions. Black filled circles/bars, 0.5 Hz (n = 17); gray circles/bars, 0.05 Hz (n = 17); open circles/hatched bars, 0.02 Hz (n = 6). Note that only Purkinje cells with significant CS and SS responses during both motion directions have been included in the scatter plots (C, n = 14; D, n = 7).
Perhaps the most conspicuous observation is that the CS modulation during vestibular stimulation was not always out of phase with the SS modulation, a finding that contrasts with what was previously reported in rabbits (Fushiki and Barmack, 1997). This observation is readily seen in the raw waveforms and discriminated spikes in Figures 3, 5, 7, 8, and 10. On a cell-by-cell basis (note that this comparison was only done for identified SS/CS pairs) (Fig. 1), the (SS-CS) phase difference was similar for lateral/fore-aft translation (Fig. 14C) (Wilcoxon rank test, p = 0.51) or pitch/roll tilt (Fig. 14D) (Wilcoxon rank test, p = 0.027), but varied broadly from cell to cell. The (SS-CS) phase difference distributions were uniform (uniformity test, p > 0.05; marginal distributions) (Fig. 14C,D).
Remarkably, for individual Purkinje cells the (SS-CS) phase difference during translation was identical to that during tilt minus translation (Wilcoxon rank test, p = 0.16) (Fig. 15A) and tilt plus translation (Wilcoxon rank test, p = 0.9) (Fig. 15B), with slopes that were not significantly different from unity: 95% confidence interval, [0.7, 1.2] and [0.92, 1.62], p ≪ 0.001. There was also no difference with the (SS-CS) phase difference during translation and tilt (Wilcoxon rank test, p = 0.9).
Figure 15.

Summary of the (SS-CS) phase difference during tilt minus translation (A, n = 21) and tilt plus translation (B, n = 15) plotted versus the corresponding (SS-CS) phase difference during translation. The corresponding marginal distributions for tilt minus translation and tilt plus translation are also shown on the right. Data are shown for either lateral motion/roll tilt and/or fore-aft motion/pitch tilt, whichever direction produced largest responses.
Thus, in summary, CSs did not always modulate out of phase with SSs. Yet, although the phase difference between the modulation of CSs and SSs was broadly distributed across the population of Purkinje cells, that difference was matched on a cell-by-cell basis such that it was exactly the same for translation, tilt minus translation, tilt plus translation, and tilt. Such matching of the (SS-CS) phase difference is of particular relevance for translation versus tilt minus translation. Recall that translation activates otolith afferents only, and thus translation responses reflect the otolith-driven component of Purkinje cell responses. In addition, during the tilt minus translation stimulus otolith afferents do not respond at all (because the net horizontal plane linear acceleration is zero) (Angelaki et al., 2004); thus, tilt minus translation responses reflect the contribution of semicircular canal activation to Purkinje cell responses (Shaikh et al., 2005; Yakusheva et al., 2007). Thus, the findings of Figure 15 show that the (SS-CS) phase difference is precisely matched for the otolith-driven and canal-driven components of the Purkinje cell response (see Discussion).
Discussion
We have quantified the properties of the complex spike responses of NU Purkinje cells during 3D vestibular stimulation and have compared them with the properties of SS responses (Yakusheva et al., 2007, 2008). Our main findings are discussed below.
First, the strongest SS/CS modulation was seen during translation. CS preferred directions tended to cluster along the three cardinal (vertical, lateral, and fore-aft) axes, whereas SS preferred directions clustered along the semicircular canal axes (vertical and the two 45° oblique horizontal axes) (Fig. 6B) (Yakusheva et al., 2008). Most notably, the preferred directions for CS/SS pairs arising from the same Purkinje cells were rarely aligned.
Second, both CSs and SSs modulated little during 0.5 Hz pitch/roll tilt, but gains increased with decreasing frequency. However, unlike SS responses, none of which followed net linear acceleration at 0.5 Hz (Yakusheva et al, 2007, 2008), CS responses were mixed, most correlating best with translation (while ignoring changes in spatial orientation relative to gravity) and about a third correlating best with net linear acceleration.
Third, CSs and SSs had similar response dynamics. During tilt, both CSs and SSs responded to angular position. During translation, CSs followed linear velocity, whereas SSs encoded combinations of linear velocity and linear acceleration (Yakusheva et al., 2008).
Fourth, a small percent of CSs in the uvula were modulated during 0.5 yaw rotation. This finding contrasts with SSs, which never modulated during earth-vertical axis rotations (e.g., yaw from an upright orientation) (Yakusheva et al., 2007, 2008).
Fifth, CSs did not always modulate out of phase with SSs. Simple and complex spikes could respond to vestibular stimulation either in phase or out of phase and the distribution of CS/SS phase difference was broad and uniform. For each individual Purkinje cell, however, the CS/SS phase difference was precisely matched for the otolith-driven and canal-driven components of the response.
CS and SS modulation during vestibular stimulation
Clustering of preferred directions has been reported previously for visually driven CSs in the vestibulo-cerebellum. For example, optokinetic preferred directions for CS/SSs in the rabbit flocculus were clustered along the semicircular canal axes (i.e., along two oblique 45° directions in the horizontal plane and the vertical axis) (Graf et al., 1988). In birds, preferred directions of NU CS responses to translational optic flow were also organized along the semicircular canal axes (Wylie and Frost, 1999). To our knowledge, vestibular responses in the NU were previously tested only during static and dynamic tilt (Marini et al., 1976; Barmack and Shojaku, 1995; Fushiki and Barmack, 1997; Yakhnitsa and Barmack, 2006), thus providing an incomplete picture of their properties. All vestibularly responsive CSs were sensitive to static tilt in mice (Yakhnitsa and Barmack, 2006), but only about half were static tilt sensitive in rabbits (Fushiki and Barmack, 1997). Although we have not tested macaque Purkinje cells with static tilts, the increased gain at low frequencies (Fig. 8) suggests that most if not all SS/CSs are also sensitive to static tilt in macaques.
Unlike a tendency for clustering of NU CS/SS preferred directions during translation (Fig. 4), there was no clear clustering of tilt preferred directions in macaques (Fig. 9). Although additional data during low-frequency tilt would be needed to further verify this observation, a similar lack of tilt preferred direction clustering was also reported in mice and static tilt-sensitive rabbit Purkinje cells (Fushiki and Barmack, 1997; Yakhnitsa and Barmack, 2006). Another Purkinje cell type insensitive to static tilt with preferred directions clustering around semicircular canal axes during dynamic tilt, classified as “canal only” by Fushiki and Barmack (1997), has been found in neither mice (Yakhnitsa and Barmack, 2006) nor macaques (present study).
Neither we (Yakusheva et al, 2007, 2008) nor others (Barmack and Shojaku, 1995; Yakhnitsa and Barmack, 2006) observed SS modulation during yaw rotation despite strong horizontal canal afferent inputs to the NU (Kevetter and Perachio, 1986; Purcell and Perachio, 2001; Maklad and Fritzsch, 2003; Kevetter et al., 2004). In fact, ∼27% of mossy fibers in the rabbit NU responded to yaw rotation (Barmack and Shojaku, 1995). We (Green et al., 2005; Green and Angelaki, 2007; Yakusheva et al., 2007) have proposed that horizontal canal inputs are gated by a signal reflecting orientation relative to gravity. According to this framework, NU Purkinje cells would respond to yaw rotations that change orientation relative to gravity (e.g., yaw while laying on our side or back) (Green and Angelaki, 2004, 2007). In support of this hypothesis, rotations about pitch/roll axes activate SSs when they reflect tilt relative to gravity (i.e., delivered while upright) but are ineffective when they do not change orientation relative to gravity (i.e., in ear-down or prone/supine positions) (Yakusheva et al., 2007).
Unlike SSs, a few CSs, one in the ventral uvula and three in the dorsal uvula, modulated significantly during yaw from an upright orientation (Fig. 13). CS modulation during yaw was also reported in cats (Precht et al., 1976; Robinson et al., 1988), but not in rabbits and mice (Barmack and Shojaku, 1995; Yakhnitsa and Barmack, 2006).
Nodulus versus uvula: neuroanatomical versus physiological findings
We found few differences in the vestibular properties of CS/SSs based on their location within the nodulus, ventral uvula, and dorsal uvula. This might be surprising given the different behavioral effects observed with electrical stimulation (Heinen et al., 1992; Solomon and Cohen, 1994) or lesions (Angelaki and Hess, 1995; Heinen and Keller, 1996; Wearne et al., 1998), as well as the known differences in afferent and efferent projections. For example, vestibular primary afferents reach the nodulus and ventral (but not dorsal) uvula (Newlands et al., 2003). In addition, VN mossy fiber inputs become progressively fewer from nodulus to ventral uvula to dorsal uvula (Rubertone and Haines, 1981; Sato et al., 1989; Thunnissen et al., 1989). The dorsal uvula instead receives major mossy fiber inputs from the pontine nuclei (Sato et al., 1989; see also review by Voogd et al., 1996). However, such differences might not exist for CSs; the termination of vestibular-responding climbing fibers is organized into longitudinal zones extending throughout the nodulus and dorsal and ventral uvula (Whitworth et al., 1983; Kanda et al., 1989; Voogd et al., 1996).
Unlike mossy fiber projections from both vestibular afferents and VNs that terminate diffusely and not in sagittal zones, there is a strict topology and modular organization in the climbing fiber, cerebellar output, and nucleo-olivary projections (Akaogi et al., 1994; Voogd et al., 1996; Wearne et al., 1998; Wylie et al., 2003; for review, see Voogd et al., 1996). Such zonal organization has been observed physiologically in the preferred directions of canal and visual CS activity in the vestibulo-cerebellum (Fushiki and Barmack, 1997; Graf et al., 1988; Wylie and Frost, 1999). We did not observe such an organization based on the CS preferred directions to translation (Fig. 2). Thus, in agreement with the lack of any obvious sagittal plane organization of CS preferred directions during static tilt (Fushiki and Barmack, 1997; Yakhnitsa and Barmack, 2006), it is likely that otolith-driven climbing fiber inputs to the NU might not adhere to the zonal organization followed by canal-driven and visually driven signals.
CS and SS interactions
The most salient finding is that NU CSs/SSs are misaligned, both spatially and temporally. Spatially, because CS/SS translation preferred directions differ by 45° (horizontal plane) or 90° (in 3D). Temporally, because CSs do not always modulate out of phase with SSs. The CS/SS phase difference varied broadly among Purkinje cells, yet for each cell it was precisely matched for the otolith-driven and canal-driven components of the response (Fig. 15). We have shown previously that spatially and temporally matched otolith-driven and canal-driven SS response components represent a hallmark signature of their ability to compute translation. It is likely that the two findings are related, i.e., the precise spatiotemporal CS/SS mismatch across NU Purkinje cells (while maintaining a precise CS/SS matching for otolith/canal responses on a cell-by-cell basis) might be functionally linked to the reported precise canal/otolith spatiotemporal matching on a cell-by-cell basis while maintaining an across-Purkinje cell mismatch on preferred direction and phase (Green and Angelaki, 2004).
In-phase SS and CS modulation has also been recently described in the flocculus of awake rabbits during rotation in darkness (Simpson et al., 2002), a finding that contrasts the reciprocal relationship between SSs and CSs during visual stimulation (Graf et al., 1988; Stone and Lisberger, 1990; Kobayashi et al., 1998; Kitama et al., 1999). In the NU, Fushiki and Barmack (1997) reported out-of-phase CS/SS modulation during tilt in darkness. At present, the reasons for these differences remain unclear.
It is important to emphasize that even Purkinje cells with in-phase CS/SS modulation exhibited the characterizing SS pause following a CS (Fig. 1). These two properties operate in different time scales (tens of milliseconds versus several seconds for 0.1–1 Hz stimuli) and are not necessarily related, as suggested previously (Fushiki and Barmack, 1997). In addition, unlike Barmack and Shojaku (1995), we found either SS/CS relationship: SS modulation in the absence of CS modulation, or CS modulation in the absence of SS modulation. Yet, in agreement with Fushiki and Barmack (1997), we also found a significant correlation between CS/SS gain during low-frequency tilt (Fig. 14B). However, there was no CS/SS gain correlation for mid-/high-frequency translation (Fig. 14A).
Despite years of debate, there is little consensus about the role of SSs and CSs in cerebellar function (Lou and Bloedel, 1992; Welsh and Llinas, 1997; Gibson et al., 2004; Manzoni, 2005; Bengtsson and Hesslow, 2006; Jacobson et al., 2008; D'Angelo et al., 2009). The exquisitely elegant circuitry of the cerebellar cortex has been described often as ideal for precise spatial and temporal computations (Yarom and Cohen, 2002; Ohyama et al., 2003; Ito, 2006; Jacobson et al., 2008). In the macaque NU, we have started gaining some basic understanding of CS/SS responses under simple vestibular stimulation. Future studies examining how NU Purkinje cells change their activity under conditions of sensory conflict and spatial disorientation might provide fundamental insight into their function. Equally important is the understanding of how visual cues drive and/or modify SS/CS activity. Characterization of the role of the caudal vermis in these spatiotemporal multisensory computations might provide new functional insights into the role of the cerebellar cortex and its circuitry.
Footnotes
This work was supported by National Institutes of Health Grant R01 EY12814.
References
- Akaogi K, Sato Y, Ikarashi K, Kawasaki T. Mossy fiber projections from the brainstem to the nodulus in the cat: an experimental study comparing the nodulus, the uvula and the flocculus. Brain Res. 1994;638:12–20. doi: 10.1016/0006-8993(94)90627-0. [DOI] [PubMed] [Google Scholar]
- Angelaki DE. Dynamic polarization vector of spatially tuned neurons. IEEE Trans Biomed Eng. 1991;38:1053–1060. doi: 10.1109/10.99068. [DOI] [PubMed] [Google Scholar]
- Angelaki DE. Spatio-temporal convergence (STC) in otolith neurons. Biol Cybern. 1992;67:83–96. doi: 10.1007/BF00201805. [DOI] [PubMed] [Google Scholar]
- Angelaki DE, Dickman JD. Spatiotemporal processing of linear acceleration: primary afferent and central vestibular neuron responses. J Neurophysiol. 2000;84:2113–2132. doi: 10.1152/jn.2000.84.4.2113. [DOI] [PubMed] [Google Scholar]
- Angelaki DE, Hess BJ. Lesion of the nodulus and ventral uvula abolish steady state off-vertical axis otolith response. J Neurophysiol. 1995;73:1716–1720. doi: 10.1152/jn.1995.73.4.1716. [DOI] [PubMed] [Google Scholar]
- Angelaki DE, Bush GA, Perachio AA. A model for the characterization of the spatial properties in vestibular neurons. Biol Cybern. 1992;66:231–240. doi: 10.1007/BF00198476. [DOI] [PubMed] [Google Scholar]
- Angelaki DE, McHenry MQ, Dickman JD, Newlands SD, Hess BJ. Computation of inertial motion: neural strategies to resolve ambiguous otolith information. J Neurosci. 1999;19:316–327. doi: 10.1523/JNEUROSCI.19-01-00316.1999. [DOI] [PMC free article] [PubMed] [Google Scholar]
- Angelaki DE, Shaikh AG, Green AM, Dickman JD. Neurons compute internal models of the physical laws of motion. Nature. 2004;430:560–564. doi: 10.1038/nature02754. [DOI] [PubMed] [Google Scholar]
- Barmack NH. Central vestibular system: vestibular nuclei and posterior cerebellum. Brain Res Bull. 2003;60:511–541. doi: 10.1016/s0361-9230(03)00055-8. [DOI] [PubMed] [Google Scholar]
- Barmack NH, Shojaku H. Vestibular and visual climbing fiber signals evoked in the uvula-nodulus of the rabbit cerebellum by natural stimulation. J Neurophysiol. 1995;74:2573–2589. doi: 10.1152/jn.1995.74.6.2573. [DOI] [PubMed] [Google Scholar]
- Bauswein E, Kolb FP, Leimbeck B, Rubia FJ. Simple and complex spike activity of cerebellar Purkinje cells during active and passive movements in the awake monkey. J Physiol. 1983;339:379–394. doi: 10.1113/jphysiol.1983.sp014722. [DOI] [PMC free article] [PubMed] [Google Scholar]
- Belknap DB, McCrea RA. Anatomical connections of the prepositus and abducens nuclei in the squirrel monkey. J Comp Neurol. 1988;268:13–28. doi: 10.1002/cne.902680103. [DOI] [PubMed] [Google Scholar]
- Bengtsson F, Hesslow G. Cerebellar control of the inferior olive. Cerebellum. 2006;5:7–14. doi: 10.1080/14734220500462757. [DOI] [PubMed] [Google Scholar]
- Blazquez PM, Hirata Y, Highstein SM. The vestibulo-ocular reflex as a model system for motor learning: what is the role of the cerebellum? Cerebellum. 2004;3:188–192. doi: 10.1080/14734220410018120. [DOI] [PubMed] [Google Scholar]
- Boyden ES, Katoh A, Raymond JL. Cerebellum-dependent learning: the role of multiple plasticity mechanisms. Annu Rev Neurosci. 2004;27:581–609. doi: 10.1146/annurev.neuro.27.070203.144238. [DOI] [PubMed] [Google Scholar]
- Brodal A, Brodal P. Observations on the projection from the perihypoglossal nuclei onto the cerebellum in the macaque monkey. Arch Ital Biol. 1983;121:151–166. [PubMed] [Google Scholar]
- Brodal A, Brodal P. Observations on the secondary vestibulocerebellar projections in the macaque monkey. Exp Brain Res. 1985;58:62–74. doi: 10.1007/BF00238954. [DOI] [PubMed] [Google Scholar]
- Brodal A, Kawamura K. Olivocerebellar projection: a review. Adv Anat Embryol Cell Biol. 1980;64:1–140. [PubMed] [Google Scholar]
- Brodal P, Brodal A. The olivocerebellar projection in the monkey: experimental studies with the method of retrograde tracing of horseradish peroxidase. J Comp Neurol. 1981;201:375–393. doi: 10.1002/cne.902010306. [DOI] [PubMed] [Google Scholar]
- Brodal P, Brodal A. Further observations on the olivocerebellar projection in the monkey. Exp Brain Res. 1982;45:71–83. doi: 10.1007/BF00235764. [DOI] [PubMed] [Google Scholar]
- Carleton SC, Carpenter MB. Afferent and efferent connections of the medial, inferior and lateral vestibular nuclei in the cat and monkey. Brain Res. 1983;278:29–51. doi: 10.1016/0006-8993(83)90223-8. [DOI] [PubMed] [Google Scholar]
- D'Angelo E, Koekkoek SK, Lombardo P, Solinas S, Ros E, Garrido J, Schonewille M, De Zeeuw CI. Timing in the cerebellum: oscillations and resonance in the granular layer. Neuroscience. 2009;162:805–815. doi: 10.1016/j.neuroscience.2009.01.048. [DOI] [PubMed] [Google Scholar]
- Dow RS. The electrical activity of the cerebellum and its functional significance. J Physiol. 1938;94:67–86. doi: 10.1113/jphysiol.1938.sp003663. [DOI] [PMC free article] [PubMed] [Google Scholar]
- du Lac S, Raymond JL, Sejnowski TJ, Lisberger SG. Learning and memory in the vestibulo-ocular reflex. Annu Rev Neurosci. 1995;18:409–441. doi: 10.1146/annurev.ne.18.030195.002205. [DOI] [PubMed] [Google Scholar]
- Eccles JC. Circuits in the cerebellar control of movement. Proc Natl Acad Sci U S A. 1967;58:336–343. doi: 10.1073/pnas.58.1.336. [DOI] [PMC free article] [PubMed] [Google Scholar]
- Eccles JC, Llinas R, Sasaki K, Voorhoeve PE. Interaction experiments on the responses evoked in Purkinje cells by climbing fibres. J Physiol. 1966;182:297–315. doi: 10.1113/jphysiol.1966.sp007825. [DOI] [PMC free article] [PubMed] [Google Scholar]
- Fox SS, Liebeskind JC, O'Brien JH, Dingle RD. Mechanisms for limbic modification of cerebellar and cortical afferent information. Prog Brain Res. 1967;27:254–280. doi: 10.1016/S0079-6123(08)63104-0. [DOI] [PubMed] [Google Scholar]
- Fushiki H, Barmack NH. Topography and reciprocal activity of cerebellar Purkinje cells in the uvula-nodulus modulated by vestibular stimulation. J Neurophysiol. 1997;78:3083–3094. doi: 10.1152/jn.1997.78.6.3083. [DOI] [PubMed] [Google Scholar]
- Gibson AR, Horn KM, Pong M. Activation of climbing fibers. Cerebellum. 2004;3:212–221. doi: 10.1080/14734220410018995. [DOI] [PubMed] [Google Scholar]
- Graf W, Simpson JI, Leonard CS. Spatial organization of visual messages of the rabbit's cerebellar flocculus. II. Complex and simple spike responses of Purkinje cells. J Neurophysiol. 1988;60:2091–2121. doi: 10.1152/jn.1988.60.6.2091. [DOI] [PubMed] [Google Scholar]
- Granit R, Phillips CG. Excitatory and inhibitory processes acting upon individual Purkinje cells of the cerebellum in cats. J Physiol. 1956;133:520–547. doi: 10.1113/jphysiol.1956.sp005606. [DOI] [PMC free article] [PubMed] [Google Scholar]
- Green AM, Angelaki DE. An integrative neural network for detecting inertial motion and head orientation. J Neurophysiol. 2004;92:905–925. doi: 10.1152/jn.01234.2003. [DOI] [PubMed] [Google Scholar]
- Green AM, Angelaki DE. Coordinate transformations and sensory integration in the detection of spatial orientation and self-motion: from models to experiments. Prog Brain Res. 2007;165:155–180. doi: 10.1016/S0079-6123(06)65010-3. [DOI] [PubMed] [Google Scholar]
- Green AM, Shaikh AG, Angelaki DE. Sensory vestibular contributions to constructing internal models of self-motion. J Neural Eng. 2005;2:S164–S179. doi: 10.1088/1741-2560/2/3/S02. [DOI] [PubMed] [Google Scholar]
- Gu Y, Watkins PV, Angelaki DE, DeAngelis GC. Visual and nonvisual contributions to three-dimensional heading selectivity in the medial superior temporal area. J Neurosci. 2006;24:73–85. doi: 10.1523/JNEUROSCI.2356-05.2006. [DOI] [PMC free article] [PubMed] [Google Scholar]
- Haines DE. Cerebellar corticonuclear and corticovestibular fibers of the flocculonodular lobe in a prosimian primate (Galago senegalensis) J Comp Neurol. 1977;174:607–630. doi: 10.1002/cne.901740405. [DOI] [PubMed] [Google Scholar]
- Heinen SJ, Keller EL. The function of the cerebellar uvula in monkey during optokinetic and pursuit eye movements: single-unit responses and lesion effects. Exp Brain Res. 1996;110:1–14. doi: 10.1007/BF00241368. [DOI] [PubMed] [Google Scholar]
- Heinen SJ, Oh DK, Keller EL. Characteristics of nystagmus evoked by electrical stimulation of the uvular/nodular lobules of the cerebellum in monkey. J Vestib Res. 1992;2:235–245. [PubMed] [Google Scholar]
- Ito M. Cerebellar circuitry as a neuronal machine. Prog Neurobiol. 2006;78:272–303. doi: 10.1016/j.pneurobio.2006.02.006. [DOI] [PubMed] [Google Scholar]
- Jacobson GA, Rokni D, Yarom Y. A model of the olivo-cerebellar system as a temporal pattern generator. Trends Neurosci. 2008;31:617–625. doi: 10.1016/j.tins.2008.09.005. [DOI] [PubMed] [Google Scholar]
- Kanda K, Sato Y, Ikarashi K, Kawasaki T. Zonal organization of climbing fiber projections to the uvula in the cat. J Comp Neurol. 1989;279:138–148. doi: 10.1002/cne.902790112. [DOI] [PubMed] [Google Scholar]
- Kano M, Kano MS, Maekawa K. Optokinetic response of simple spikes of Purkinje cells in the cerebellar flocculus and nodulus of the pigmented rabbit. Exp Brain Res. 1991;87:484–496. doi: 10.1007/BF00227074. [DOI] [PubMed] [Google Scholar]
- Kevetter GA, Perachio AA. Distribution of vestibular afferents that innervate the sacculus and posterior canal in the gerbil. J Comp Neurol. 1986;254:410–424. doi: 10.1002/cne.902540312. [DOI] [PubMed] [Google Scholar]
- Kevetter GA, Leonard RB, Newlands SD, Perachio AA. Central distribution of vestibular afferents that innervate the anterior or lateral semicircular canal in the Mongolian gerbil. J Vestib Res. 2004;14:1–15. [PubMed] [Google Scholar]
- Kitama T, Omata T, Mizukoshi A, Ueno T, Sato Y. Motor dynamics encoding in cat cerebellar flocculus middle zone during optokinetic eye movements. J Neurophysiol. 1999;82:2235–2248. doi: 10.1152/jn.1999.82.5.2235. [DOI] [PubMed] [Google Scholar]
- Kobayashi Y, Kawano K, Takemura A, Inoue Y, Kitama T, Gomi H, Kawato M. Temporal firing patterns of Purkinje cells in the cerebellar ventral paraflocculus during ocular following responses in monkeys II. Complex spikes. J Neurophysiol. 1998;80:832–848. doi: 10.1152/jn.1998.80.2.832. [DOI] [PubMed] [Google Scholar]
- Liu S, Angelaki DE. Vestibular signals in macaque extrastriate visual cortex are functionally appropriate for heading perception. J Neurosci. 2009;29:8936–8945. doi: 10.1523/JNEUROSCI.1607-09.2009. [DOI] [PMC free article] [PubMed] [Google Scholar]
- Lou JS, Bloedel JR. Responses of sagittally aligned Purkinje cells during perturbed locomotion: relation of climbing fiber activation to simple spike modulation. J Neurophysiol. 1992;68:1820–1833. doi: 10.1152/jn.1992.68.5.1820. [DOI] [PubMed] [Google Scholar]
- Madigan JC, Carpenter MB. Baltimore: University Park; 1971. Cerebellum of the rhesus monkey: atlas of lobules, laminae, and folia, in sections. [Google Scholar]
- Maklad A, Fritzsch B. Partial segregation of posterior crista and saccular fibers to the nodulus and uvula of the cerebellum in mice, and its development. Brain Res Dev Brain Res. 2003;140:223–236. doi: 10.1016/s0165-3806(02)00609-0. [DOI] [PubMed] [Google Scholar]
- Manzoni D. The cerebellum may implement the appropriate coupling of sensory inputs and motor responses: evidence from vestibular physiology. Cerebellum. 2005;4:178–188. doi: 10.1080/14734220500193493. [DOI] [PubMed] [Google Scholar]
- Marini G, Provini L, Rosina A. Gravity responses of Purkinje cells in the nodulus. Exp Brain Res. 1976;24:311–323. doi: 10.1007/BF00235018. [DOI] [PubMed] [Google Scholar]
- Meng H, May PJ, Dickman JD, Angelaki DE. Vestibular signals in primate thalamus: properties and origins. J Neurosci. 2007;27:13590–13602. doi: 10.1523/JNEUROSCI.3931-07.2007. [DOI] [PMC free article] [PubMed] [Google Scholar]
- Merfeld DM, Zupan L, Peterka RJ. Humans use internal models to estimate gravity and linear acceleration. Nature. 1999;398:615–618. doi: 10.1038/19303. [DOI] [PubMed] [Google Scholar]
- Newlands SD, Vrabec JT, Purcell IM, Stewart CM, Zimmerman BE, Perachio AA. Central projections of the saccular and utricular nerves in macaques. J Comp Neurol. 2003;466:31–47. doi: 10.1002/cne.10876. [DOI] [PubMed] [Google Scholar]
- Ogata K. Modern control engineering. Englewood Cliffs, NJ: Prentice Hall; 1970. [Google Scholar]
- Ohyama T, Nores WL, Murphy M, Mauk MD. What the cerebellum computes. Trends Neurosci. 2003;26:222–227. doi: 10.1016/S0166-2236(03)00054-7. [DOI] [PubMed] [Google Scholar]
- Paxinos G, Huang X-F, Toga AW. The rhesus monkey brain in stereotaxic coordinates. New York: Academic; 2000. [Google Scholar]
- Precht W, Simpson JI, Llinas R. Responses of Purkinje cells in rabbit nodulus and uvula to natural vestibular and visual stimuli. Pflugers Arch. 1976;367:1–6. doi: 10.1007/BF00583649. [DOI] [PubMed] [Google Scholar]
- Purcell IM, Perachio AA. Peripheral patterns of terminal innervation of vestibular primary afferent neurons projecting to the vestibulo-cerebellum in the gerbil. J Comp Neurol. 2001;433:48–61. doi: 10.1002/cne.1124. [DOI] [PubMed] [Google Scholar]
- Raymond JL, Lisberger SG, Mauk MD. The cerebellum: a neuronal learning machine? Science. 1996;272:1126–1131. doi: 10.1126/science.272.5265.1126. [DOI] [PubMed] [Google Scholar]
- Robinson FR, Fraser MO, Hollerman JR, Tomko DL. Yaw direction neurons in the cat inferior olive. J Neurophysiol. 1988;60:1739–1752. doi: 10.1152/jn.1988.60.5.1739. [DOI] [PubMed] [Google Scholar]
- Rubertone JA, Haines DE. Secondary vestibulocerebellar projections to flocculonodular lobe in a prosimian primate, Galago senegalensis. J Comp Neurol. 1981;200:255–272. doi: 10.1002/cne.902000206. [DOI] [PubMed] [Google Scholar]
- Sato Y, Kanda K, Ikarashi K, Kawasaki T. Differential mossy fiber projections to the dorsal and ventral uvula in the cat. J Comp Neurol. 1989;279:149–164. doi: 10.1002/cne.902790113. [DOI] [PubMed] [Google Scholar]
- Shaikh AG, Green AM, Ghasia FF, Newlands SD, Dickman JD, Angelaki DE. Sensory convergence solves a motion ambiguity problem. Curr Biol. 2005;15:1657–1662. doi: 10.1016/j.cub.2005.08.009. [DOI] [PubMed] [Google Scholar]
- Simpson JI, Belton T, Suh M, Winkelman B. Complex spike activity in the flocculus signals more than the eye can see. Ann NY Acad Sci. 2002;978:232–236. doi: 10.1111/j.1749-6632.2002.tb07570.x. [DOI] [PubMed] [Google Scholar]
- Solomon D, Cohen B. Stimulation of the nodulus and uvula discharges velocity storage in the vestibulo-ocular reflex. Exp Brain Res. 1994;102:57–68. doi: 10.1007/BF00232438. [DOI] [PubMed] [Google Scholar]
- Stone LS, Lisberger SG. Visual responses of Purkinje cells in the cerebellar flocculus during smooth-pursuit eye movements in monkeys. II. Complex spikes. J Neurophysiol. 1990;63:1262–1275. doi: 10.1152/jn.1990.63.5.1262. [DOI] [PubMed] [Google Scholar]
- Takahashi K, Gu Y, May PJ, Newlands SD, DeAngelis GC, Angelaki DE. Multi-modal coding of three-dimensional rotation and translation in area MSTd: comparison of visual and vestibular sensitivity. J Neurosci. 2007;27:9742–9756. doi: 10.1523/JNEUROSCI.0817-07.2007. [DOI] [PMC free article] [PubMed] [Google Scholar]
- Thunnissen IE, Epema AH, Gerrits NM. Secondary vestibulocerebellar mossy fiber projection to the caudal vermis in the rabbit. J Comp Neurol. 1989;290:262–277. doi: 10.1002/cne.902900207. [DOI] [PubMed] [Google Scholar]
- Voogd J, Gerrits NM, Ruigrok TJ. Organization of the vestibulo-cerebellum. Ann NY Acad Sci. 1996;781:553–579. doi: 10.1111/j.1749-6632.1996.tb15728.x. [DOI] [PubMed] [Google Scholar]
- Wearne S, Raphan T, Cohen B. Control of spatial orientation of the angular vestibuloocular reflex by the nodulus and uvula. J Neurophysiol. 1998;79:2690–2715. doi: 10.1152/jn.1998.79.5.2690. [DOI] [PubMed] [Google Scholar]
- Welsh JP, Llinas R. Some organizing principles for the control of movement based on olivocerebellar physiology. Prog Brain Res. 1997;114:449–461. doi: 10.1016/s0079-6123(08)63380-4. [DOI] [PubMed] [Google Scholar]
- Whitworth RH, Jr, Haines DE, Patrick GW. The inferior olive of a prosimian primate, Galago senegalensis. II. Olivocerebellar projections to the vestibulo-cerebellum. J Comp Neurol. 1983;219:228–240. doi: 10.1002/cne.902190208. [DOI] [PubMed] [Google Scholar]
- Wylie DR, Frost BJ. Responses of neurons in the nucleus of the basal optic root to translational and rotational flowfields. J Neurophysiol. 1999;81:267–276. doi: 10.1152/jn.1999.81.1.267. [DOI] [PubMed] [Google Scholar]
- Wylie DR, Brown MR, Winship IR, Crowder NA, Todd KG. Zonal organization of the vestibulo-cerebellum in pigeons (Columba livia): III. Projections of the translation zones of the ventral uvula and nodulus. J Comp Neurol. 2003;465:179–194. doi: 10.1002/cne.10857. [DOI] [PubMed] [Google Scholar]
- Yakhnitsa V, Barmack NH. Antiphasic Purkinje cell responses in mouse uvula-nodulus are sensitive to static roll-tilt and topographically organized. Neuroscience. 2006;143:615–626. doi: 10.1016/j.neuroscience.2006.08.006. [DOI] [PubMed] [Google Scholar]
- Yakusheva TA, Shaikh AG, Green AM, Blazquez PM, Dickman JD, Angelaki DE. Purkinje cells in posterior cerebellar vermis encode motion in an inertial reference frame. Neuron. 2007;54:973–985. doi: 10.1016/j.neuron.2007.06.003. [DOI] [PubMed] [Google Scholar]
- Yakusheva T, Blazquez PM, Angelaki DE. Frequency-selective coding of translation and tilt in macaque cerebellar nodulus and uvula. J Neurosci. 2008;28:9997–10009. doi: 10.1523/JNEUROSCI.2232-08.2008. [DOI] [PMC free article] [PubMed] [Google Scholar]
- Yakusheva T, Blazquez PM, Angelaki DE. Complex spike responses of Purkinje cells in macaque cerebellar nodulus and uvula to vestibular stimulation. Soc Neurosci Abstr. 2009;35:357–9. [Google Scholar]
- Yarom Y, Cohen D. The olivocerebellar system as a generator of temporal patterns. Ann NY Acad Sci. 2002;978:122–134. doi: 10.1111/j.1749-6632.2002.tb07561.x. [DOI] [PubMed] [Google Scholar]