

Abstract
Background
Activation of inflammatory pathways is one plausible mechanism underlying the association between obesity and increased breast cancer risk. However, macrophage infiltration and local biomarkers of inflammation in breast adipose tissue have seldom been studied in association with obesity.
Experiment Design
Gene expression profiles of normal breast tissue from reduction mammoplasty patients. were evaluated by whole genome microarrays to identify patterns associated with obesity status (normal-weight, body mass index (BMI) < 25; overweight, BMI 25-29.9; obese, BMI ≥ 30). The presence of macrophage-enriched inflammatory loci with immunopositivity for CD68 protein was evaluated by immunohistochemistry (IHC).
Results
After adjusting for confounding by age, 760 genes were differentially expressed (203 up and 557 down; FDR=0.026) between normal-weight and obese women. Gene ontology analysis suggested significant enrichment for pathways involving IL-6, IL-8, CCR5 signaling in macrophages and RXRα and PPARα activation, consistent with a pro-inflammatory state and suggestive of macrophage infiltration. Gene Set Enrichment Analysis (GSEA) also demonstrated that the genomic signatures of monocytes and macrophages were overrepresented in the obese group with FDR of 0.08 and 0.13 respectively. Increased macrophage infiltration was confirmed by IHC, which showed that the breast adipose tissue of obese women had higher average macrophage counts (mean=8.96 vs 3.56 in normal-weight women) and inflammatory foci counts (mean=4.91 vs 2.67 in normal-weight women).
Conclusion
Obesity is associated with local inflammation and macrophage infiltration in normal human breast adipose tissues. Given the role of macrophages in carcinogenesis, these findings have important implications for breast cancer etiology and progression.
Keywords: obesity, breast, inflammation, gene expression, macrophage infiltration
INTRODUCTION
In past decades, the relationship between obesity and breast cancer risk has been extensively studied. It has been established that obesity is strongly associated with a higher risk of postmenopausal breast cancer with a 12% increase in risk per 5 kg/m2 increase in body mass index (BMI) [1-3]. Recent research has suggested that obesity may also be associated with premenopausal breast cancer [4]. In the largest study based on pooled data from 35,568 invasive breast cancer cases, Yang et al. found that obesity was associated with increased risk of estrogen receptor negative/progesterone receptor negative (ER-/PR-) tumors with an even stronger relation with triple-negative or basal-like tumors among younger women (≤ 50 years) [5]. Thus, while the relationships between obesity and breast cancer risk are complex, there is growing evidence to support an etiologic role for obesity in multiple types of breast cancer, both premenopause and postmenopause. These epidemiologic findings underscore the importance of research on obesity-associated breast cancer risk and its underlying biological mechanisms.
Obesity is characterized by expanded adipose tissue, which is traditionally considered as the physiological site of energy storage. However, adipose tissue is also recognized as an endocrine organ actively participating in numerous physiological processes [6, 7]. The biological basis for obesity-associated breast cancer risk is not well established, though several mechanisms have been postulated including dysregulated steroid hormone levels or response, insulin resistance, insulin-like growth factor pathways, and adipokines [8-11]. It is clear that obesity results in impaired adipose tissue function, ultimately, increasing production and secretion of inflammatory molecules, like tumor necrosis factor-α (TNF-α), interleukin-6 (IL-6), and monocyte chemotactic protein-1(MCP-1) [12, 13]. These molecules have both local and systemic inflammation effects [1, 7].
While systemic effects have been a major focus of obesity-biomarker research, local effects on breast cancer microenvironment are also important to consider. Locally, cancer-related inflammation is characterized by inflammatory cell infiltration, increased levels of inflammatory cytokines, and tissue remodeling, together mimicking biological processes present during [14, 15]. Sustained local inflammation attenuates cell-mediated immunity and increases angiogenesis, providing an ideal microenvironment for cancer development and progression [16, 17]. Thus, the hypothesis that chronic local inflammation induced by obesity may predispose individuals to breast cancer or may alter the progression of disease is theoretically sound. However, the presence of inflammatory biomarkers and the presence of specific inflammatory cell types in breast tissue has received limited investigation. Most often, when breast tissue is studied, it is tissue of women with disease (invasive breast cancer, ductal carcinoma in situ, or benign breast disease). To evaluate the hypothesis that obesity increases local inflammation and creates an ideal microenvironment for cancer promotion and progression, we evaluate gene expression profiles and performed immunohistochemical (IHC) analysis of the normal breast tissue from reduction mammoplasty patients. Our findings demonstrate that in women without disease, obesity is associated with local changes in gene expression and cellular composition.
MATERIALS AND METHODS
Study population
Study subjects were women undergoing reduction mammoplasty at Baystate Medical Center in Springfield, Massachusetts between 2007 and 2010. The Institutional Review Boards at Baystate Medical Center and University of Massachusetts Amherst approved the study. All participants consented to provide excess tissues not needed for diagnostic purposes. Tissues were handled by snap freezing immediately after surgery and stored at −80°C. Specimens were excluded if pathologic assessment of patient-matched, paraffin-embedded tissues suggested any abnormal malignant or premalignant findings. Demographic and reproductive information were collected by a telephone interview administered following surgery. Patients in the current investigation include those with complete data on BMI, available fresh frozen tissues to perform microarray, and paraffin blocks for IHC.
RNA isolation and microarrays
All microarrays were performed at the University of North Carolina at Chapel Hill. Frozen specimens were cut over dry ice and then homogenized (approximately 100mg whole tissue specimen was homogenized for nucleic acid isolation). RNA was isolated following standard manufacturer protocols using RNeasy kits. Higher RNA yields were obtained with fatty, reduction mammoplasty tissues when using a Qiazol extraction step (Qiagen) prior to purification on RNeasy column as described in Troester et al [18]. RNA quality and quantity were analyzed on an Agilent 2100 Bioanalyzer and a ND-1000 Nanodrop spectrophotometer respectively before running two-color 4X44K Agilent whole genome arrays. Cy3-labeled reference was produced from total RNA from Stratagene Universal Human Reference (spiked with 1:1,000 with MCF-7 RNA and 1:1,000 with ME16C RNA to increase expression of breast cancer genes) following amplification with Agilent low RNA input amplification kit with minor modifications as described in Hu et al [19]. The identical protocol was applied to total RNA from reduction mammoplasty specimens, with all patient samples labeled with Cy5. Data were Lowess-normalized and probes that had a signal of <10 dpi in either channel were excluded as missing, and probes that had more than 20% missing data across all samples were excluded from further analysis. After mapping the ENTREZ ID based on manufacture ID using Bioconductor libraries (hgug4112a.db: hgug4112aENTREZID) [20, 21], we (a) eliminated the probes without corresponding ENTREZ ID, (b) took the average of the duplicate probes, and (c) imputed missing data using k-nearest neighbors (KNN) method with k=10. To focus on genes with variable expression, we further excluded the probes with interquartile range (IQR) < median IQR. After the above preprocessing, the number of the genes in the analysis was 8280. All data are publicly available through the Gene Expression Omnibus (GSE16113 and GSE pending).
Gene expression data analysis
All of the following data analyses were performed using R (version 2.9.2). Obese status of the study subjects was categorized into three groups based on BMI using current Center for Disease Control (CDC) and World Health Organization (WHO) definitions: obese was defined as BMI ≥ 30 kg/m2, overweight was defined as 25 kg/m2 ≤ BMI < 30 kg/m2, and normal-weight was defined as BMI< 25 kg/m2. No patients in this study had BMI less than 20 kg/m2. The distribution of the selected characteristics of the study subjects by obese status was evaluated using Fisher’s exact test, with significant association defined using a two-sided α of 0.05. Covariates that were associated with both obesity (p≤0.05) and differential gene expression (false-discovery rate (FDR) ≤ 0.05) were considered as potential confounders and further included in the model selection. Considering the sample size, a forward selection strategy and partial F-test were used to refine the model [22]. Potential confounders were added into the model with gene expression level as the dependent variable and obese status as the independent variable. The covariate was retained in the ANOVA model if it was associated with differentially expressed genes in the presence of obesity. FDR was used to control type I error due to multiple testing.
The biological function and network of the significant genes were assessed using Ingenuity Systems Pathway analysis (IPA) (Ingenuity® Systems, www.ingenuity.com). To confirm the pathways or functions suggested by IPA, Gene Set Enrichment Analysis (GSEA version 3.5) was performed. The genomic profiles of human peripheral monocytes [23] and human abdominal adipose tissue macrophages [24] were evaluated by GSEA, including all the genes in each of these published lists that mapped to data from the reduction mammoplasty specimens on 4X44K Agilent microarrays. Phenotype permutation (normal-weight vs obese) and FDR were used to assess multiple testing [25] with FDR<0.25 considered statistically significant [26].
Macrophage infiltration
IHC was used to evaluate macrophage infiltration. In brief, formalin-fixed, paraffin-embedded tissues were sectioned at 7 micrometers and stained with antibody to CD68 (abcam, ab955, diluted 1:200) with diaminobenzidine. CD68 staining was revealed through the use of a biotinylated secondary (Jackson ImmunoResearch 115-065-166), ABC complex (Standard Elite Vector Laboratories, PK6100) and reacted in diaminobenzidine (Invitrogen DAB Substrate Kit 00-2014). CD68 positive cells were quantitated in adipose tissue, with macrophage infiltration measured by the average count of CD68 positive cells in three randomly-selected 10X fields per patient, and inflammatory foci measured as total number per slide of aggregations of CD68 positive cells (CD68 positive cells ≥ 5).
RESULTS
Characteristics of the study population
As is typical for women undergoing reduction mammoplasty, patients in our study tended to be more obese than general U.S. population [27] with mean BMI of 30.1 kg/m2 [standard deviation (SD)=5.9 and range of 22.2 kg/m2-48.2 kg/m2]. In this study, 22%, 38% and 40% of the 74 women were normal-weight, overweight, and obese, respectively. Table 1 shows the population characteristics according to obesity status. The women in the higher categories of BMI were more likely to be older, postmenopausal, past oral contraceptive users and past smokers (p≤0.05 in all instances). We did not observe significant difference in race/ethnicity, parity, breastfeeding, and first-degree family history of breast cancer by obesity status. Age, menopausal status, smoking, and oral contraceptive use were considered as potential confounders of the obesity-gene expression association. However, further analysis indicated that only age showed a significant effect (FDR≤0.05) on the gene expression when obesity status was already in the model. Therefore the final ANOVA model for obesity-associated gene expression included only age and obesity status.
Table 1.
Characteristics of the study population by obesity statusa (n=74)
| Characteristics | Normal (n=16) | Overweight (n=28) | Obese (n=30) | P |
|---|---|---|---|---|
| BMI (kg/m2) | 23.8 ± 0.8 | 27.5 ± 1.4 | 36.0 ± 4.4 | <0.01 |
| Age (year) | 31.0 ± 13.7 | 31.9 ± 14.0 | 41.6 ± 13.0 | <0.01 |
| Race | ||||
| Non-Hispanic white | 13 (81) | 18 (64) | 18 (60) | 0.43 |
| Non-Hispanic black | 0 | 3 (11) | 5 (17) | |
| Hispanic | 3 (19) | 7 (25) | 5 (17) | |
| Other | 0 | 0 | 2 (7) | |
| Menopausal status | ||||
| Premenopausal | 13 (87) | 25 (93) | 15 (52) | <0.01 |
| Postmenopausal | 2 (13) | 2 (7) | 14 (48) | |
| Parity | ||||
| Yes | 7 (44) | 16 (57) | 17 (57) | 0.66 |
| No | 9 (56) | 12 (43) | 13 (43) | |
| Breastfeeding | ||||
| Yes | 10 (63) | 13 (46) | 16 (53) | 0.63 |
| No | 6 (38) | 15 (54) | 14 (47) | |
| Smoking | ||||
| Never | 12 (75) | 20 (71) | 14 (47) | 0.05 |
| Past | 2 (13) | 8 (29) | 11 (37) | |
| Current | 2 (13) | 0 | 5 (17) | |
| Family historyb | ||||
| Yes | 0 | 2 (7) | 2 (7) | 0.68 |
| No | 15 (100) | 26 (93) | 28 (93) | |
| Oral contraceptive use | ||||
| Never | 5 (31) | 6 (21) | 9 (30) | 0.02 |
| Past | 4 (25) | 17 (61) | 19 (63) | |
| Current | 7 (44) | 5 (18) | 2 (7) |
The numbers are mean ± SE and n(%). P-values were calculated by ANOVA for continuous variables and Fisher’s exact test for categorical variables. Normal-weight was defined as BMI<25 kg/m2, overweight as 25 kg/m2≤BMI<30 kg/m2, and obese as BMI≥30 kg/m2.
First-degree relatives.
Differentially expressed genes by obese status
Using the microarray data from 74 reduction mammoplasty samples with gene expression levels as outcome/dependent variables, we performed ANOVAs to identify genes that were differentially expressed by obesity status with normal-weight women as the reference category. After controlling for age, a genomic profile of 760 genes that was differentially expressed between obese group and normal-weight group (FDR<0.026) was identified, with 203 genes up-regulated and 557 down-regulated (Supplementary Table 1). Figure 1A demonstrates that the 760-gene signature produced a distinct difference between normal-weight and obese women using a one-way cluster of these genes with the 74 patients ordered by BMI. Interestingly, this figure shows there was relative homogeneity within the categories of BMI≥30 kg/m2 and BMI<25 kg/m2, but substantial heterogeneity existed among those in the overweight group (25 kg/m2 ≤ BMI < 30 kg/m2). By two-way hierarchical-clustering of the detected signature (Figure 1B), the study subjects were divided into three clusters. One cluster was very small including 7 women who were similar to the rest of the study population (including the distribution of obesity status) with the exception of including more minorities (p=0.08). In the remaining two clusters, one was enriched for normal-weight women (86% of normal-weight women were together in this cluster), and the other was enriched for obese women (78% of obese women were in this cluster). Overweight women were evenly distributed across the two clusters with about half in the normal-weight-enriched cluster (44%) and about half in the obese-enriched cluster (56%). Chi-square p-value for distribution of overweight among normal-weight or obese clusters was 0.30. Thus both one-dimensional (genes only) and two-dimensional (genes and samples) clusterings are suggestive of distinct BMI-associated gene expression effects between normal-weight and obese groups and an intermediate phenotype in overweight women. To evaluate whether there was a dose-response relationship between BMI and expression of the obesity-associated gene expression profile, the 64 patients from the two main clusters (normal-weight-enriched and obese-enriched clusters) were shown in Figure 1C according to BMI group (four groups: <25 kg/m2; 25-27.49 kg/m2; 27.5-29.99 kg/m2; ≥ 30 kg/m2). The percentage of patients in obese-enriched cluster increased with monotonically with BMI.
Figure 1. Differential Gene Expression by Obesity Status.

A genomic signature (760 genes) differentially expressed between normal breast tissue of obese (BMI ≥ 30 kg/m2) and normal-weight (BMI< 25 kg/m2) reduction mammoplasty patients (FDR<0.026). (A) One-way (genes only) clustering of the identified signature (203 up and 557 down) with 74 patients ordered by BMI. (B) Two-way clustering (genes and samples) of the identified signature. Three clusters were identified with one enriched for obese patients (left), one enriched for normal-weight patients (middle). (C) The percentage of patients in obese-enriched cluster based on two-way cluster analysis increased with BMI. The number above each bar was the count of patient in each category.
IPA was used to analyze for biological enrichment of specific pathways in the obesity-associated genomic signature detected by two-way ANOVA. As shown in Table 2, the up-regulated genes in the 760-gene signature suggested association with endocrine system disorders and metabolic diseases including diabetes mellitus, metabolic syndrome X, nonalcoholic fatty liver, and dyslipidemia (Supplementary Table 2). Given the close associations between these diseases/disorders with obesity, the findings preliminarily indicated that changes in endocrine and metabolism induced by obesity may be reflected locally in the breast tissues. Interestingly, the up-regulated genes were also related to reproductive system diseases, particularly mammary carcinoma (Supplementary Table 2).
Table 2.
Functional analysis of the differentially expressed signature by obesity status based on the Ingenuity Pathways Analysis (IPA).
| Up-regulated | |
| Diseases and Disorders | p-value |
| Endocrine System Disorders | 2.60E-04 - 2.90E-02 |
| Genetic Disorde | 2.60E-04 - 4.19E-02 |
| Metabolic Disease | 2.60E-04 - 3.55E-02 |
| Reproductive System Disease | 1.55E-03 - 3.93E-02 |
| Hematological Disease | 2.87E-03 - 4.19E-02 |
| Top Canonical Pathways | p-value |
| IL-6 Signaling | 1.8E-02 |
| PPARα/RXRα Activation | 2.63E-02 |
| Phospholipase C Signaling | 3.45E-02 |
| IL-8 Signaling | 3.6E-02 |
| CCR5 Signaling in Macrophages | 3.72E-02 |
| Down-regulated | |
| Diseases and Disorders | p-value |
| Dermatological Disease and Conditions | 2.23E-04 - 4.51E-02 |
| Connective Tissue Disorders | 6.37E-04 - 4.51E-02 |
| Genetic Disorder | 6.37E-04 - 4.81E-02 |
| Cancer | 7.29E-04 - 4.81E-02 |
| Infection Mechanism | 7.29E-04 - 9.76E-03 |
| Top Canonical Pathways | p-value |
| MSP-RON Signaling Pathway | 1.87E-04 |
| Wnt/β-catenin Signaling | 7.25E-04 |
| Cardiac β-adrenergic Signaling | 8.34E-03 |
| Agrin Interactions at Neuromuscular Junction | 9.35E-03 |
| Virus Entry via Endocytic Pathways | 1.03E-02 |
The 760-gene signature also suggested enrichment for many canonical pathways. Among them, IL-6 and IL-8 signaling, PPARα/RXRα activation, and CCR5 (CD195, a receptor for RANTES and macrophage inflammatory protein (MIP)) signaling in macrophages were up-regulated. All of these pathways have plausible links to infiltration and/or action of macrophages, and considering the well-established association between obesity and infiltration of macrophages in human abdominal adipose tissues [12, 13], we hypothesized that breast tissue in obese women would show changes in cellular composition, especially influx of macrophages.
Infiltration of macrophages
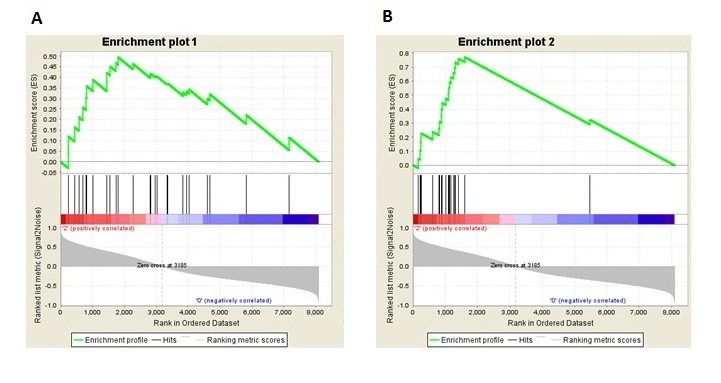
To evaluate the hypothesis that macrophages accumulate in the breast adipose tissues of obese women, we first took advantages of our gene expression data and performed GSEA analysis using published gene expression profiles of human peripheral monocytes [23] and human abdominal adipose tissue macrophages [24] respectively (see Supplementary Table 3 for gene list). Compared to normal-weight women, the monocyte genomic profile signature was enriched among obese women with a normalized enrichment score of 1.39 and FDR of 0.08. Likewise, the abdominal-adipose macrophage genomic profile was also enriched with a normalized enrichment score of 1.42 and FDR of 0.13 (Supplementary Figure 1). These analyses show that monocyte/macrophage-associated genomic signatures are overrepresented in the adipose tissue of obese women relative to normal-weight women.
More direct evidence of changes in composition would come from imaging studies of the human tissues. Thus, to confirm the presence of macrophages consistent with the gene expression data, infiltration of macrophages in breast tissue comparing normal-weight and obese women was assessed using IHC staining for CD68. The analysis included all obese and normal-weight women from the microarray study for whom paraffin sections were available, resulting in 41 women (18 normal-weight and 23 obese). The counts of macrophages in adipose tissue were more than two-fold higher in obese women compared to normal-weight women (8.96 per 10X field in obese women; 3.56 per 10X field in normal-weight women. p-value=0.07). Comparing patients with macrophage count ≥5 per 10X field to those with low infiltration (0-4 macrophages), we observed a substantial association between obesity status and macrophage infiltration (OR=4.58; 95% CI (1.0379, 20.2401); Fisher’s exact p-value=0.05) (Figure 2, representative normal tissue samples shown in Supplement Figure 2). Similar associations were observed considering inflammatory foci in breast adipose tissues. The average number of foci was 2.67 among normal-weight women compared to 4.91 among obese women. The presence (vs absence) of inflammatory foci showed a modest, but non-significant association with obesity status (OR=2.44; 95% CI (0.69, 8.66); p-value=0.16).
Figure 2. Differential macrophage infiltration by obesity status.

Comparison of infiltration of macrophages (measured by immunohistochemical staining of CD68) in breast tissue between obese (n=23) and normal-weight patients (n=18). (A) Percentages of patients with high levels of macrophage infiltration and presence of inflammatory foci is given according to obesity status (obese vs normal-weight). (B) Representative pictures of macrophage inflammatory foci in breast adipose tissues.
DISCUSSION
The human breast is a unique organ in that adipose tissue is a majority component, comprising up to 56% of the total breast volume [28]. Therefore, adipose tissue plays a critical role in regulating the microenvironment of breast tissue. However the dynamics of the gene expression and cellular composition of breast tissue in response to various exposures and stimuli are not well studied. Adipose tissue is not only a passive reservoir for energy storage, but also a metabolic and endocrine organ, secreting numerous bioactive substrates termed adipokines, such as leptin, adiponectin, and resistin, as well as cytokines which act on the local breast microenvironment and systemically [12, 29]. Adipose tissue also harbors macrophages that maintain a balance in the production of pro- and anti-inflammatory adipocytokines [30-32], which can be disrupted in obesity to create a chronic low-grade inflammatory state [33]. While tissue studies in animals have shown that inhibition of macrophage infiltration into obese adipose tissue can ameliorate the dysregulation of adipocytokine production, and further ameliorate adipose tissue inflammation and insulin resistance [34, 35], most evidence in humans regarding this pathological process are based on the studies of abdominal/visceral adipose tissue [36]. In the current study, we found evidence that this process may occur in nonmalignant breast tissue.
Many of the processes identified in our gene expression profile are well established pathological conditions known to increase with obesity, however, we also identified specific pathways that are known to play an important role in breast microenvironment (e.g. IL-6) and that have been previously been described as systemic effects of obesity [6, 36]. The origin of the IL_6 signaling in our study may be from a variety of stromal sources, but previous studies have suggested that in adipose tissue, non-adipose stroma are the most likely contributors [36]. In our IHC analyses, macrophages are a likely contributor [37]. The identification of other interleukin signaling pathways as co-expressed (CCR5, and PPARα) also suggests a role for macrophages. The implications of this shift in the microenvironment milieu are compelling, particularly given research emphasizing the importance of IL-6 and IL-8 in maintaining a stem cell-like population in the breast [38]. Other pathways associated with mammary stem/progenitor cells and mammary gland development [39-41], such as such as Wnt/β-catenin and RANK signaling pathways were also implicated in the gene expression patterns. In Ojalvo et al. [42] and in Lau et al. [43], these pathways are expressed in differentiating tumor associated macrophages (TAMs), themselves, so tissue-level imaging of pathway specific markers will be needed to identify the source of these signals in normal breast tissue. Thus further research regarding how macrophages and premalignant/malignant breast epithelium communicate in relation to breast cancer progression could provide important mechanistic insight for obesity-associated breast cancer.
Our sample size (n=74) was similar to that for other observational microarray-based studies [44] and represents the largest reported study of reduction mammoplasty gene expression, but we may have limited the power to detect the differences in certain gene expression levels between BMI-defined groups. To offset concerns about the sample size, findings presented here were strengthened by combining gene expression data with histological features and more focused analyses of specific gene sets. Observations of inflammation and macrophage infiltration (detected in gene-by-gene significance analysis and ontology/pathway analysis) were supported by testing specific hypotheses based on the most relevant papers by using pathway analysis using GSEA and by performing an immunohistochemical validation study. The consistency of the results of various analyses using multiple techniques and approaches strengthens our inference and decreases the emphasis on individual gene-based statistical hypothesis tests. While the variance and small sample size for the histological analyses resulted in p-values of p=0.05 and p=0.07, the association was strong and is supportive of the statistically significant associations we observed by microarray. As per Poole [45], selecting associations based on p-values is not a strong basis for scientific inference. Poole notes that “results that deserve the greatest reliance are those that are most stable and trustworthy.” The stability of our results are supported by technically independent but biologically consistent results. Future work should evaluate inflammation markers in independent test sets, preferably with large numbers of reduction mammoplasty patients.
Our analysis was out analytical approaches also represents a strength of this work. While there are few established methods for addressing confounding in observational microarray studies [46, 47], we used multivariable models to assess this important source of bias. Interestingly, age emerged as an important variable determining the gene expression. Age-associated effects on gene expression have been well recognized in animal tissues [48, 49]; but further study in human breast tissue merits investigation. We also examined interaction (data not shown), and found limited evidence for effect modification by the factors we examined. For example, the gene expression did not vary substantially by menopausal status, hence preand post-menopausal women were grouped together. With larger sample sizes, it may be possible to evaluate additional interactions between obesity and menopausal status or reproductive history, which could help to elucidate which additional mechanisms have dominance during different windows of susceptibility.
Our study focused on reduction mammoplasty patients, which tend to have higher BMI than the general population. Nevertheless, there were also women with quite low BMI in our sample. In addition, the women in this study showed distributions of parity status and menopausal status not dissimilar to these of the general population. Thus, while reduction mammoplasty patients may not represent all women in the population (e.g. women with BMI < 20 kg/m2 or with very small breasts), the data here are still biologically relevant for a large subset of the general population. Furthermore, results presented here are consistent with recent studies focused on mice and breast cancer patients [50, 51]. Subbaramaiah et al [51] observed crown-like structures (CLS) (similar structure as inflammation foci), and observed increased NF-kB binding activity and elevated aromatase expression and activity in breast tissues of obese mice. Morris et al [50] showed that 75% of obese and 70% of overweight breast cancer patients had CLS, while among normal-weight breast cancer patients only 8.3% had CLS. This corresponds to an approximately 9-fold change in CLS comparing obese patients to normal-weight patients. In our study of women without breast cancer, we also observed a large fold-change in the proportion of patients with high macrophage infiltration and inflammatory foci comparing obese and normal-weight women (high macrophage infiltration more than four-fold and inflammatory foci more than two-fold more prevalent in obese compared to normal-weight women). Thus the association we observed confirms the trends reported previously for associations between obesity and inflammatory foci/CLS. Whether inflammatory foci in turn confer greater risk of cancer merits investigation in a larger study. However, based on our data and the previous literature, the prevalence of macrophage foci in obese cancer patients (75%) is 1.25 times that among obese non-diseased (60% among obese reduction mammoplasty patients), which implies possible associations between macrophage infiltration and cancer outcome among obese and overweight women. Importantly, our data show that macrophage infiltration in adipose tissue precedes disease and is present in normal women with no pathological findings.
While the role of macrophage infiltration in breast cancer etiology is not established, the role of macrophage infiltration in breast cancer progression has been more widely studied. It is believed that macrophage infiltration promotes of angiogenesis, matrix remodelling and suppression of adaptive immunity [52]. The tumor-associated macrophages (TAM) express several characteristics of M2-polarized macrophages [53], while obesity is believed to induce a phenotypic switch in macrophages from an anti-inflammatory M2 polarized state to a proinflammatory M1 state, with the M1 macrophages composing the “crown-like structures” surrounding adipocytes [54, 55]. Thus, based on biological dynamics during disease progression, a possible model for the role of macrophages in etiology is that chronic inflammation caused by obesity (with microphage in M1 state) causes DNA damage, such as oncogene activation or tumor-suppressor genes inactivation. Alternatively, the presence of macrophage in the obese microenvironment from the earliest stages of tumor onset may lead to promotion of very early cancers through specific signaling mechanisms, including elevated expression of NF-κB and increased aromatase activity as recently reported [50]. Further studies should evaluate the specific M1 and M2 markers that may help delineate more subtle population shifts among the mixed population of CD68 cells. A recent study suggests that proliferation markers in combined with CD68 staining may also have prognostic value [56]. Thus, a wide range of markers for macrophage dynamic and inflammatory effects in normal tissue may provide new insight into the etiology and progression of breast cancer. Each of these markers should be evaluated in light of the heterogeneity of breast cancer, preferably by both menopausal status and by estrogen receptor status. Further research on the tissue composition and gene expression behavior of normal breast tissue in relation to breast cancer could identify important etiologic pathways underlying the association between obesity and breast cancer.
Supplementary Material
Supplementary Figure 1. Enrichment plots for genomic signatures of monocytes (Du et al. 2006) and macrophages (Klimcakova et al. 2011) in gene expression profile of normal breast tissues from reduction mammoplasty patients with phenotype permutation (obese vs normal-weight, n=46). (A) Enrichment plot of the genomic profile for human peripheral blood monocytes (27 genes). (B) Enrichment plot of the genomic profile for human adipose tissue macrophage (21 genes). Detailed gene lists are shown in Supplementary Table 3.
Supplementary Figure 2. Representative pictures of breast adipose tissues of normal-weight patients.
Supplementary Table 1. The full gene list and direction of change for the genomic profile that is differentially expressed in normal breast tissue between obese and normal-weight reduction mammoplasty patients (760 genes: 203 genes up-regulated and 557 down-regulated. FDR<0.026).
Supplementary Table 2. Summary of the function analysisal of the obesity-associated signature based on the Ingenuity Pathways Analysis (IPA).
Supplementary Table 3. Genomic signatures of human peripheral monocytes and adipose tissue macrophages adapted from Du et al. (2006) and Klimcakova et al. (2011), respectively (ref. 23 and 24), including all genes in each of these published lists that mapped to data from the reduction mammoplasty specimens on 4X44K Agilent microarrays.
ACKNOWLEDGMENTS
This project was supported by a grant from the National Institutes of Cancer (R01-CA138255), a Breast SPORE (P50CA058223) Career Development Award to M.A.T., a grant from the Avon Foundation, and the University Cancer Research Fund at the University of North Carolina. We are grateful to Melissa Rotunno for helpful comments on this work.
REFERENCES
- 1.Carmichael AR, Bates T. Obesity and breast cancer: a review of the literature. Breast. 2004;13:85–92. doi: 10.1016/j.breast.2003.03.001. DOI:10.1016/j.breast.2003.03.001. [DOI] [PubMed] [Google Scholar]
- 2.Huang Z, Hankinson SE, Colditz GA, et al. Dual effects of weight and weight gain on breast cancer risk. JAMA. 1997;278:1407–1411. [PubMed] [Google Scholar]
- 3.Renehan AG, Tyson M, Egger M, et al. Body-mass index and incidence of cancer: a systematic review and meta-analysis of prospective observational studies. Lancet. 2008;371:569–578. doi: 10.1016/S0140-6736(08)60269-X. DOI:10.1016/S0140-6736(08)60269-X. [DOI] [PubMed] [Google Scholar]
- 4.Ursin G, Longnecker MP, Haile RW, et al. A meta-analysis of body mass index and risk of premenopausal breast cancer. Epidemiology. 1995;6:137–141. doi: 10.1097/00001648-199503000-00009. [DOI] [PubMed] [Google Scholar]
- 5.Yang XR, Chang-Claude J, Goode EL, et al. Associations of breast cancer risk factors with tumor subtypes: a pooled analysis from the Breast Cancer Association Consortium studies. J Natl Cancer Inst. 2011;103:250–263. doi: 10.1093/jnci/djq526. DOI:10.1093/jnci/djq526. [DOI] [PMC free article] [PubMed] [Google Scholar]
- 6.Ahima RS. Adipose tissue as an endocrine organ. Obesity (Silver Spring) 2006;14(Suppl 5):242S–249S. doi: 10.1038/oby.2006.317. DOI:10.1038/oby.2006.317. [DOI] [PubMed] [Google Scholar]
- 7.Wozniak SE, Gee LL, Wachtel MS, et al. Adipose tissue: the new endocrine organ? A review article. Dig Dis Sci. 2009;54:1847–1856. doi: 10.1007/s10620-008-0585-3. DOI:10.1007/s10620-008-0585-3. [DOI] [PubMed] [Google Scholar]
- 8.Endogenous Hormones and Breast Cancer Collaborative Group. Key TJ, Appleby PN, et al. Insulin-like growth factor 1 (IGF1), IGF binding protein 3 (IGFBP3), and breast cancer risk: pooled individual data analysis of 17 prospective studies. Lancet Oncol. 2010;11:530–542. doi: 10.1016/S1470-2045(10)70095-4. DOI:10.1016/S1470-2045(10)70095-4. [DOI] [PMC free article] [PubMed] [Google Scholar]
- 9.Tsugane S, Inoue M. Insulin resistance and cancer: epidemiological evidence. Cancer Sci. 2010;101:1073–1079. doi: 10.1111/j.1349-7006.2010.01521.x. DOI:10.1111/j.1349-7006.2010.01521.x. [DOI] [PMC free article] [PubMed] [Google Scholar]
- 10.Cleary MP, Grossmann ME. Minireview: Obesity and breast cancer: the estrogen connection. Endocrinology. 2009;150:2537–2542. doi: 10.1210/en.2009-0070. DOI:10.1210/en.2009-0070. [DOI] [PMC free article] [PubMed] [Google Scholar]
- 11.Jarde T, Perrier S, Vasson MP, et al. Molecular mechanisms of leptin and adiponectin in breast cancer. Eur J Cancer. 2011;47:33–43. doi: 10.1016/j.ejca.2010.09.005. DOI:10.1016/j.ejca.2010.09.005. [DOI] [PubMed] [Google Scholar]
- 12.Kershaw EE, Flier JS. Adipose tissue as an endocrine organ. J Clin Endocrinol Metab. 2004;89:2548–2556. doi: 10.1210/jc.2004-0395. DOI:10.1210/jc.2004-0395. [DOI] [PubMed] [Google Scholar]
- 13.Bluher M. Adipose tissue dysfunction in obesity. Exp Clin Endocrinol Diabetes. 2009;117:241–250. doi: 10.1055/s-0029-1192044. DOI:10.1055/s-0029-1192044. [DOI] [PubMed] [Google Scholar]
- 14.Mantovani A, Allavena P, Sica A, et al. Cancer-related inflammation. Nature. 2008;454:436–444. doi: 10.1038/nature07205. DOI:10.1038/nature07205. [DOI] [PubMed] [Google Scholar]
- 15.Coussens LM, Werb Z. Inflammation and cancer. Nature. 2002;420:860–867. doi: 10.1038/nature01322. DOI:10.1038/nature01322. [DOI] [PMC free article] [PubMed] [Google Scholar]
- 16.Allavena P, Garlanda C, Borrello MG, et al. Pathways connecting inflammation and cancer. Curr Opin Genet Dev. 2008;18:3–10. doi: 10.1016/j.gde.2008.01.003. DOI:10.1016/j.gde.2008.01.003. [DOI] [PubMed] [Google Scholar]
- 17.Sansone P, Bromberg J. Environment, inflammation, and cancer. Curr Opin Genet Dev. 2011;21:80–85. doi: 10.1016/j.gde.2010.11.001. DOI:10.1016/j.gde.2010.11.001. [DOI] [PubMed] [Google Scholar]
- 18.Troester MA, Lee MH, Carter M, et al. Activation of host wound responses in breast cancer microenvironment. Clin Cancer Res. 2009;15:7020–7028. doi: 10.1158/1078-0432.CCR-09-1126. DOI:10.1158/1078-0432.CCR-09-1126. [DOI] [PMC free article] [PubMed] [Google Scholar]
- 19.Hu Z, Fan C, Oh DS, et al. The molecular portraits of breast tumors are conserved across microarray platforms. BMC Genomics. 2006;7:96. doi: 10.1186/1471-2164-7-96. DOI:10.1186/1471-2164-7-96. [DOI] [PMC free article] [PubMed] [Google Scholar]
- 20.Zhang Y, Szustakowski J, Schinke M. Bioinformatics analysis of microarray data. Methods Mol Biol. 2009;573:259–284. doi: 10.1007/978-1-60761-247-6_15. DOI:10.1007/978-1-60761-247-6_15. [DOI] [PubMed] [Google Scholar]
- 21.Reimers M, Carey VJ. Bioconductor: an open source framework for bioinformatics and computational biology. Methods Enzymol. 2006;411:119–134. doi: 10.1016/S0076-6879(06)11008-3. DOI:10.1016/S0076-6879(06)11008-3. [DOI] [PubMed] [Google Scholar]
- 22.Rothman JK, Greenland S, Lash TL. Anonymous. Third edn Lippincott Williams & Wilkins; Philadephia: 2008. Modern Epidemiology. [Google Scholar]
- 23.Du X, Tang Y, Xu H, et al. Genomic profiles for human peripheral blood T cells, B cells, natural killer cells, monocytes, and polymorphonuclear cells: comparisons to ischemic stroke, migraine, and Tourette syndrome. Genomics. 2006;87:693–703. doi: 10.1016/j.ygeno.2006.02.003. DOI:10.1016/j.ygeno.2006.02.003. [DOI] [PubMed] [Google Scholar]
- 24.Klimcakova E, Roussel B, Kovacova Z, et al. Macrophage gene expression is related to obesity and the metabolic syndrome in human subcutaneous fat as well as in visceral fat. Diabetologia. 2011;54:876–887. doi: 10.1007/s00125-010-2014-3. DOI:10.1007/s00125-010-2014-3. [DOI] [PubMed] [Google Scholar]
- 25.Subramanian A, Tamayo P, Mootha VK, et al. Gene set enrichment analysis: a knowledge-based approach for interpreting genome-wide expression profiles. Proc Natl Acad Sci U S A. 2005;102:15545–15550. doi: 10.1073/pnas.0506580102. DOI:10.1073/pnas.0506580102. [DOI] [PMC free article] [PubMed] [Google Scholar]
- 26. [Accessed 03 August 2011];GSEA user guide. http://www.broadinstitute.org/gsea/doc/GSEAUserGuideFrame.html.
- 27.Flegal KM, Carroll MD, Ogden CL, et al. Prevalence and trends in obesity among US adults, 1999-2008. JAMA. 2010;303:235–241. doi: 10.1001/jama.2009.2014. DOI:10.1001/jama.2009.2014. [DOI] [PubMed] [Google Scholar]
- 28.Vandeweyer E, Hertens D. Quantification of glands and fat in breast tissue: an experimental determination. Ann Anat. 2002;184:181–184. doi: 10.1016/S0940-9602(02)80016-4. [DOI] [PubMed] [Google Scholar]
- 29.Frayn KN, Karpe F, Fielding BA, et al. Integrative physiology of human adipose tissue. Int J Obes Relat Metab Disord. 2003;27:875–888. doi: 10.1038/sj.ijo.0802326. DOI:10.1038/sj.ijo.0802326. [DOI] [PubMed] [Google Scholar]
- 30.Hotamisligil GS. Inflammation and metabolic disorders. Nature. 2006;444:860–867. doi: 10.1038/nature05485. DOI:10.1038/nature05485. [DOI] [PubMed] [Google Scholar]
- 31.Nishimura S, Manabe I, Nagasaki M, et al. Adipogenesis in obesity requires close interplay between differentiating adipocytes, stromal cells, and blood vessels. Diabetes. 2007;56:1517–1526. doi: 10.2337/db06-1749. DOI:10.2337/db06-1749. [DOI] [PubMed] [Google Scholar]
- 32.Nishimura S, Manabe I, Nagasaki M, et al. In vivo imaging in mice reveals local cell dynamics and inflammation in obese adipose tissue. J Clin Invest. 2008;118:710–721. doi: 10.1172/JCI33328. DOI:10.1172/JCI33328. [DOI] [PMC free article] [PubMed] [Google Scholar]
- 33.Suganami T, Ogawa Y. Adipose tissue macrophages: their role in adipose tissue remodeling. J Leukoc Biol. 2010;88:33–39. doi: 10.1189/jlb.0210072. DOI:10.1189/jlb.0210072. [DOI] [PubMed] [Google Scholar]
- 34.Weisberg SP, Hunter D, Huber R, et al. CCR2 modulates inflammatory and metabolic effects of high-fat feeding. J Clin Invest. 2006;116:115–124. doi: 10.1172/JCI24335. DOI:10.1172/JCI24335. [DOI] [PMC free article] [PubMed] [Google Scholar]
- 35.Kanda H, Tateya S, Tamori Y, et al. MCP-1 contributes to macrophage infiltration into adipose tissue, insulin resistance, and hepatic steatosis in obesity. J Clin Invest. 2006;116:1494–1505. doi: 10.1172/JCI26498. DOI:10.1172/JCI26498. [DOI] [PMC free article] [PubMed] [Google Scholar]
- 36.Fain JN. Release of inflammatory mediators by human adipose tissue is enhanced in obesity and primarily by the nonfat cells: a review. Mediators Inflamm. 2010;2010:513948. doi: 10.1155/2010/513948. DOI:10.1155/2010/513948. [DOI] [PMC free article] [PubMed] [Google Scholar]
- 37.Weisberg SP, McCann D, Desai M, et al. Obesity is associated with macrophage accumulation in adipose tissue. J Clin Invest. 2003;112:1796–1808. doi: 10.1172/JCI19246. DOI:10.1172/JCI19246. [DOI] [PMC free article] [PubMed] [Google Scholar]
- 38.Korkaya H, Liu S, Wicha MS. Regulation of Cancer Stem Cells by Cytokine Networks: Attacking Cancers Inflammatory Roots. Clin Cancer Res. 2011 doi: 10.1158/1078-0432.CCR-10-2743. DOI:10.1158/1078-0432.CCR-10-2743. [DOI] [PMC free article] [PubMed] [Google Scholar]
- 39.Aupperlee MD, Drolet AA, Durairaj S, et al. Strain-specific differences in the mechanisms of progesterone regulation of murine mammary gland development. Endocrinology. 2009;150:1485–1494. doi: 10.1210/en.2008-1459. DOI:10.1210/en.2008-1459. [DOI] [PMC free article] [PubMed] [Google Scholar]
- 40.Asselin-Labat ML, Vaillant F, Sheridan JM, et al. Control of mammary stem cell function by steroid hormone signalling. Nature. 2010;465:798–802. doi: 10.1038/nature09027. DOI:10.1038/nature09027. [DOI] [PubMed] [Google Scholar]
- 41.Li Y, Welm B, Podsypanina K, et al. Evidence that transgenes encoding components of the Wnt signaling pathway preferentially induce mammary cancers from progenitor cells. Proc Natl Acad Sci U S A. 2003;100:15853–15858. doi: 10.1073/pnas.2136825100. DOI:10.1073/pnas.2136825100. [DOI] [PMC free article] [PubMed] [Google Scholar]
- 42.Ojalvo LS, Whittaker CA, Condeelis JS, et al. Gene expression analysis of macrophages that facilitate tumor invasion supports a role for Wnt-signaling in mediating their activity in primary mammary tumors. J Immunol. 2010;184:702–712. doi: 10.4049/jimmunol.0902360. DOI:10.4049/jimmunol.0902360. [DOI] [PMC free article] [PubMed] [Google Scholar]
- 43.Lau YS, Danks L, Sun SG, et al. RANKL-dependent and RANKL-independent mechanisms of macrophage-osteoclast differentiation in breast cancer. Breast Cancer Res Treat. 2007;105:7–16. doi: 10.1007/s10549-006-9438-y. DOI:10.1007/s10549-006-9438-y. [DOI] [PubMed] [Google Scholar]
- 44.Dupuy A, Simon RM. Critical review of published microarray studies for cancer outcome and guidelines on statistical analysis and reporting. J Natl Cancer Inst. 2007;99:147–157. doi: 10.1093/jnci/djk018. DOI:10.1093/jnci/djk018. [DOI] [PubMed] [Google Scholar]
- 45.Poole C. Low P-values or narrow confidence intervals: which are more durable? Epidemiology. 2001;12:291–294. doi: 10.1097/00001648-200105000-00005. [DOI] [PubMed] [Google Scholar]
- 46.Furlotte NA, Kang HM, Ye C, et al. Mixed-model coexpression: calculating gene coexpression while accounting for expression heterogeneity. Bioinformatics. 2011;27:i288–i294. doi: 10.1093/bioinformatics/btr221. DOI:10.1093/bioinformatics/btr221. [DOI] [PMC free article] [PubMed] [Google Scholar]
- 47.Teschendorff AE, Zhuang J, Widschwendter M. Independent surrogate variable analysis to deconvolve confounding factors in large-scale microarray profiling studies. Bioinformatics. 2011;27:1496–1505. doi: 10.1093/bioinformatics/btr171. DOI:10.1093/bioinformatics/btr171. [DOI] [PubMed] [Google Scholar]
- 48.Park SK, Prolla TA. Gene expression profiling studies of aging in cardiac and skeletal muscles. Cardiovasc Res. 2005;66:205–212. doi: 10.1016/j.cardiores.2005.01.005. DOI:10.1016/j.cardiores.2005.01.005. [DOI] [PubMed] [Google Scholar]
- 49.Park SK, Kim K, Page GP, et al. Gene expression profiling of aging in multiple mouse strains: identification of aging biomarkers and impact of dietary antioxidants. Aging Cell. 2009;8:484–495. doi: 10.1111/j.1474-9726.2009.00496.x. DOI:10.1111/j.1474-9726.2009.00496.x. [DOI] [PMC free article] [PubMed] [Google Scholar]
- 50.Morris PG, Hudis CA, Giri D, et al. Inflammation and increased aromatase expression occur in the breast tissue of obese women with breast cancer. Cancer Prev Res (Phila) 2011;4:1021–1029. doi: 10.1158/1940-6207.CAPR-11-0110. DOI:10.1158/1940-6207.CAPR-11-0110. [DOI] [PMC free article] [PubMed] [Google Scholar]
- 51.Subbaramaiah K, Howe LR, Bhardwaj P, et al. Obesity is associated with inflammation and elevated aromatase expression in the mouse mammary gland. Cancer Prev Res (Phila) 2011;4:329–346. doi: 10.1158/1940-6207.CAPR-10-0381. DOI:10.1158/1940-6207.CAPR-10-0381. [DOI] [PMC free article] [PubMed] [Google Scholar] [Retracted]
- 52.Balkwill F, Mantovani A. Inflammation and cancer: back to Virchow? Lancet. 2001;357:539–545. doi: 10.1016/S0140-6736(00)04046-0. DOI:10.1016/S0140-6736(00)04046-0. [DOI] [PubMed] [Google Scholar]
- 53.Mantovani A, Sozzani S, Locati M, et al. Macrophage polarization: tumor-associated macrophages as a paradigm for polarized M2 mononuclear phagocytes. Trends Immunol. 2002;23:549–555. doi: 10.1016/s1471-4906(02)02302-5. [DOI] [PubMed] [Google Scholar]
- 54.Lumeng CN, Bodzin JL, Saltiel AR. Obesity induces a phenotypic switch in adipose tissue macrophage polarization. J Clin Invest. 2007;117:175–184. doi: 10.1172/JCI29881. DOI:10.1172/JCI29881. [DOI] [PMC free article] [PubMed] [Google Scholar]
- 55.Lumeng CN, DelProposto JB, Westcott DJ, et al. Phenotypic switching of adipose tissue macrophages with obesity is generated by spatiotemporal differences in macrophage subtypes. Diabetes. 2008;57:3239–3246. doi: 10.2337/db08-0872. DOI:10.2337/db08-0872. [DOI] [PMC free article] [PubMed] [Google Scholar]
- 56.Chazenbalk G, Bertolotto C, Heneidi S, et al. Novel pathway of adipogenesis through cross-talk between adipose tissue macrophages, adipose stem cells and adipocytes: evidence of cell plasticity. PLoS One. 2011;6:e17834. doi: 10.1371/journal.pone.0017834. DOI:10.1371/journal.pone.0017834. [DOI] [PMC free article] [PubMed] [Google Scholar]
Associated Data
This section collects any data citations, data availability statements, or supplementary materials included in this article.
Supplementary Materials
Supplementary Figure 1. Enrichment plots for genomic signatures of monocytes (Du et al. 2006) and macrophages (Klimcakova et al. 2011) in gene expression profile of normal breast tissues from reduction mammoplasty patients with phenotype permutation (obese vs normal-weight, n=46). (A) Enrichment plot of the genomic profile for human peripheral blood monocytes (27 genes). (B) Enrichment plot of the genomic profile for human adipose tissue macrophage (21 genes). Detailed gene lists are shown in Supplementary Table 3.
Supplementary Figure 2. Representative pictures of breast adipose tissues of normal-weight patients.
Supplementary Table 1. The full gene list and direction of change for the genomic profile that is differentially expressed in normal breast tissue between obese and normal-weight reduction mammoplasty patients (760 genes: 203 genes up-regulated and 557 down-regulated. FDR<0.026).
Supplementary Table 2. Summary of the function analysisal of the obesity-associated signature based on the Ingenuity Pathways Analysis (IPA).
Supplementary Table 3. Genomic signatures of human peripheral monocytes and adipose tissue macrophages adapted from Du et al. (2006) and Klimcakova et al. (2011), respectively (ref. 23 and 24), including all genes in each of these published lists that mapped to data from the reduction mammoplasty specimens on 4X44K Agilent microarrays.