Abstract
This paper details an algorithm to simultaneously perform registration of computed tomography (CT) and cone-beam computed (CBCT) images, and image enhancement of CBCT. The algorithm employs a viscous fluid model which naturally incorporates two components: a similarity measure for registration and an intensity correction term for image enhancement. Incorporating an intensity correction term improves the registration results. Furthermore, applying the image enhancement term to CBCT imagery leads to an intensity corrected CBCT with better image quality. To achieve minimal processing time, the algorithm is implemented on a graphic processing unit (GPU) platform. The advantage of the simultaneous optimization strategy is quantitatively validated and discussed using a synthetic example. The effectiveness of the proposed algorithm is then illustrated using six patient datasets, three head-and-neck datasets and three prostate datasets.
Keywords: Deformable image registration, Multimodal registration, Mutual information, Shading correction, Scatter removal
1. Introduction
Cancer radiotherapy aims to deliver a prescribed radiation dose to a cancerous target region while sparing surrounding critical structures and normal tissues. Conventional cancer radiation therapy designs a treatment plan based on a snapshot of the patient’s anatomy, such as the snapshot obtained from CT, and uses the treatment plan for the entire treatment course minimal to no replanning. However, a patient’s body is a dynamically evolving system. The inter-fractional variation of a patient’s geometry during a long treatment course may seriously compromise the plan’s quality. To overcome this disadvantage, adaptive radiation therapy (ART) has been proposed (Yan et al., 1997; Wu et al., 2002; Birkner et al., 2003). ART seeks to redesign the treatment plan based on a patient’s evolving anatomy, acquired through daily in-room imaging modalities (e.g., CBCT), and hence maintain optimality of the updated plan. In such a process, manual delineation of cancerous target and organs at risk on a daily CBCT replanning regimen is impractical because of its labor intensive nature. Automatic structure delineation utilizing deformable image registration (DIR) has been proposed as a feasible auto-segmentation approach given the initial organ segmentations available from the planning CT (Chao et al., 2008; Samant et al., 2008; Xie et al., 2008; Godley et al., 2009; Paquin et al., 2009). Treatment plans can conveniently transfer the organ contours from the planing CT to CBCT by establishing voxel correspondences between the initial planning CT image and newly acquired CBCT imagery.
Current clinical practice mainly utilizes CBCT for the purpose of treatment setup, i.e. to position the patient in the same way that the CT was taken. There are more demanding applications, such as tumor contouring, electron density conversion and dose calculation (Hatton et al., 2009), that require high-quality CBCT images with accurate CT numbers. However the shading artifacts in CBCT images, as a result of scattered radiation and beam hardening effects, produce errors in CT numbers and lead to object contrast loss (Niu and Zhu, 2011). Many shading or scatter correction algorithms for CBCT have been proposed. Among the literature (Colijn and Beekman, 2004; Zhu et al., 2006; Star-Lack et al., 2009; Niu and Zhu, 2010), a relative simple idea is to warp CT to match the anatomical features in CBCT by DIR. Then the intensity of CBCT images can be corrected either in image space (Marchant et al., 2008) or in the projection space (Niu et al., 2010). However these approaches turn the CT-to-CBCT DIR and image enhancement of CBCT into a “chicken-and-egg” type of problem.
This paper proposes an algorithm that simultaneously performs the registration and CBCT enhancement. The registration algorithm relies on a viscous fluid model by D’Agostino et al. (2002), which offers the freedom to naturally incorporate an intensity correction term into the registration framework. We assume that the intensity difference between CT and CBCT after alignment is spatially smooth and thus regularize it with the H1 semi-norm. An iterative procedure alternates between updating the deformation fields to align CT and CBCT geometrically, and performing intensity fitting to photometrically match CBCT to CT. The additional intensity fitting term improves the registration results. The proposed algorithm is implemented on a graphics processing unit (GPU) to accelerate this computationally heavy task.
The remainder of this paper is organized as follows. The overview of image registration methods is present in Section 2. Section 3 is devoted to the joint registration and image enhancement model and its iterative equations. Section 4 presents the results of our algorithm on one synthetic example in order to demonstrate the presumed benefits of the joint optimization. Furthermore, six representative CT/CBCT datasets of head-and-neck data and prostate data are registered and enhanced. Conclusions and discussions are provided in the final section.
2. Image registration
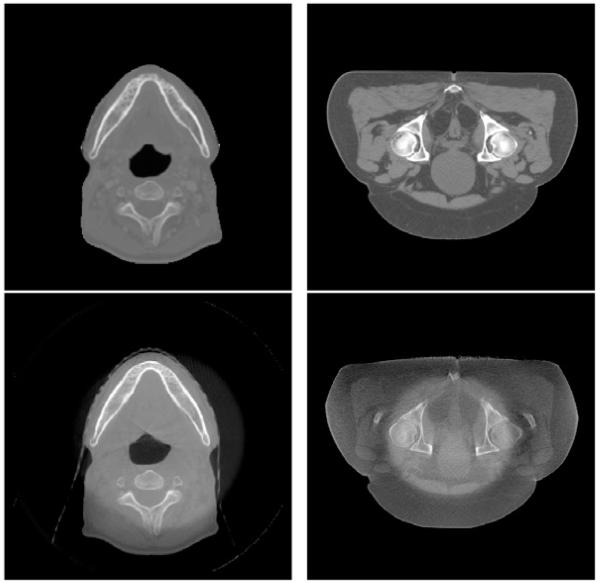
Deformable image registration between CT and CBCT is a challenging problem. One may consider it as an image registration problem between mono-modal images (Horn and Schunck, 1981; Thirion, 1998; Vercauteren et al., 2009; Gu et al., 2010). However, the conventional strategy of using sum-of-squared-differences (SSD) of intensity values between two images as a similarity measure performs poorly, or may even fail, since corresponding points in CT and CBCT do not necessarily attain the same intensity value. One way to circumvent this intensity inconsistency issue is to include an intensity calibration step. For example, Hou et al. (2011) utilize histogram matching to unify the CT and CBCT intensities, followed by application of the Demons algorithm (Thirion, 1998) which is designed for mono-modal registration. A more sophisticated intensity correction method present by Guimond et al. (2001) considers a polynomial relationship of the intensity correspondences between CT and CBCT images. A modification of polynomial intensity correction is made in (Ou and Chefd’Hotel, 2009). The work of Nithiananthan et al. (2011) integrates a tissue-specific intensity correction technique into the registration process, with subsequent application of the Demons algorithm. In a similar topic of aligning an atlas to the image space of magnetic resonance images (Pohl et al., 2005), a set of structure-dependent registration parameters are estimated simultaneously with classification and intensity correction in a statistical framework. However, the relationship between CT and CBCT is neither intensity-dependent nor material-dependent. In Fig. 1, the ring-shaped shadows of two CBCT images in axial view indicate that the intensity difference between CT and CBCT largely depends on the pixel location, which makes the aforementioned approaches sub-optimal.
Fig. 1.
Examples of CT (top) and CBCT (bottom) images in axial view.
An alternative perspective regards CT–CBCT registration as a special case of multimodal registration. In a multimodal scenario, some similarity measures are available, such as correlation ratio (Roche et al., 1998), cross-correlation (Gonzales and Woods, 2002) and rank-correlation (Figl et al., 2010). In particular for CT–CBCT registration, there is a sizeable number of work using normalized cross-correlation (NCC), such as (Schreibmann et al., 2006; Yang et al., 2007; Greene et al., 2008, 2009; Lu et al., 2010, 2011). The underlying rationale of these methods is that the intensities of CT and CBCT are related by a linear transformation. However, in the contexts where severe artifacts presents in CBCT, e.g. those shown in Fig. 1, such relationship does not hold and hence NCC may not give satisfactory results. In more general multimodal registration scenario, mutual information (MI) is widely used. It relies on the intensity distributions of two images instead of their intensity values directly. Since the seminal work of Viola and Wells (1997) and independently of Maes et al. (1997), many approaches are based on MI-inspired similarity measures. Please refer to the survey paper by Pluim et al. (2003) and more recent works (Razlighi et al., 2009; Yi and Soatto, 2009; Loeckx et al., 2010; Chappelow et al., 2011). One drawback of MI is the tendency to disregard local consistency in order to match the two intensity distributions globally.
On the assumption that one source of intensity differences between CT and CBCT is a result of slow, or smooth, spatial variation, we propose a similarity measure that is a linear combination of both MI and SSD. The latter similarity score is to account for local information and will also be augmented to perform intensity correction. Furthermore, to enforce the spatial smoothness, the intensity correcting SSD score will be regularized with the H1 semi-norm. We apply the intensity correction term to the CBCT, in essence matching the CBCT to the deformed CT photometrically. A similar approach of intensity correction is examined by Myronenko and Song (2010). There, the registration is formulated in the mono-modality setting. We find that including both MI and SSD is helpful to register CT and CBCT, with the intensity correction of CBCT strengthening the registration results.
3. Our method
We denote a given CT image by and the corresponding CBCT image by . The goal of deformable image registration, defined here, is to compute a geometric transformation mapping the points in I2 onto the corresponding set of points in I1. The choice of applying the transformation to the CT imagery arises from the fact that CT has better image quality than CBCT. Therefore, deforming CT to match CBCT should cause less interpolation errors than the other way around. The deformed, or registered, CT image will be denoted by .
The goal of image enhancement is to estimate an intensity correction term such that and are as close as possible. The intensity corrected image, denoted by , should have better image quality than . Note that the shadow areas in Fig. 1 make discrimination difficult. It is reasonable to assume that is globally smooth, as the CBCT contaminations caused by scatter and bowtie-filter are spatially smooth. Thus, given the input pair of images (I1; I2), the goal of our algorithm is to output another pair of images, which are the geometrically aligned image and the intensity corrected image . The typical approach to computing the transformation and intensity correction relies on establishing a similarity measure to quantify how close the two input image volumes are to each other. Next, the transformations and that maximize the similarity are computed through an optimization process. The remainder of this section details our joint algorithm.
3.1. Similarity measure
Mutual information (MI), when used as a similarity measure, is computed from the joint histogram of two images. Under such a similarity model, the less dispersed the joint histogram is, the better the two images are aligned (Pluim et al., 2003). The definition of the MI between I1 and I2, given the transformation , is:
| (1) |
where is the joint histogram of the deformed image and the target image . The joint histogram is computable using a 2D Parzen window to approximate the δ function in the overlap region V,
| (2) |
The marginal distributions and p(i2) in (1) are the probability density distributions of and , respectively. The arguments i1 and i2 range over the image intensity values.
MI measures the similarity between two images using global statistical properties from the entire image domain. Accordingly, MI tends to disregard strong neighborhood information in an attempt to increase the overall image similarity, thus producing significant local errors in the estimated transformation. Considering that the image modalities between CT and CBCT are not drastically different, we include the L2 distance between and I2 + a in the similarity measure. The purpose of this inclusion is to incorporate information regarding local intensity matching to guide the registration process. Incorporation of the two objectives is performed through a convex combination of their associated similarity scores plus a regularizing term, arriving at the objective function to be minimized,
| (3) |
where 0 ≤ λ ≤ 1. Notice that the parameter λ should be chosen carefully to control the relative weights between the first two terms, as SSD and MI are usually at different orders of magnitude.
Ignoring the contributions of the intensity correction term a, the model reduces to the intensity-based model for mono-modality registration with λ = 1, while it becomes the MI-based multimodal DIR model at λ = 0. is a regularization term with respect to the intensity correction a. Without the regularization, i.e., μ = 0, there would be too much freedom for a and the registration results would be unreliable due to overfitting of the intensity values. The regularization term is chosen as the H1 semi-norm to ensure global smoothness of a. The smoothness of the vector field is not explicitly modeled in the objective function, but is inherently modeled in a viscous fluid model.
3.2. A viscous fluid model for optimizing
We adopt a viscous fluid model (D’Agostino et al., 2002) to compute the optimal deformation. The model assumes that the deformation is governed by the Navier–Stokes equation of viscous fluid motion. Mathematically, it is expressed as
| (4) |
The deformation velocity is related to by
where is the Jacobian of with respect to the coordinates . The vector function is a force field that drives the deformation in the appropriate direction.
This viscous fluid approach can easily take into account the intensity correction through the force field. In fact, the objective function and the force term are related. Taking the variation of E with respect to gives the expression for the force term , that is,
| (5) |
where is the variation of (1) with respect to ,
| (6) |
To numerically solve the Navier–Stokes equation (4), successive over-relaxation (SOR) is typically applied as in Christensen et al. (1996), which is computationally expensive. A filter-based method is derived by Bro-Nielsen and Gramkow (1996) on account of the Greens function as a fundamental solution to the fluid equation. In particular, the velocity field is obtained by a convolution filter applied to each component of the force field , i.e., , where Φs is the 3D Gaussian kernel with width s (in voxels)
3.3. Algorithm
Implementation of the optimization algorithm requires for the associated PDEs to be discretized. With regards to , at each iteration k, the deformation field is updated by
| (7) |
| (8) |
| (9) |
where and the time step δt is chosen adaptively for each iteration through
| (10) |
with δu equal to the maximal voxel displacement allowed in one iteration.
To preserve the topology of the deformed template, re-gridding is performed whenever there exists such that the Jacobian of reaches below a positive threshold (e.g., 0.5). As long as the determinant of Jacobian is larger than this pre-determined value, the deformation field is guaranteed to be invertible, and thus the topology is preserved. Re-gridding is performed in a way that the current deformed image is set to be a new template and the incremental deformation field to be zero. The total deformation is the composition of the incremental deformation fields associated with each propagated template.
To simultaneously optimize the intensity correction, we adopt a gradient-descent method with regards to optimization of a. In particular, computing the gradient flow to minimize the energy (3) with respect to a leads to the following PDE,
| (11) |
The fitting term a and the deformation field are coupled in an alternating manner. For each k, we use ak as initial value and evolve this PDE for several iterations to get ak+1. A semi-implicit discretization scheme is used to make the algorithm stable. The update on a improves the L2 distance, e.g., the intensity matching, between the two images as part of the similarity measure. The improved intensity matching smoothly aligns the support of the two image distributions and p(i2), thus aiding the registration process.
Furthermore, we employ a multi-resolution scheme to increase speed and robustness. Specifically, we construct an image pyramid by down-sampling the images by a factor of two in each dimension. We then perform registration at the level of a low-resolution grid. The deformation field obtained at the low resolution level is then interpolated to become the initial conditions for the higher-resolution computation.
Lastly, we have implemented our algorithm on the GPU. Registration of volumetric data in medical image processing is a computationally intensive task. Computational time is a critical factor that limits the adoption and applications of registration in clinical practice. As the structure of image registration algorithms is compatible with GPU compute architecture, a range of DIR algorithms have been developed on the GPU (Sharp et al., 2007; ur Rehman et al., 2007; Samant et al., 2008; Muyan-Ozcelik et al., 2008; Gu et al., 2010). The papers (Shams et al., 2010; Fluck et al., 2010) survey GPU implementations of DIR.
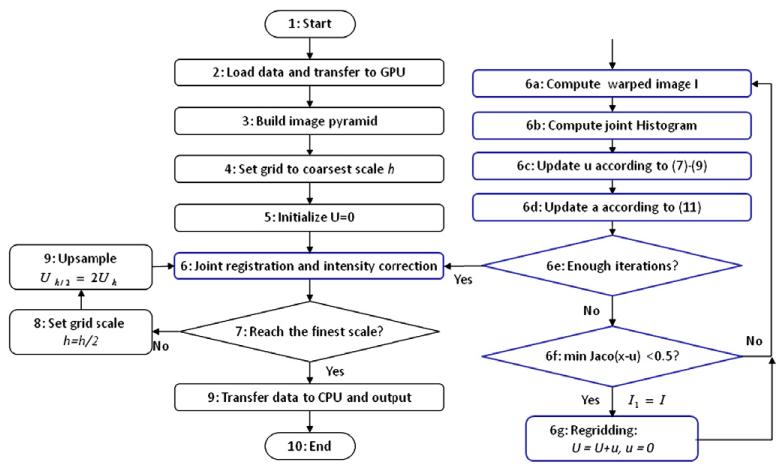
In summary, a flow chart in Fig. 2 illustrates our joint registration and intensity correction algorithm.
Fig. 2.
The flow chart of our joint registration and intensity correction algorithm. The details of step 6 in the blue box are provided on the right.
4. Experiments
We provide experiments to demonstrate (1) the linear combination of two similarity measures outperforms any individual, (2) efficiency and robustness of the proposed method for both multimodal deformable registration and intensity correction on one synthetic example and six real patient datasets and (3) the influence of parameters. For image registration, we compare the linear combination of SSD and MI with SSD only, MI only, cross-correlation (CC) and residual complexity (RC) as in the recent work of Myronenko and Song (2010). For intensity correction, we compare with the state-of-the-art scatter removal method (Niu et al., 2012) in CBCT imaging.
4.1. Synthetic dataset
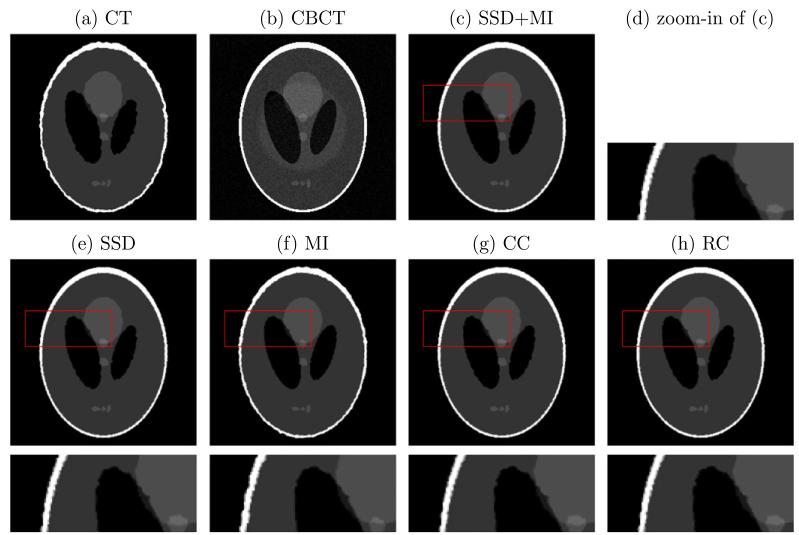
We synthesize a CT image by imposing smooth deformation flows with maximal displacement d on the Shepp-Logan phantom, while the CBCT image is created by adding a round-shape shadow and Gaussian white noise with standard deviation s to the phantom. The simulated CT and CBCT images are illustrated in Fig. 3a and b. Our proposed method, the combination of SSD and MI, is compared with the methods using SSD only, MI only, CC and RC. CC assumes a linear relationship between two image modalities, while RC is formulated in a mono-modal setting. Therefore, CC and RC perform similar to SSD in this case. MI, as a similarity measure for multi-modal registration, has two noticeable deficiencies in registration: the boundaries are not as sharp nor as uniform as they should be (such as for the white outer region), and the small center element has lost some of its area to the larger circle near it. This is because these regions are indeed mono-modal in nature. On the other hand, MI performs better than SSD, CC and RC on the region of left black oval, where the intensities of two images are significant different and not related by a linear function. The combination of SSD and MI has the benefits of both methods while mitigating the drawbacks of using single of them.
Fig. 3.
Synthetic example of a pair of CT and CBCT images. Our method, SSD + MI, is compared with methods with SSD only, MI only, CC and RC (Myronenko and Song, 2010). The last row is the zoom-in part of the corresponding results on the second row.
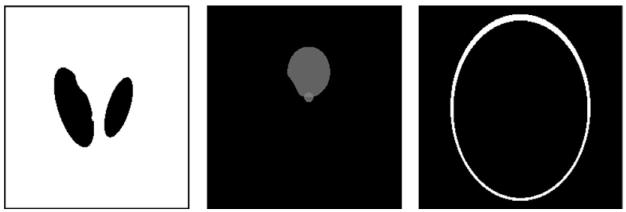
To quantitatively compare the accuracy of these registration methods, percentage of false positives (PFP),
is evaluated, where A denotes the ground truth, B is the deformed region and |·| computes the cardinality of each set. Table 1 lists the PFP of three particular regions, as illustrated in Fig. 4. The deformed regions are computed using various similarity measures, i.e., SSD + MI, SSD, MI, CC and RC, under different maximal displacement d and noise level s. SSD, CC and RC are all better than MI if PFP is computed on the white region, where these similarity measures provide a stronger force than MI to deform one image towards the other. On the gray or black regions, the MI registered image is a stronger performer than those are registered by the other similarity measures. As indicated by Table 1, the combined SSD + MI approach is not the best in each case, but it has a better overall performance.
Table 1.
PFP (%) of three particular regions. Means of 10 random realizations are reported in each case. Numbers in bold are the best values in each case.
| SSD + MI | SSD | MI | CC | RC | |
|---|---|---|---|---|---|
| s = 8, d = 5 | |||||
| Black | 0.2319 | 0.3578 | 0.1879 | 0.2698 | 0.3738 |
| Gray | 0.4441 | 1.1818 | 0.2221 | 0.7979 | 0.4817 |
| White | 0.4779 | 0.5798 | 12.2347 | 0.6008 | 0.2706 |
| s = 8, d= 7 | |||||
| Black | 0.3558 | 0.2918 | 0.0560 | 0.2978 | 0.4997 |
| Gray | 0.9221 | 1.7125 | 0.3049 | 1.2382 | 1.0011 |
| White | 0.6360 | 0.7573 | 17.1609 | 0.3022 | 0.7219 |
| s= 15, d = 5 | |||||
| Black | 0.1399 | 0.1879 | 0.0500 | 0.1919 | 0.3118 |
| Gray | 0.3263 | 0.9936 | 0.1957 | 0.6473 | 0.3437 |
| White | 0.2249 | 0.3865 | 8.2256 | 0.3619 | 0.1335 |
| s=15, d=7 | |||||
| Black | 0.4597 | 0.5197 | 0.1179 | 0.4977 | 0.7096 |
| Gray | 1.0312 | 1.7840 | 0.5645 | 1.2947 | 0.9597 |
| White | 0.5306 | 0.5973 | 15.2249 | 0.4392 | 1.0892 |
Fig. 4.
Regions of interest: black, gray and white, on which PFP is computed.
4.2. Patient datasets
Our algorithm is applied to- and validated on- six patient cases (three head-and-neck datasets and three prostate datasets). Table 2 lists dimension and voxel resolution of each dataset along with the computational time using GPU. For head-and-neck (A) and (B), prostate (A), the patients were first scanned in a 4-slice GE Light-Speed RT scanner (GE Healthcare, Milwaukee, WI) for treatment plan purposes and then in the on-board imager system on a Varian Trilogy linear accelerator (Varian Medical System, Palo Alto, CA) before each treatment. For head-and-neck (C), prostate (B) and (C), the planning CT scans were taken on a 16-slice Philips Brilliance Big Bore CT simulator (Philips Healthcare Systems, Andover, MA) with the helix scan mode. The CBCT scans were performed on the patients at treatment time using the on-board imager system installed on the Varian Clinac 23IX radiation therapy machine (Varian Medical System, Palo Alto, CA). We first perform a rigid registration so that CT and CBCT have same orientation and voxel size. With the high computing power of a GPU and the carefully designed algorithmic structure tailored for this platform, it only takes 48 s to register a pair of images with size 512 × 512 × 150. The time is reduced to 25 s if no intensity correction is included. Incorporation of intensity correction nearly doubles the computational time. This phenomenon is expected since the degrees of freedom (DOF) of the function a is on the order of the number of voxels in the images. The large DOF consumes more memory and increases the computational cost of the algorithm.
Table 2.
Dataset description (dimension and voxel resolution in mm3) and computational time using GPU.
| Datasets | Dimension | Voxel size (mm3) | Time (s) | ||||
|---|---|---|---|---|---|---|---|
| Head-and-neck (A) | 256 | 256 | 68 | 0.9766 | 0.9766 | 2.5 | 5.424 |
| Head-and-neck (B) | 512 | 512 | 70 | 0.9766 | 0.9766 | 2.5 | 18.739 |
| Head-and-neck (C) | 256 | 256 | 76 | 1.0449 | 1.0449 | 3 | 5.619 |
| Prostate (A) | 512 | 512 | 80 | 0.9082 | 0.9082 | 1.9897 | 19.464 |
| Prostate (B) | 512 | 512 | 150 | 0.9766 | 0.9766 | 0.9766 | 47.994 |
| Prostate (C) | 256 | 256 | 134 | 1.9532 | 1.9532 | 0.9766 | 10.059 |
In order to quantitatively evaluate registration performance, we asked a physicist to manually delineate some organs in both CT and CBCT images. In particular, the left parotid from the head- and-neck (C) and the bladder from the prostate (A) are examined. In CT–CBCT registration, one wants to deform CT to match CBCT geometrically. Therefore, the label map of an organ in CBCT image can be regarded as ground-truth. After applying deformation field to the label map of the same organ in CT image, PFP of two label maps is computed. Table 3 demonstrates that the linear combination of SSD and MI is better than using SSD or MI only. Notice that in Table 3 PFP of prostate (A) is much smaller than the one of head- and-neck (C) since the bladder has smaller motion than parotid.
Table 3.
PFP (%) of the label map of an organ delineated by a physicist in CBCT image and the deformed label map of the same organ in CT image by applying deformation field produced by various similarity measures: none (meaning original CT image), SSD, MI and SSD + MI. Notice that PFP of prostate (A) is much smaller than the one of head-and-neck (C) since the bladder has smaller motion than parotid. Numbers in bold are the best values in each case.
| Datasets | None | SSD | MI | SSD + MI |
|---|---|---|---|---|
| Head-and-neck (C) | 44.1417 | 36.9210 | 34.4687 | 34.1144 |
| Prostate (A) | 9.3537 | 9.3402 | 9.3452 | 9.2919 |
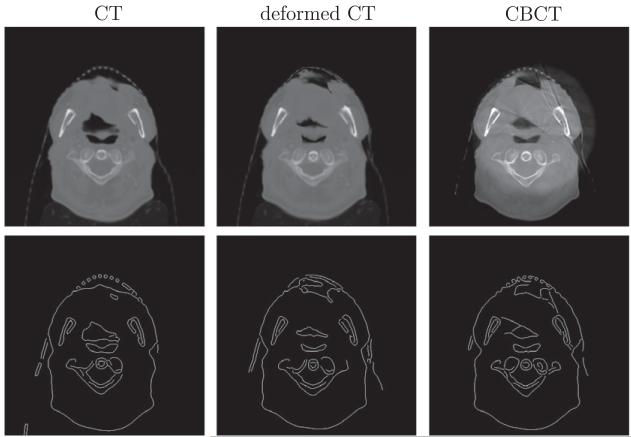
As exact ground-truth is not always available in real data, we compare registration algorithms using edge maps. Let B, C be two 3D volumetric images. We first apply a Canny edge detection algorithm on every 2D axial slice of B and C. Let K be the third dimension of the volumetric data. This implies Canny edge detection is applied K times, each producing Bk, Ck for k = 1, … , K. We define an error percentage (EP) of two images B and C as follows,
EP measures the percentage of the number of mismatched pixels between the edge maps of CBCT and the warped CT by certain registration algorithm. A smaller EP implies a better result of this registration algorithm. We compare SSD + MI with similarity measures, MI only, CC and RC, in terms of EP in Table 4. The achieved smallest value in each case in our method indicated the improved registration accuracy from the aspect of EP. As shown in Fig. 5, Canny edge detection has some defects, such as not getting consistent yet correct edge maps among corresponding slices. The error percentage based on edge maps results in a heuristic comparison between two images.
Table 4.
The error percentage (%) of two edges maps produced by Canny edge detection on original CBCT image and warped CT image by various similarity measures: none (meaning original CT image), SSD + MI, MI only, CC and RC. Numbers in bold are the best values for each case.
| Datasets | None | SSD + MI | MI | CC | RC |
|---|---|---|---|---|---|
| Head-and-neck (A) | 2.93 | 1.93 | 2.19 | 2.14 | 2.26 |
| Head-and-neck (B) | 2.29 | 2.07 | 2.25 | 2.12 | 2.08 |
| Head-and-neck (C) | 2.39 | 1.52 | 1.81 | 1.77 | 1.68 |
| Prostate (A) | 1.21 | 0.47 | 0.50 | 0.54 | 1.06 |
| Prostate (B) | 1.89 | 1.18 | 1.50 | 1.83 | 1.74 |
| Prostate (C) | 3.27 | 2.37 | 2.45 | 2.79 | 2.69 |
Fig. 5.
Canny edge detection of CT, deformed CT and CBCT images.
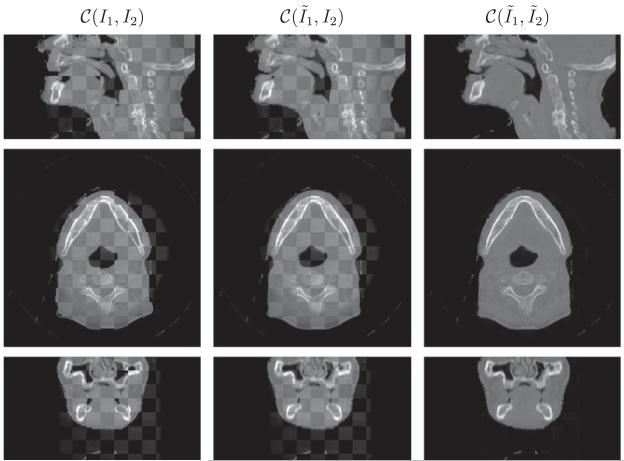
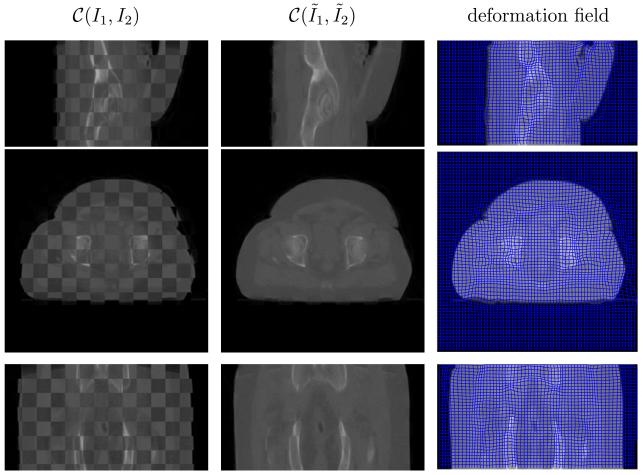
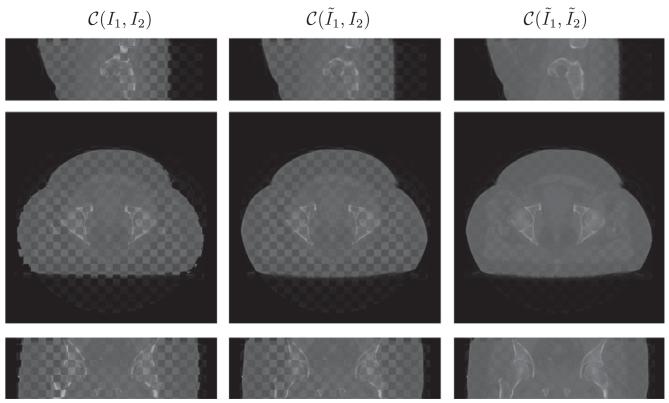
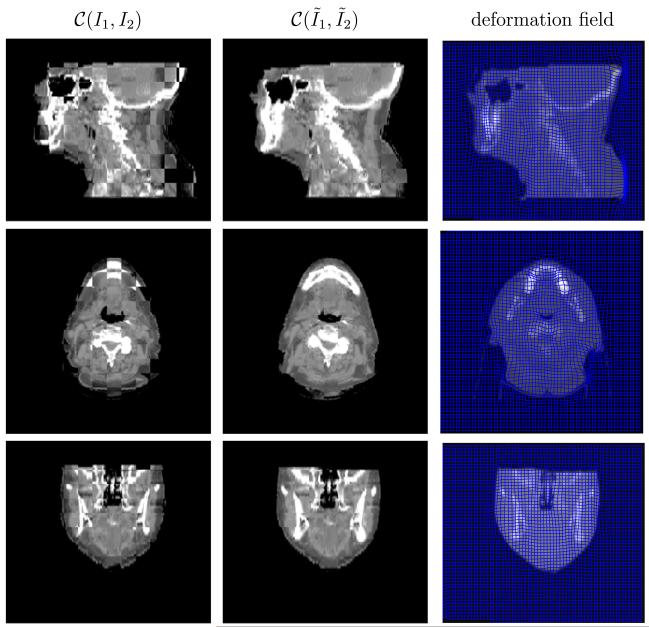
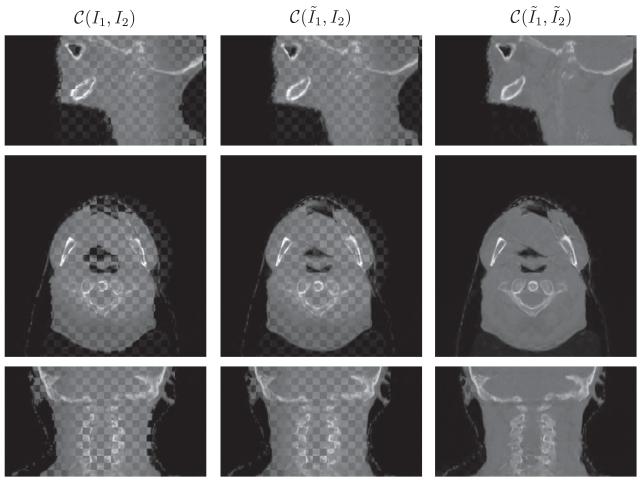
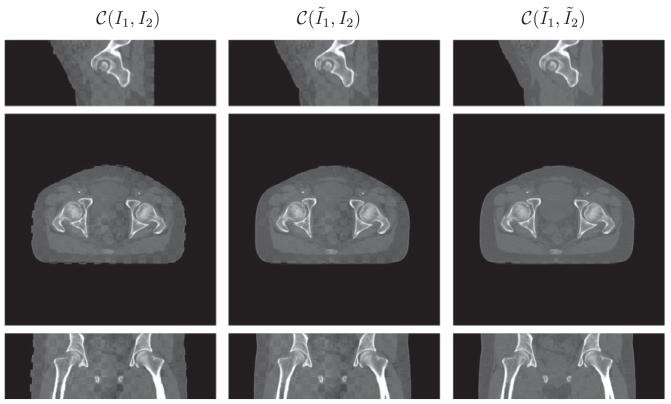
Visually a checkerboard display technique serves to demonstrate the performance of the joint registration and intensity correction algorithm. In this technique, two images to be compared are merged together in a checkerboard pattern, where black regions are filled by the first image and the white regions are filled the second. This display method highlights the mismatch between anatomical structures in the two images at the transition zone. Ideally, when two images are fully aligned, there is little to no difference at the boundaries between checkerboard squares. Misalignment and miscorrection of intensity will result in discontinuities along edges and enhance perception of the checkerboard pattern, respectively. We use the notation C(I1, I2) for the checker-board fusion of images I1 and I2.
Figs. 6-11 show the sagittal, axial and coronal views of all patient datasets before and after our algorithm is applied. Our algorithm takes the input images I1 (CT) and I2 (CBCT) and outputs the deformed CT image and intensity corrected CBCT image . The middle column in Figs. 6-9 is to compare the deformed CT to the original CBCT, which validates that our algorithm works in the geometrical alignment of features between two images, and not simply to match intensity. In Fig. 10 and 11, we also plot deformation fields overlaid on deformed CT images.
Fig. 6.
Performance on head-and-neck (A) in the checkerboard display. From top to bottom is the sagittal, axial and coronal view respectively. The results are resized in superior–interior direction corresponding to the physical space. The anatomical features such as jaw and spine aligned and the CBCT is similar in appearance to the CT.
Fig. 11.
Performance on prostate (C) in the checkerboard display. The last column plots the deformation field overlaid on the deformed CT image. From top to bottom is the sagittal, axial and coronal view respectively.
Fig. 9.
Performance on prostate (B) dataset in the checkerboard display. From top to bottom is the sagittal, axial and coronal view respectively.
Fig. 10.
Performance on head-and-neck (C) in the checkerboard display. The last column plots the deformation field overlaid on the deformed CT image. From top to bottom is the sagittal, axial and coronal view respectively. The results are resized in superior-interior direction corresponding to the physical space.
As for three head-and-neck datasets, the anatomical features, such as jaw and spine, align. Notice that we resize the results in superior-interior direction corresponding to the physical space, which results in interpolation errors in sagittal and coronal views, especially in the region of spines as in Fig. 7. Furthermore, the CBCT has the same contrast as CT given the lack of intensity differences in the checkerboard display. There is a small region in the sagittal view of Fig. 6 where CT and CBCT do not match. The patient opens mouth during the CT scan, and closes during the CBCT scan. Consequently, CT and CBCT may have different topological characteristics around the mouth. The assumption of diffeomorphic deformation flow is invalid in the region where topology changes. It is difficult to design registration algorithms that can handle topological changes. This is the future direction we would like to pursue.
Fig. 7.
Performance on head-and-neck (B) in the checkerboard display. From top to bottom is the sagittal, axial and coronal view respectively. The results are resized in superior-interior direction corresponding to the physical space. Interpolation errors exists in the sagittal and coronal view, especially in the region of spine.
4.3. Intensity correction/scatter removal
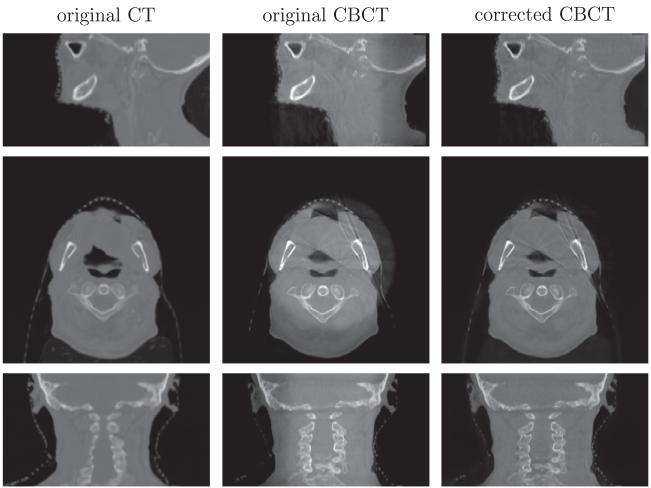
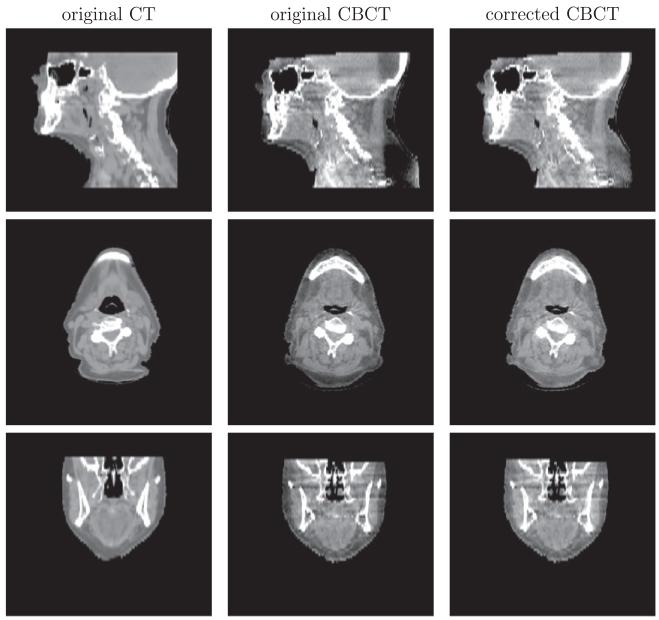
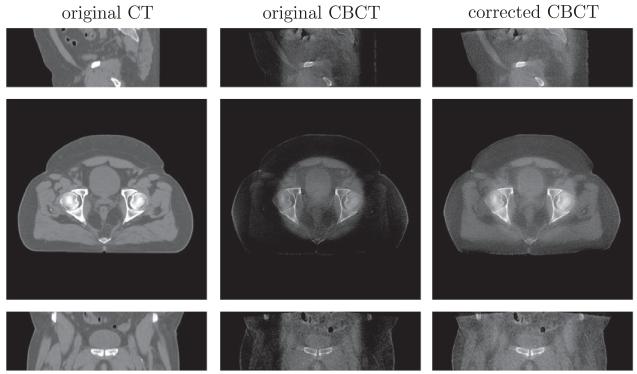
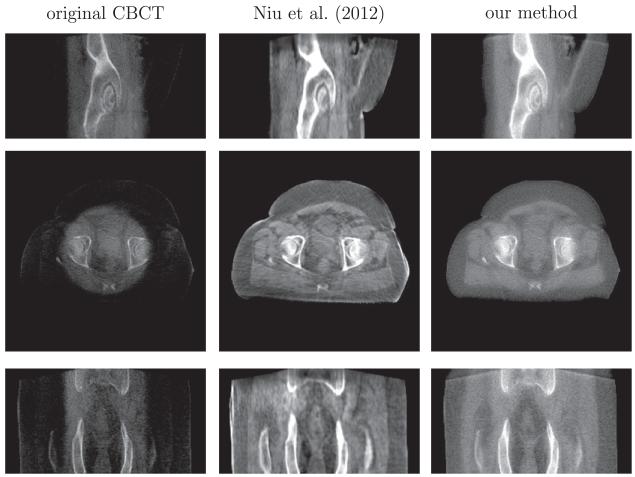
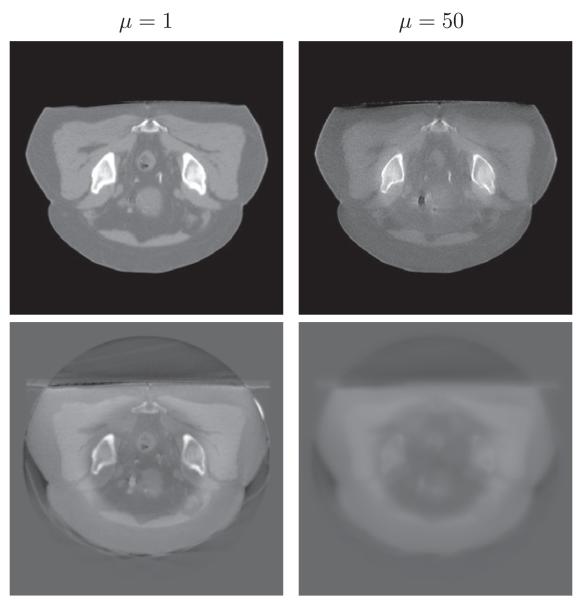
We demonstrate the intensity correction or scatter removal part of our algorithm. For two head-and-neck datasets (B) and (C) in Figs. 12 and 13, the intensity of shoulder regions is recovered after correction. Two prostate datasets (A) and (B), shown in Figs. 14 and 15, are more challenging for intensity correction, as their CBCT images contain a large amount of noise. The corrected CBCT is the sum of the original CBCT and an intensity correction term . If is smooth, then the noise in the original CBCT image will cause the output CBCT to be noisy. On the other hand, we can tune parameter μ so that the correction term is less smooth. But this approach will lead to intensity overfitting in the sense that the corrected CBCT images are heavily biased towards the CT images. Please refer to the discussion on parameter μ in Section 4.4 for more details. Our algorithm enables the corrected CBCT image to have the similar contrast to the CT image, while also removing the shadow. Notice that noise still prevails in the corrected CBCT images. Denoising is beyond the scope of this paper and will be explored in the future.
Fig. 12.
Intensity correction performance on head-and-neck dataset (B). From top to bottom is the sagittal, axial and coronal view respectively.
Fig. 13.
Intensity correction performance on head-and-neck dataset (C). From top to bottom is the sagittal, axial and coronal view respectively. The intensity of the shoulder region is recovered after correction.
Fig. 14.
Intensity correction performance on prostate (A) dataset. From top to bottom is the sagittal, axial and coronal view respectively. Display contrast: [ −400 500] Hounsfield unit (HU).
Fig. 15.
The comparison of scatter removal on prostate (B) dataset between our method and the recent work of Niu et al., 2012. From top to bottom is the sagittal, axial and coronal view respectively. Display contrast: [−400 500] HU. Niu’s method gives a high-contrast image, but it contains streaking artifacts and the sacrum in the coronal view is corrupted and incomplete due to the truncation errors in the forward projection.
In Fig. 15, we also compare our method with the state-of–theart scatter removal method (Niu et al., 2012). This approach registers the CT to the CBCT image, and hence primary signals in CBCT scan can be estimated via forward projection on the CT image. The shadow in the axial view, caused by the scatter signals, can be removed using the low-pass filter on the difference between the estimated and the raw CBCT projections. However, the residual scatter and increased noise after scatter correction result in streaking artifacts as shown in the middle column of Fig. 15. Also the truncation errors in the projection yield the sacrum corrupted and incomplete in the coronal view of their reconstruction.
4.4. Discussion on parameters
We have two parameters in the algorithm. λ is a weighting factor in the linear combination of SSD and MI, while μ balances between the similarity measure and the intensity fitting. This section is devoted to discussion on the influence of these two parameters on our algorithm.
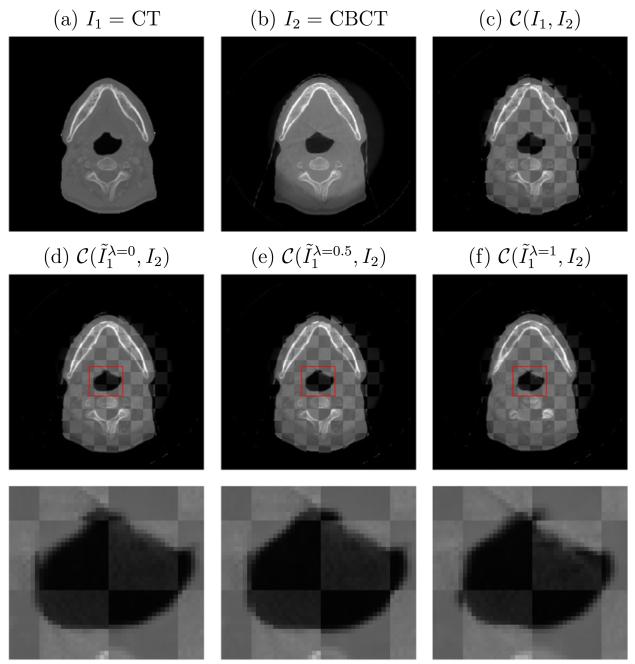
We first compare our algorithm for different values of parameter λ in (3) without incorporation of the intensity correction term (and its associated smoothing cost). The case λ = 0 corresponds to a MI-based multimodal DIR model and the case λ = 1 corresponds to an intensity-based algorithm for mono-modality registration. The value of λ is indicated in the superscript of the output registered image in Fig. 16. The combination of SSD and MI outperforms using them individually. Ideally the optimal λ is chosen according to the difference of histograms of CT and CBCT images. In practice, we find our algorithm is not sensitive for λ ∈ (0, 1) when we rescale the image intensities of CT and CBCT to be [0, 1] so that SSD and MI to have the same magnitude.
Fig. 16.
Influence of the parameter λ in (3) on registration performance. Its value is indicated in the superscript of the output registered image , in which (d) and (f) correspond to a MI-based multimodal DIR model (λ = 0) and an intensity-based registration method (λ = 1) respectively. Our joint algorithm with λ = 0.5 in (e) outperforms both other cases, especially in terms of completing the triangle region as zoomed-in below.
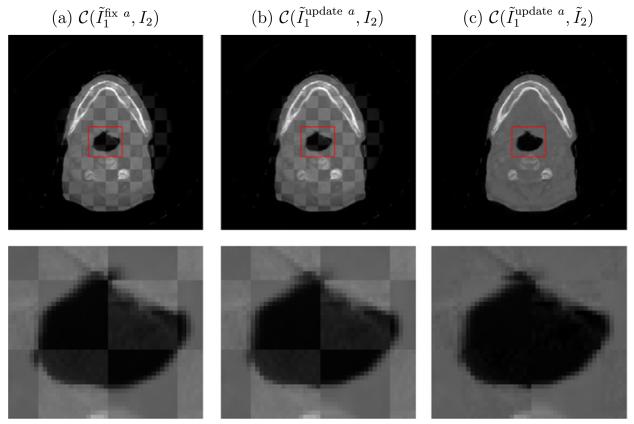
In order for the L2 distance in the energy (3) to provide sensible output, it is better to update the intensity correction function a iteratively in (11). To demonstrate the role of a and its optimization, we consider three cases as follows. In Fig. 17a, the correction is fixed a = 0 and not updated. In Fig. 17b, the correction is updated but not applied in the checkerboard test. Lastly, in Fig. 17c the correction is updated and applied in the checkerboard test. Comparing the left two columns, we find that iterative correction of a assists with the registration. Edge continuity is improved for the intensity corrected iterations (top part of zoomed in center region). The bright region of the upper image (in the top row) also has sharper edges for the intensity corrected version. Both of these observations validate that our algorithm works to align the geometrical features between two images, and not simply to match intensity. Moving to the right-most column, which applies the intensity correction, it is clear that the two images have been properly transformed to match. Edges are continuous and intensity variation is smooth over uniform regions. These improvements demonstrate that intensity correction is important for both CBCT image enhancement and deformable CT–CBCT registration.
Fig. 17.
The iterative correction of function a is essential for CBCT image enhancement as in (c), but also helps with registration as in (b), when compared to the SSD + MI approach with no intensity correction (a). See text for further details.
In Fig. 18 we show the influence of the parameter μ in (3) on the performance of the intensity correction portion of our algorithm. Larger values of μ correspond to a stronger assumption of smooth-ness of the fitting term a. Smaller values of μ lead to intensity overfitting, in the sense that the corrected CBCT images are heavily biased towards the CT images. For example, in Fig. 18, there is a black hole in the center of the corrected CBCT image which inherits from the CT image, while the hole in the bottom left is completely removed from the original CBCT image. On the other hand, small μ yields better image quality of the reconstructed CBCT in consonance with CT. Therefore, there is a trade-off regarding how to choose the parameter μ. For all of our experiments, we use μ = 100.
Fig. 18.
The influence of μ on the performance of the intensity correction portion of our algorithm. The results of CBCT with different μ are shown on the top with the corresponding fitting function a shown on the bottom. The small value of μ results in a lot of image features appeared in the fitting function, and thus it would bring the features of CT to CBCT.
5. Conclusions and discussion
In this paper, we have presented an algorithm to simultaneously register CT to CBCT and enhance CBCT image quality. In particular, we combine the similarity measure for registration and the L2 distance for intensity correction into a viscous fluid model so that our algorithm can jointly achieve two goals. As for the registration cost functions, SSD is better in mono-modality, while MI is better in multi-modality. We use a linear combination of the two cost functions for the proposed similarity measure, which is better than using single one of them to register CT and CBCT. In order to make SSD a reasonable metric, CBCT intensity is updated according to the deformed CT image, which in turn helps to improve the registration results. Our algorithm is implemented on the GPU, which only takes 45 s to register a pair of 512 × 512 × 150 images.
Before the end of this paper, we would like to provide discussions on a set of relevant issues that could be of interest to readers.
First of all, our work aims at solving the registration problem between a CT image and a CBCT image contaminated by severe artifacts caused by e.g. scatter and bowtie filter. While improved registration results are obtained over other competing methods, the significance of our method depends on the severity of these artifacts in clinical practice. In fact, with the rapid advances in CBCT technologies over the past few years, artifacts of these kinds have been mitigated to a large extent. We also believe that the ultimate solution to the CT–CBCT registration problem should be the improvement of CBCT image quality, so that the intensity inconsistency problem between these two modalities are negligible and conventional registration algorithms can robustly deliver accurate results. Nonetheless, at the current stage, there are a large number of old generations of CBCT machines used in current clinical practice, on which artifacts of our focus still exist to a certain level. The severity also varies depending on the CBCT technology on those machines and the satisfactory level of machine calibration and maintenance. The image artifacts from those machines largely hinder the use of CBCT for advanced clinical applications, e.g. adaptive radiotherapy. Before those old CBCT machines are replaced, our method offers a practical solution to conduct CT-CBCT registration and facilitate clinical tasks.
Second, it is also of interest to discuss the potential benefit of having the intensity modified CBCT image. Actually, the benefits rely on the accuracy of registration. Under ideal situation with perfect registration results, the deformed CT image will have correct anatomical structures as well as accurate CT numbers. Hence, current clinical practice in radiation therapy that relies on CT numbers, e.g., dose calculation on CBCT, can be conducted using the deformed CT image instead. In this regard, the intensity modified CBCT image does not provide much clinical benefit over the deformed CT image. However, the registration accuracy is not always satisfactory in practice. For instance, there could be mismatch of structures between the deformed CT and CBCT due to insufficient number of iterations or local minima of registration algorithms. The intensity corrected CBCT image will offer benefits in dose calculations than the uncorrected one, as the systematic CT number inaccuracy are eliminated to a certain extent. Yet, since it is required to convert the HU values to electron density before dose calculation in radiotherapy via a calibrated conversion curve, another possible approach without correcting CBCT HU values is to use a HU to electron density conversion curve that is calibrated against the original CBCT image with incorrect HU values. However the effectiveness of such a method depends on the type and the amount of artifacts. In some situations, e.g. when the ring artifact due to bow-tie appears, voxels with the same HU number in CT at the center or at the periphery of the image would attain different HU numbers in CBCT. The electron density cannot be correctly interpreted by a single conversion curve. Our method will attain its advantage over the approach of using a new conversion curve. However, given the fact that MeV beam dose calculation is not quite sensitive to small inaccuracy of electron density, whether or not a single electron density conversion curve can deliver sufficiently accurate dose calculation results in the presence of this ring artifact is subject to further investigation, especially when the ring artifacts are mild.
Last, but not least, we would like to point out that, although improved results have been observed over some competing methods, these improvements in this preliminary study are not conclusive and are subject to future investigations. Regarding the CBCT intensity correction, more quantitative studies are needed. Our model may also be adjusted to yield more accurate results. In fact, one key assumption of our method is the smoothness of the correction term a. Yet, in the high contrast regions, the correction term varies largely. Hence a single smoothness term regardless spatial locations may lead to oversmoothed correction term and make the correction insufficient. On the other hand, the improved registration accuracy is only demonstrated indirectly from a few measures, such as PFP. To rigorously demonstrate the accuracy, more investigations, e.g. comparing with manual landmarks, are needed.
There are also a few issues to be studied in future. First, SSD and MI are usually at different orders of magnitudes. This may cause difficulties when tuning the parameter λ. In this paper, we consider to normalize image intensity to [0,1] and we find empirically our algorithm is not sensitive to λ. An alternative is to use normalized similarity measures. For example, it is worth trying the combination of normalized cross-correlation and normalized mutual information in the future. Second, other forms of similarity metrics may be included in our model depending on the contexts. For instance, the aforementioned NCC could be used to replace the SSD term in our model, when a linear relationship between CT and CBCT intensities holds. Third, it is also desirable to design a parametric formula for the intensity correction term a. For example, inspired on the ring-shape shadow, a maybe a function of radius to the center. The parametric form of a could largely reduce its degree of freedom, and thus a higher computational efficiency can be achieved. The validation of the parametric description of a, however, requires further investigations.
Fig. 8.
Performance on prostate (A) in the checkerboard display. From top to bottom is the sagittal, axial and coronal view respectively.
Acknowledgments
This project was supported by grants from the National Center for Research Resources (P41-RR-013218) and the National Institute of Biomedical Imaging and Bioengineering (P41-EB-015902) of the National Institutes of Health. This work was also supported by the NIH grant R01 MH82918 as well as a grant from AFOSR. This work is part of the National Alliance for Medical Image Computing (NA-MIC), funded by the National Institutes of Health through the NIH Roadmap for Medical Research, Grant U54 EB005149. Dr. X. Jia would like to acknowledge the support from the Early Career Award from Thrasher Research Fund. Dr. T. Niu and Dr. L. Zhu are supported by Georgia Institute of Technology new faculty start-up funding and the NIH under the Grant No. 1R21EB012700-01A1. We thank NVIDIA for providing GPU cards on which this work is performed. Information on the National Centers for Biomedical Computing can be obtained from http://nihroadmap.nih.gov/bioinformatics.
References
- Birkner M, Yan D, Alber M, Liang J, Nusslin F. Adapting inverse planning to patient and organ geometrical variation, algorithm and implementation. Med. Phys. 2003;30:2822–2831. doi: 10.1118/1.1610751. [DOI] [PubMed] [Google Scholar]
- Bro-Nielsen M, Gramkow C. Fast fluid registration of medical images; Proceedings of the 4th International Conference on Visualization in Biomedical, Computing; 1996.pp. 267–276. [Google Scholar]
- Chao M, Xie YQ, Xing L. Auto-propagation of contours for adaptive prostate radiation therapy. Phys. Med. Biol. 2008;53:4533–4542. doi: 10.1088/0031-9155/53/17/005. [DOI] [PMC free article] [PubMed] [Google Scholar]
- Chappelow J, Bloch B, Rofsky N, Genega E, Lenkinski R, DeWolf W, Madabhushi A. Elastic registration of multimodal prostate MRI and histology via multiattribute combined mutual information. Med. Phys. 2011;38:2005–2018. doi: 10.1118/1.3560879. [DOI] [PMC free article] [PubMed] [Google Scholar]
- Christensen GE, Rabbitt RD, Miller MI. Deformable templates using large deformation kinetics. IEEE Trans. Image Process. 1996;5:1435–1447. doi: 10.1109/83.536892. [DOI] [PubMed] [Google Scholar]
- Colijn AP, Beekman F. Accelerated simulation of cone beam X-ray scatter projections. Trans. Med. Imag. 2004;23:584–590. doi: 10.1109/tmi.2004.825600. [DOI] [PubMed] [Google Scholar]
- D’Agostino E, Maes F, Vandermeulen D, Suetens P. A viscous fluid model for multimodal non-rigid image registration using mutual information. Med. Image Comput. Comput. Assist. Interv. (MICCAI) 2002:541–548. doi: 10.1016/s1361-8415(03)00039-2. [DOI] [PubMed] [Google Scholar]
- Figl M, Bloch C, Gendrin C, Weber C, Pawiro SA, Hummel J, Markelj P, Pernu F, Bergmann H, Birkfellner W. Efficient implementation of the rank correlation merit function for 2D/3D registration. Phys. Med. Biol. 2010;55:N465–71. doi: 10.1088/0031-9155/55/19/N01. [DOI] [PMC free article] [PubMed] [Google Scholar]
- Fluck O, Vetter C, Wein W, Kamen A, Preim B, Westermann R. A survey of medical image registration on graphics hardware. Computer Methods and Programs in Biomedicine. 2010 doi: 10.1016/j.cmpb.2010.10.009. [DOI] [PubMed] [Google Scholar]
- Godley A, Ahunbay E, Peng C, Li XA. Automated registration of large deformations for adaptive radiation therapy of prostate cancer. Med. Phys. 2009;36:1433–1441. doi: 10.1118/1.3095777. [DOI] [PubMed] [Google Scholar]
- Gonzales R, Woods R. Digital Image Processing. Prentice-Hall; 2002. [Google Scholar]
- Greene WH, Chelikani S, Purushothaman K, Chen Z, Knisely JP, Staib LH, Papademetris JP, Duncan JS. A constrained non-rigid registration for use in image-guided radiotherapy. Med. Image Comput. Comput. Assist. Interv. (MICCAI) 2008:780–788. doi: 10.1007/978-3-540-85988-8_93. [DOI] [PMC free article] [PubMed] [Google Scholar]
- Greene WH, Chelikani S, Purushothaman K, Knisely JP, Chen Z, Papademetris X, Staib LH, Duncan JS. Constrained non-rigid registration for use in image-guided adaptive radiotherapy. Med. Image Anal. 2009;5:809–817. doi: 10.1016/j.media.2009.07.004. [DOI] [PMC free article] [PubMed] [Google Scholar]
- Gu X, Pan H, Liang Y, Castillo R, Yang D, Choi DJ, Castillo E, Majumdar A, Guerrero T, Jiang SB. Implementation and evaluation of various Demons deformable image registration algorithms on a GPU. Phys. Med. Biol. 2010;55:207–219. doi: 10.1088/0031-9155/55/1/012. [DOI] [PMC free article] [PubMed] [Google Scholar]
- Guimond A, Roche A, Ayache N, Meunier J. Three-dimensional multimodal brain warping using the Demons algorithm and adaptive intensity corrections. IEEE Trans. Med. Imag. 2001;20:58–69. doi: 10.1109/42.906425. [DOI] [PubMed] [Google Scholar]
- Hatton J, McCurdy B, Greer PB. Cone beam computerized tomography: the effect of calibration of the Hounsfield unit number to electron density on dose calculation accuracy for adaptive radiation therapy. Phys. Med. Biol. 2009;54:N329–N346. doi: 10.1088/0031-9155/54/15/N01. [DOI] [PubMed] [Google Scholar]
- Horn BKP, Schunck BG. Determining optical flow. Artif. Intell. 1981;17:185–203. [Google Scholar]
- Hou J, Guerrero M, Chen W, Souza W. Deformable planning CT to cone-beam CT image registration in head-and-neck cancer. Med. Phys. 2011;38:2088–2094. doi: 10.1118/1.3554647. [DOI] [PubMed] [Google Scholar]
- Loeckx D, Slagmolen P, Maes F, Vandermeulen D, Suetens P. Nonrigid image registration using conditional mutual information. IEEE Trans. Med. Imag. 2010;29:19–29. doi: 10.1109/TMI.2009.2021843. [DOI] [PubMed] [Google Scholar]
- Lu C, Chelikani S, Chen Z, Papademetris X, Staib LH, Duncan JS. Integrated segmentation and nonrigid registration for application in prostate image-guided radiotherapy. Med. Image Comput. Comput. Assist. Interv. (MICCAI) 2010:53–60. doi: 10.1007/978-3-642-15705-9_7. [DOI] [PubMed] [Google Scholar]
- Lu C, Chelikani S, Papademetris X, Knisely JP, Milosevic MF, Chen Z, Jaffray DA, Staib LH, Duncan JS. An integrated approach to segmentation and nonrigid registration for application in image-guided pelvic radiotherapy. Med. Image Anal. 2011;5:772–785. doi: 10.1016/j.media.2011.05.010. [DOI] [PMC free article] [PubMed] [Google Scholar]
- Maes F, Collignon A, Vandermeulen D, Marchal G, Suetens P. Multimodality image registration by maximization of mutual information. IEEE Trans. Med. Imag. 1997;16:187–198. doi: 10.1109/42.563664. [DOI] [PubMed] [Google Scholar]
- Marchant TE, Moore CJ, Rowbottom CG, MacKay RI, Williams PC. Shading correction algorithm for improvement of cone-beam CT images in radiotherapy. Phys. Med. Biol. 2008;53:5719–5733. doi: 10.1088/0031-9155/53/20/010. [DOI] [PubMed] [Google Scholar]
- Muyan-Ozcelik P, Owens JD, Xia J, Samant SS. Fast deformable registration on the GPU: a CUDA implementation of Demons. In: UnConventional High Performance Computing (UCHPC) in conjunction with the 6th International Conference on Computational Science and Its Applications (ICCSA) IEEE Computer Society. 2008:223–233. [Google Scholar]
- Myronenko A, Song X. Intensity-based image registration by minimizing residual complexity. IEEE Trans. Med. Imag. 2010;29:1882–1891. doi: 10.1109/TMI.2010.2053043. [DOI] [PubMed] [Google Scholar]
- Nithiananthan S, Schafer S, Uneri A, Mirota DJ, Stayman JW, Zbijewski W, Brock KK, Daly MJ, Chan H, Irish JC, Siewerdsen JH. Demons deformable registration of CT and cone-beam CT using an iterative intensity matching approach. Med. Phys. 2011;38:1785–1798. doi: 10.1118/1.3555037. [DOI] [PMC free article] [PubMed] [Google Scholar]
- Niu T, Al-Basheer A, Zhu L. Quantitative cone-beam CT imaging in radiation therapy using planning CT as a prior: first patient studies. Med. Phys. 2012;39:1991–2000. doi: 10.1118/1.3693050. [DOI] [PMC free article] [PubMed] [Google Scholar]
- Niu TY, Sun MS, Star-Lack J, Gao HW, Fan QY, Zhu L. Shading correction for on-board cone-beam CT in radiation therapy using planning mdct images. Med. Phys. 2010;37:5395–5406. doi: 10.1118/1.3483260. [DOI] [PubMed] [Google Scholar]
- Niu TY, Zhu L. Overview of X-ray scatter in cone-beam computed tomography and its correction methods. Curr. Med. Imag. Rev. 2010;6:82–89. [Google Scholar]
- Niu TY, Zhu L. Scatter correction for full-fan volumetric CT using a stationary beam blocker in a single full scan. Med. Phys. 2011;38:6027–6038. doi: 10.1118/1.3651619. [DOI] [PMC free article] [PubMed] [Google Scholar]
- Ou W, Chefd’Hotel C. Polynomial intensity correction for multimodal image registration. IEEE Int. Symposium on Biomedical Imaging (ISBI) 2009:939–942. [Google Scholar]
- Paquin D, Levy D, Xing L. Multiscale registration of planning CT and daily cone beam CT images for adaptive radiation therapy. Med. Phys. 2009;36:4–11. doi: 10.1118/1.3026602. [DOI] [PMC free article] [PubMed] [Google Scholar]
- Pluim JPW, Maintz JBA, Viergever MA. Mutual-information-based registration of medical images: a survey. IEEE Trans. Med. Imag. 2003;22:986–1004. doi: 10.1109/TMI.2003.815867. [DOI] [PubMed] [Google Scholar]
- Pohl K, Fisher J, Levitt J, Shenton M, Kikinis R, Grimson W, Wells W. A unifying approach to registration, segmentation, and intensity correction. Med. Image Comput. Comput. Assist. Interv. (MICCAI) 2005:310–318. doi: 10.1007/11566465_39. [DOI] [PMC free article] [PubMed] [Google Scholar]
- Razlighi QR, Kehtarnavaz N, Nosratinia A. Computation of image spatial entropy using quadrilateral Markov random field. IEEE Trans. Image Process. 2009;18:2629–2639. doi: 10.1109/TIP.2009.2029988. [DOI] [PubMed] [Google Scholar]
- ur Rehman T, Pryor G, Melonakos J, Tannenbaum A. Multi-resolution 3D nonrigid registration via optimal mass transport on the GPU. Med. Image Comput. Comput. Assist. Interv. (MICCAI) 2007 doi: 10.1016/j.media.2008.10.008. [DOI] [PMC free article] [PubMed] [Google Scholar]
- Roche A, Malandain G, Pennec X, Ayache N. Med. Image Comput. Comput. Assist. Interv. (MICCAI) Springer-Verlag; 1998. The correlation ratio as a new similarity measure for multimodal image registration; pp. 1115–1124. [Google Scholar]
- Samant SS, Xia JY, Muyan-Ozcelilk P, Owens JD. High performance computing for deformable image registration: towards a new paradigm in adaptive radiotherapy. Med. Phys. 2008;35:3546–3553. doi: 10.1118/1.2948318. [DOI] [PubMed] [Google Scholar]
- Schreibmann E, Chen TY, Xing L. Image interpolation in 4D CT using a bspline deformable registration model. Int. J. Radiation Oncol. Biol. Phys. 2006;4:1537–C1550. doi: 10.1016/j.ijrobp.2005.11.018. [DOI] [PubMed] [Google Scholar]
- Shams R, Sadeghi P, Kennedy R, Hartley R. A survey of medical image registration on multicore and the GPU. Signal Process. Mag. 2010;27 [Google Scholar]
- Sharp G, Kandasamy N, Singh H, Folkert M. GPU-based streaming architectures for fast cone-beam CT image reconstruction and demons deformable registration. Phys. Med. Biol. 2007;52:5771–5783. doi: 10.1088/0031-9155/52/19/003. [DOI] [PubMed] [Google Scholar]
- Star-Lack J, Sun M, Kaestner A, Hassanein R, Virshup G, Berkus T, Oelhafen M. Efficient scatter correction using asymmetric kernels. Proc. SPIE. 2009;7258:1Z1–1Z12. [Google Scholar]
- Thirion JP. Image matching as a diffusion process: an analogy with Maxwell demons. Med. Image Anal. 1998;2:243–260. doi: 10.1016/s1361-8415(98)80022-4. [DOI] [PubMed] [Google Scholar]
- Vercauteren T, Pennec X, Perchant A, Ayache N. Diffeomorphic Demons: efficient non-parametric image registration. NeuroImage. 2009;45:S61–S72. doi: 10.1016/j.neuroimage.2008.10.040. [DOI] [PubMed] [Google Scholar]
- Viola P, Wells WM. Alignment by maximization of mutual information. Int. J. Comput. Vis. 1997;24:137–154. [Google Scholar]
- Wu C, Jeraj R, Olivera GH, Mackie TR. Reoptimization in adaptive radiotherapy. Phys. Med. Biol. 2002;47:3181–3195. doi: 10.1088/0031-9155/47/17/309. [DOI] [PubMed] [Google Scholar]
- Xie YQ, Chao M, Lee P, Xing L. Feature-based rectal contour propagation from planning CT to cone beam CT. Med. Phys. 2008;35:4450–4459. doi: 10.1118/1.2975230. [DOI] [PMC free article] [PubMed] [Google Scholar]
- Yan D, Vicini F, Wong J, Martinez A. Adaptive radiation therapy. Phys. Med. Biol. 1997;42:123–132. doi: 10.1088/0031-9155/42/1/008. [DOI] [PubMed] [Google Scholar]
- Yang Y, Schreibmann E, Li E, Wang C, Xing L. Evaluation of on-board kV cone beam ct (CBCT)-based dose calculation. Phys. Med. Biol. 2007;52:685–705. doi: 10.1088/0031-9155/52/3/011. [DOI] [PubMed] [Google Scholar]
- Yi Z, Soatto S. Nonrigid registration combining global and local statistics; Proceedings of the IEEE Conference on Computer Vision and Pattern Recognition; 2009. [Google Scholar]
- Zhu L, Bennett N, Fahrig R. Scatter correction method for X-ray CT using primary modulation: theory and preliminary results. Trans. Med. Imag. 2006;25:1573–1587. doi: 10.1109/tmi.2006.884636. [DOI] [PubMed] [Google Scholar]


