

Abstract
Purpose
This study examined longitudinal changes in waist-to-height ratio and components of BMI among black and white females.
Methods
Girls were recruited at age 9 through the NHLBI Growth and Health Study (NGHS), and followed annually over ten years. Girls were grouped into low (<20th %tile), middle, and high (>80th %tile) BMI on the basis of race-specific BMI percentile rankings at age 9, and low, middle, and high waist-to-height ratio, on the basis of waist-to-height ratio at age 11. BMI was partitioned into fat mass and fat-free mass index (FMI and FFMI).
Results
Girls accrued fat mass at a greater rate than fat-free mass, and the ratio of fat mass to fat-free mass increased from ages 9 through 18. There was a significant increase in this ratio after age at peak height velocity. Participants with elevated BMI and waist-to-height ratios at age 18 tended to have been elevated at ages 9 and 11, respectively. There were strong correlations between BMI at age 9 with several outcomes at age 18: BMI (0.76) and FMI (0.72), weaker but significant with FFMI (0.37), and ratio of fat mass to fat-free mass (0.53). Additionally, there was significant tracking of elevated BMI from ages 9 through 18.
Conclusions
In girls, higher BMI levels during childhood lead to greater waist-to-height ratios and greater than expected changes in BMI at age 18, with disproportionate increases in fat mass. These changes are especially evident in blacks and after the pubertal growth spurt.
INTRODUCTION
Body composition changes during puberty; height, body mass, and body mass index (BMI, kg/M2) increase in both sexes. The main components of body composition (total body fat, lean body mass, and bone mineral content) all increase during pubertal maturation, with considerable sexual dimorphism.[1] BMI can be partitioned into fat mass and fat-free mass index (FMI and FFMI) (wt/ht2= [fat mass + fat free mass]/ht2 = FMI + FFMI).[2] Maynard [3] reported that annual increases in BMI are driven primarily by increases in FFMI, with increases in FMI contributing a larger proportion of BMI increase in girls than boys. In that report, increases in FFM accounted for most of the increase in weight until age 16 in girls, when increases in weight were explained largely by increased total body fat (TBF). Huang [4] reported that body fat showed significant growth after adjusting for lean tissue mass, implying children gain fat in excess of the level expected due to normal maturation. However, another study noted that as heavier girls grow older, there is a greater increase in adiposity when contrasted to lighter girls; and as heavier boys grow older, there are greater increases in both fat and lean components of BMI than in lighter boys.[5] Data from the Bogalusa Heart Study indicated that the relationship between BMI percentile and body fatness is nonlinear; there is a strong correlation between BMI and FMI if BMI is above the median, but a weak correlation between BMI and FFMI. In contrast, for those below the median BMI, the correlation between BMI and FMI is weak and between BMI and FFMI strong.[6]
More recently, the ratio of waist-to-height has been proposed as a measure of complications associated with the degree of adiposity. Freedman showed that the BMI-for-age z score and waist-to-height ratio predicted at-risk levels of lipid, insulin, and blood pressure in children and adolescents equally well.[7] Overweight children with either waist greater than 90th %tile, or high waist-to-height ratio, had greater risk of metabolic (OR = 7) or cardiovascular risks (OR = 8.2) than subjects with waist less than 90th %tile or waist: height ratio less than 0.5.[8] The waist-to-height ratio was found to have the best fit when examining longitudinal associations with cardiovascular disease in adult men and women, but the differences between waist-to-hip ratio and BMI, in examining the association with cardiovascular disease, appeared to be not clinically important.[9]
The purpose of this study was to assess relationships in waist-to-height ratio and BMI, with a primary focus the FMI and FFMI in black and white girls followed from age 9 to adulthood. We hypothesized that fat mass and fat-free mass would increase during the teen years, and those with greater baseline waist-to-height ratio as well as greater BMI would experience a greater increase in fat mass.
METHODS
The National Heart, Lung, and Blood Institute Growth and Health Study (NGHS) was a 10-year cohort study that recruited a socio-economically diverse group of girls, ages 9 and 10 years at entry. Participants were recruited from public and parochial schools in metropolitan Cincinnati, Ohio; the Richmond, California Unified School District; and a random sample of participants from a health maintenance organization in Washington, DC.[10] Eligibility was restricted to girls (and parents) who declared that they were “Black” or “White”, and who lived in racially concordant households. Only the girls aged 9 at entry were included in these analyses.
At annual visits, height, weight, pubertal maturation assessment, bioelectrical impedance analysis, and beginning in Year 2, waist circumference (minimum waist) were measured. Anthropometric methodology has been described previously.[10] Pubertal maturation assessment was performed according to Tanner for pubic hair stages [11], and by the system of Garn and Falkner for areolar stages.[12] Areolar and breast staging are highly correlated (.94).[12] Age of menarche was established by assessment at the annual examination. All physical examination procedures were performed by female examiners after training and certification. Two measurements were taken of each variable with a third measurement if the two differed by a preset amount. The mean of the two closest measurements were used.
Bioelectrical impedance was measured using a BIA 101 body composition analyzer (RJL Systems, Detroit MI). Resistance and reactance were measured to the nearest ohm on the right side of the body using a tetrapolar placement of electrodes.[13] In an ancillary study, fat, lean, and bone mass were measured by dual energy X-ray absorptiometry (DXA) in a different sample of 65 white and 61 black girls, 6–17 years of age, and race-specific prediction equations were developed. The explanatory variables included weight, stature, resistance, and reactance; the variance accounted for through each race-specific equation was 0.99.[14]
Analyses: Of the 2379 9-year-old cohort, 297 (12.5%) girls dropped out of the study. Two-sample Student T-tests compared baseline body composition parameters between the girls who were followed up to age 18 with those who were not, and the comparisons did not find any statistically significant differences. Thus, we assumed those participants with missing data were random, and subsequent analyses were conducted using available visits. Girls were grouped into low (<20th %tile), middle, and high (>80th %tile) BMI on the basis of race-specific BMI %tile rankings at age 9. BMI was partitioned into fat mass and fat-free mass (FMI and FFMI) (wt/ht2= [fat mass + fat free mass]/ht2 = FMI + FFMI).[2] Additionally, girls were grouped into low (<20th %tile), middle, and high (>80th %tile) waist-to-height ratio, on the basis of race-specific waist-to-height percentile rankings at age 11. Girls were also grouped into early (<20th %tile), typical, and late (>80th %tile) timing of maturation on the basis of timing of menarche, utilizing race-specific standards. Means and standard deviations were reported for each group, stratified by race. Analysis of variance was calculated by comparisons across the three groups by race. We also examined Pearson correlation coefficients among these BMI variables, and waist to height ratio outcomes; correlations estimated by quintile groups. Fisher’s Z-transformations were used to estimate the 95% confidence intervals for the correlations. Lastly, generalized estimating equations (GEE) analyses were used to model the trajectories of the BMI variables across 10 years of follow-up visits. In particular we examined whether there was a significant change in the rate of growth before and after the age at peak height velocity. A binary indicator variable was introduced into the model to indicate whether rate of BMI increase was before or after age at peak height velocity. The GEE model examined the effect of race, race differences within BMI groups, and growth velocity. In addition, analyses were conducted to examine whether girls tracked across their weight and obesity status, defining overweight and obesity defined using CDC criteria. The analyses were carried out using logistic regression modeling.
Height velocity was calculated by the change in height between consecutive visits, divided by the time interval between those visits. Peak height velocity (PHV) was estimated through identifying the greatest value among the visits, and age at PHV was defined as the age at that visit.
A model examined influences on longitudinal changes in the ratio of fat mass to fat-free mass. Potential explanatory variables included BMI quintile group at age 9; race; age of PHV; the time passed since the participant reached PHV (to allow the examination of timing of growth on an individual basis), and two-way interactions between those variables.
RESULTS
There were 610 white and 531 black participants included in the analysis; cohort retention was 89.4% at year 10 of the study. Among white participants, the lowest quintile of BMI at age 9 was less than 14.2, and the highest quintile was greater than 22.4. Early menarche was defined as less than 11.73 years of age, and late menarche as greater than 13.58 years. Among black participants, the lowest quintile of BMI at age 9 was less than 14.6, and the highest quintile was greater than 24.8. Early menarche was defined as less than 11.06 years, and late as menarche greater than 12.97 years. Among white participants, mean waist-to-height ratio was 0.434 at age 11, and the 20th and 80th percentile values were 0.391 and 0.472; among black participants, mean waist-to-height ratio was 0.445 at age 11, and 20th and 80th percentile values 0.395 and 0.492. The difference between mean waist-to-height ratio by race was p < .0001.
Girls with BMI in the top quintile at age 9 had greater FMI and FFMI than girls with lower BMI levels at both age 9 and age 18 (Tables A1 and A2; Figure). There were strong correlations between BMI at age 9 with several outcomes at age 18: BMI (Pearson r = .76, p < .0001), FMI (r = .72, p < .0001), and the ratio of fat mass to fat-free mass (r = .53, p < .0001), and weaker but significant with FFMI (r = .37, p < .0001). The correlations between BMI and partitioned BMI (BMI fat [FMI], BMI fat-free [FFMI]) differed by BMI quintile group at age 9 (Table B). Of note, the weakest correlation between BMI at age 9 and BMI at age 18 was in the group with the lowest BMI quintile (r = .196, p = .06). Participants with the greatest BMI quintile at age 9 had the greatest waist-to-height ratio at age 18. Additionally, there were similar outcomes in BMI components at age 18 when examining those grouped by upper, mid, and lower waist-to-height ratio at age 11 (Table A2).
Table A1.
Body mass variables at age 9, by race and by BMI group at age 9
| BMI Group | Race | N | BMI Mean (std) | %BF Mean (std) | FFMI Mean (std) | FMI Mean (std) | FAT to FF ratio Mean (std) |
|---|---|---|---|---|---|---|---|
| Low | W | 122 | 14.22 (0.689) |
13.68 (2.728) |
12.26 (0.604) |
1.95 (0.427) |
0.160 (0.037) |
| Middle | W | 368 | 17.02 (1.306) |
18.89 (4.449) |
13.77 (0.826) |
3.25 (0.949) |
0.237 (0.070) |
| High | W | 122 | 22.44 (2.566) |
30.72 (6.196) |
15.44 (1.203) |
7.00 (2.110) |
0.455 (0.136) |
| Low | B | 106 | 14.58 (0.620) |
12.63 (2.587) |
12.73 (0.549) |
1.85 (0.409) |
0.146 (0.034) |
| Middle | B | 321 | 17.72 (1.666) |
18.75 (5.618) |
14.32 (0.846) |
3.40 (1.312) |
0.238 (0.091) |
| High | B | 106 | 24.76 (2.277) |
34.72 (6.569) |
16.08 (1.448) |
8.68 (2.251) |
0.548 (0.168) |
P-value of Kruskal-Wallis test for all comparisons among three BMI groups are <0.0001 for all variables.
W = white; B = black; %BF = percent body fat; FFMI = fat-free mass index; FMI = fat mass index; FAT to FF ratio = fat mass to fat-free mass ratio; std = standard deviation
Table A2.
Body mass variables at age 18, by race and by BMI group at age 9, or waist-to-height ratio at age 11
| BMI GROUP at AGE 9 | RACE | N | BMI Mean(std) | %BF Mean(std) | FFMI Mean(std) | FMI Mean(std) | FAT to FF ratio (std) |
|---|---|---|---|---|---|---|---|
| Low | W | 108 | 20.02 (2.134) |
22.44 (5.180) |
15.45 (1.127) |
4.57 (1.561) |
0.29 (0.099) |
| Middle | W | 323 | 22.66 (3.256) |
26.85 (7.459) |
16.37 (1.272) |
6.28 (2.720) |
0.38 (0.161) |
| High | W | 105 | 30.03 (6.804) |
39.01 (12.197) |
17.44 (1.940) |
12.33 (6.674) |
0.73 (0.510) |
| Low | B | 95 | 20.45 (2.667) |
21.96 (6.695) |
15.80 (1.259) |
4.64 (2.117) |
0.29 (0.133) |
| Middle | B | 273 | 25.47 (5.119) |
30.77 (10.544) |
17.10 (1.460) |
8.30 (4.629) |
0.49 (0.281) |
| High | B | 93 | 35.87 (6.869) |
48.93 (13.126) |
17.51 (2.792) |
18.14 (7.780) |
1.17 (1.145) |
| W to Ht GROUP at AGE 11 | RACE | N | BMI Mean(std) | %BF Mean(std) | FFMI Mean(std) | FMI Mean(std) | FAT to FF ratio (std) |
| Low | W | 97 | 19.96 (2.033) |
21.76 (4.683) |
15.55 (1.153) |
4.41 (1.326) |
0.28 (0.080) |
| Middle | W | 292 | 22.71 (3.199) |
26.96 (7.022) |
16.40 (1.325) |
6.30 (2.611) |
0.38 (0.155) |
| High | W | 94 | 30.10 (6.889) |
39.10 (12.091) |
17.45 (2.064) |
12.36 (6.709) |
0.74 (0.523) |
| Low | B | 84 | 20.45 (2.667) |
21.96 (6.695) |
15.80 (1.259) |
4.64 (2.117) |
0.29 (0.133) |
| Middle | B | 258 | 25.47 (5.119) |
30.77 (10.544) |
17.10 (1.460) |
8.30 (4.629) |
0.49 (0.281) |
| High | B | 87 | 35.87 (6.869) |
48.93 (13.126) |
17.51 (2.792) |
18.14 (7.780) |
1.17 (1.145) |
P-value of Kruskal-Wallis test for all comparisons among three BMI groups are <0.0001 for all variables.
W = white; B = black; %BF = percent body fat; FFMI = fat-free mass index; FMI = fat mass index; FAT to FF ratio = fat mass to fat-free mass ratio; W to Ht = waist to height ratio; std = standard deviation
Figure. FFMI and FMI, by BMI group at age 9, and by age.
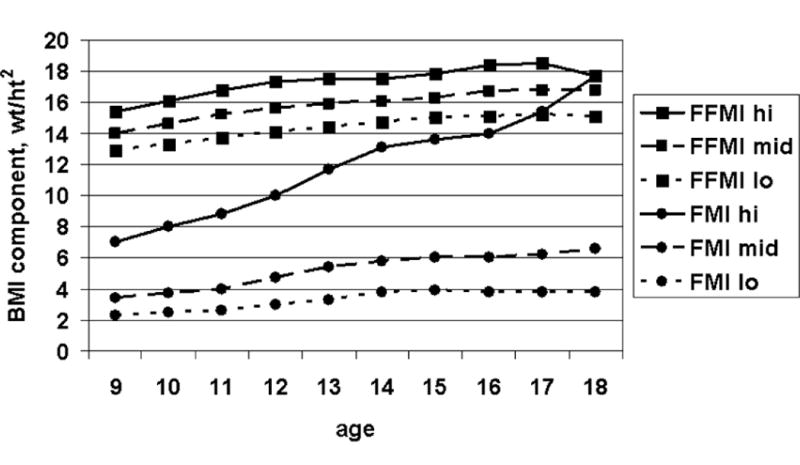
Table B.
Correlation of BMI to partitioned BMI, at ages 9 and 18, by BMI group at ages 9 and 18 (Pearson R)
| Ratio of BMI@9 to BMI@18 (95% confidence interval) |
Ratio of BMI to FMI (95% confidence interval) |
Ratio of BMI to FFMI (95% confidence interval) |
Ratio of FMI to FFMI (95% confidence interval) |
|
|---|---|---|---|---|
| Low BMI group (mean BMI 14.6), at age 9 | N/A | 0.440 (.328, .539) |
0.795 (.741, .838) |
0.261 (.129, .373) |
| Mid BMI group (mean BMI 17.9), at age 9 | N/A | 0.822 (.796, .844) |
0.677 (.634, .715) |
0.692 (.651, .729) |
| High BMI group (mean BMI 24.6), at age 9 | N/A | 0.864 (.826, .893) |
0.502 (.397, .593) |
0.668 (.589, .734) |
| Low BMI group (mean BMI 20.4), at age 18 | 0.206 (.069, .333) |
0.188 (.050, .318) |
0.130 (−.009, .263) |
0.169 (.031, .300) |
| Mid BMI group (mean BMI 24.6), at age 18 | 0.515 (.454, .572) |
0.460 (.419, .625) |
0.350 (.277, .419) |
0.406 (.336, .471) |
| High BMI group (mean BMI 33.8), at age 18 | 0.581 (.479, .665) |
0.531 (.419, .625) |
0.030 (−.112, .171) |
0.311 (.176, .433) |
BMI@9 = BMI at age 9 years; BMI@18 = BMI at age 18 years; FFMI = fat-free mass index; FMI = fat mass index
Independent of BMI at age 9, girls accrued fat mass at a greater rate than fat-free body mass (Figure). The ratio of fat mass to fat-free mass increased steadily from ages 9 through 18, in both races and regardless of initial BMI group. GEE modeling demonstrated that white participants had lower fat: fat-free ratio than the black participants (p = .0006). Girls from the high BMI group had the highest fat: fat-free ratio, and girls from the low BMI group had the lowest fat: fat-free ratio (p < .0001). There was an interaction between race and BMI group (p < .0001), and white participants in the high and mid-BMI groups had lower fat: fat-free ratio than black participants in those BMI groups, whereas black participants in the low BMI group had lower fat: fat-free mass than white participants in that group. The fat: fat-free ratio was significantly greater after the age of peak height velocity than before the age of peak height velocity (p = 0.0002).
The majority of girls with elevated (≥ 80th percentile) BMI at age 18 had had elevated BMI at age 9 (197/307, 64.2%). In a similar fashion, the majority (165/265, 62.3%) of those obese (≥ 85th percentile BMI) at age 18 had been obese at age 9. Additionally, the majority of those with elevated waist-to-height ratio (≥ 0.50) at age 18 had an elevated BMI at age 9 (151/200, 75.5%), and although the relationship of waist-to-height ratio between ages 11 and 18 were significant, a substantial number of those with an elevated waist-to-height ratio at age 18 had not had at an elevated waist-to-height ratio at age 11 (211/400, 53.8%). Of note, in a regression analysis examining those obese at age 18, elevated (≥ 80th percentile) BMI at age 9, elevated (≥ 0.50) waist-to-height ratio at age 11, and earlier age of menarche were all independently associated with risk of obesity (elevated BMI at age 9, increased odds 5.18, p < .0001; elevated waist-to-height ratio increased odds 7.82, p < .0001; earlier menarche, increased odds 1.26, p = .004).
When examining tracking of the girls with elevated BMI (≥ 80th percentile) from age 9 years to age 18 years, 68% persisted, with tracking noted in 13.64% (Odds Ratio 24.34; 95% CI 16.45, 36.01).
Regardless of race, women at age 18 who had earlier maturation had greater BMI, greater fat mass index, greater fat-free mass index, and greater waist-to-height ratio (Table C). The ratio of fat mass to fat-free mass was greater in earlier maturing girls, and there was a significant increase in this ratio after age at peak height velocity in all girls, regardless of timing of maturation (data not shown).
Table C.
Body mass variables at age 18, by race and by timing of puberty
| Timing | Race | N | BMI Mean (std) | %BF Mean (std) | FFMI Mean (std) | FMI Mean (std) | FAT to FF Mean (std) | W to Ht Mean (std) |
|---|---|---|---|---|---|---|---|---|
| Early | W | 100 | 25.21 (6.629) |
30.90 (11.406) |
16.63 (1.553) |
8.40 (5.799) |
0.50 (0.349) |
0.46 (0.078) |
| On-time | W | 318 | 23.58 (4.929) |
28.48 (9.744) |
16.41 (1.539) |
7.13 (4.357) |
0.44 (0.312) |
0.45 (0.063) |
| Late | W | 103 | 22.03 (4.431) |
25.24 (8.122) |
16.05 (1.412) |
5.79 (3.230) |
0.36 (0.186) |
0.42 (0.053) |
| Early | B | 92 | 28.24 (7.747) |
35.99 (14.502) |
17.04 (1.917) |
11.19 (7.375) |
0.67 (0.487) |
0.50 (0.089) |
| On-time | B | 274 | 26.32 (7.081) |
31.82 (13.206) |
16.97 (1.901) |
9.19 (6.645) |
0.57 (0.732) |
0.47 (0.085) |
| Late | B | 91 | 25.10 (6.593) |
30.20 (13.117) |
16.77 (1.742) |
8.22 (5.914) |
0.49 (0.374) |
0.47 (0.082) |
P-value of Kruskal-Wallis test for all comparisons among three BMI groups are <0.0001 for all variables.
W = white; B = black; %BF = percent body fat; FFMI = fat-free mass index; FMI = fat mass index; FAT to FF = fat mass to fat-free mass ratio; W to Ht = waist to height ratio; std = standard deviation
DISCUSSION
This study has provided longitudinal comparisons between elevated BMI and waist-to-height ratio. Although the girls experienced a greater increase in fat mass than fat-free mass, regardless of BMI, the data indicate that the changes in BMI and its components during the teen years in girls are dependent upon childhood BMI levels. Greater levels of BMI during childhood led to greater than expected changes in BMI, and those changes in BMI are driven by disproportionate increases in fat mass, especially after the pubertal growth spurt. Additionally, there is substantive tracking of elevated BMI from ages 9 to 18 years of age.
Although Maynard noted that the majority of increase in BMI during the teen years could be accounted by the disproportionate increase in fat-free mass [3], our study noted that there was a greater growth in body fat, similar to the findings by Huang.[4] Our study also noted an increase in the ratio of fat mass to fat-free mass from ages 9 through 18, regardless of the initial BMI; however, the increase was greater in those in the greatest quintile of BMI at age 9. This is consistent with the findings from Demerath [5] and Freedman [6], both of whom noted the greater increase in adiposity for girls with greater BMI at younger ages. Of note, several authors have commented that weight and BMI changes may not reflect accurately changes in fat mass or fat-free mass [15–17], and the literature supports use of the ratio of fat mass to fat-free mass to examine better relationship to obesity [18] and metabolic consequences of obesity [17].
This study also noted that adiposity increased at a significantly faster rate after the peak height velocity was attained. As noted previously, peak height velocity occurs within the year following menarche.[19] The major cost of energy expenditure is accounted for by the resting metabolic rate; the resting metabolic rate in young women is greater around the time of menarche, when contrasted to several years before, or after, age at menarche.[20] The relationship between resting metabolic rate and menarche is consistent with the rate of increase in adiposity after attainment of peak height velocity.
Obesity during childhood increases the risk of later obesity, and many obese adults were obese as children; elevated BMI during childhood, and especially during the teen years, is associated with adult obesity.[21–23] In our study sample, the majority of those women with elevated (≥ 80th percentile) BMI at age 18 had had elevated BMI at age 9, and the majority of those obese (≥ 85th percentile BMI) at age 18 had been obese at age 9. Previous studies have noted that many (33–44%) obese adults were obese as children.[21–22]
There were several important differences between black and white participants. Longitudinal analyses noted greater ratio of fat mass to fat-free mass in black participants. Additionally, proportion of body fat was greater among black participants in those with middle and highest quintile BMI, and waist-to-height ratio was greater in black participants.
This study has several limitations. The NGHS only recruited girls identified by themselves and their parents as black or white. Additionally, the NGHS was not nationally representative, although it included broad socioeconomic representation. The NGHS recruited girls at ages 9 and 10. However, we could not include the girls who were age 10 at time of recruitment, since, by definition, we could not classify their BMI status at age 9. Additionally, we wanted to choose an age before most girls had entered puberty, to examine longitudinal changes in body composition before the onset of puberty.
As noted above, BMI level at age 9 in girls predicts BMI level at 18, and adiposity increases more quickly after attainment of peak height velocity. Additionally, many of sthose with elevated BMI at age 9 become obese young adults, and the majority of obese adults had elevated BMI at age 9. These findings suggest that interventions to decrease overall prevalence and level of obesity within an individual girl should focus on the preteen years and when teens are experiencing the pubertal growth spurt, especially among girls who mature early.
Acknowledgments
We would like to acknowledge clerical assistance from Lynn Hanrahan, and the time and effort of the staff and families of the NHLBI Growth and Health Study.
Supported, in part, through Puberty and Cancer Initiation: Environment, Diet, and Obesity, grant U01-ES12770/subaward P021-040-L529-1095; and contracts HC55023-26 and cooperative agreements U01-HL-48941-44 from the National Heart, Lung, and Blood Institute (NHLBI), and Taft Research Grant at the University of Cincinnati.
Footnotes
Publisher's Disclaimer: This is a PDF file of an unedited manuscript that has been accepted for publication. As a service to our customers we are providing this early version of the manuscript. The manuscript will undergo copyediting, typesetting, and review of the resulting proof before it is published in its final citable form. Please note that during the production process errors may be discovered which could affect the content, and all legal disclaimers that apply to the journal pertain.
References
- 1.Siervogel RM, Demerath EW, Schubert C, et al. Puberty and body composition. Horm Res. 2003;60(supp 1):36–45. doi: 10.1159/000071224. [DOI] [PubMed] [Google Scholar]
- 2.VanItallie TB, Yang MU, Heymsfield SB, et al. Height-normalized indices of the body’s fat-free mass and fat mass: Potentially useful indicators of nutritional status. Am J Clin Nutr. 1990;52:953–9. doi: 10.1093/ajcn/52.6.953. [DOI] [PubMed] [Google Scholar]
- 3.Maynard LM, Wisemandle W, Roche AF, et al. Childhood body composition in relation to body mass index. Pediatrics. 2001;107:344–50. doi: 10.1542/peds.107.2.344. [DOI] [PubMed] [Google Scholar]
- 4.Huang TTK, Johnson MS, Figueroa-Colon R, et al. Growth of visceral fat, subcutaneous abdominal fat, and total body fat in children. Obes Res. 2001;9:283–9. doi: 10.1038/oby.2001.35. [DOI] [PubMed] [Google Scholar]
- 5.Demerath EW, Schubert CM, Maynard LM, et al. Do changes in body mass index percentile reflect changes in body composition in children? Data from the Fels Longitudinal Study. Pediatrics. 2006;117:e487–e495. doi: 10.1542/peds.2005-0572. [DOI] [PubMed] [Google Scholar]
- 6.Freedman DS, Wang J, Maynard LM, et al. Relation of BMI to fat and fat-free mass among children and adolescents. Int J Obes Relat Metab Disord. 2005;29:1–5. doi: 10.1038/sj.ijo.0802735. [DOI] [PubMed] [Google Scholar]
- 7.Freedman DS, Kahn HS, Mei Z, et al. Relation of body mass index and waist-to-height ratio to cardiovascular disease risk factors in children and adolescents: The Bogalusa Heart Study. Am J Clin Nutr. 2007;86:33–40. doi: 10.1093/ajcn/86.1.33. [DOI] [PubMed] [Google Scholar]
- 8.Maffeis C, Banzato C, Talamini G. Waist-to-height ratio, a useful index to identify high metabolic risk in overweight children. J Pediatr. 2008;152:207–13. doi: 10.1016/j.jpeds.2007.09.021. [DOI] [PubMed] [Google Scholar]
- 9.Gelber RP, Gaziano JM, Orav EJ, et al. Measures of obesity and cardiovascular risk among men and women. J Am Coll Cardiol. 2008;52:605–15. doi: 10.1016/j.jacc.2008.03.066. [DOI] [PMC free article] [PubMed] [Google Scholar]
- 10.The NHLBI Growth and Health Study Research Group Obesity and cardiovascular disease risk factors in nine- and ten- year old black and white girls: The NHLBI Growth and Health Study. Am J Public Health. 1992;82:1613–20. doi: 10.2105/ajph.82.12.1613. [DOI] [PMC free article] [PubMed] [Google Scholar]
- 11.Tanner J. Growth at adolescence. 2. Oxford: Blackwell Scientific Publications; 1962. pp. 36–9. [Google Scholar]
- 12.Biro F, Falkner F, Khoury P, et al. Areolar and breast staging in adolescent girls. Adolesc Pediatr Gynecol. 1992;5:271–2. [Google Scholar]
- 13.Lukaski HC. Methods for the assessment of human body composition: Traditional and new. Am J Clin Nutr. 1987;46:537–56. doi: 10.1093/ajcn/46.4.537. [DOI] [PubMed] [Google Scholar]
- 14.Morrison JA, Guo SS, Specker B, et al. Assessing the body composition of 6–17 year old black and white girls in field studies. Am J Human Biol. 2001;13:249–54. doi: 10.1002/1520-6300(200102/03)13:2<249::AID-AJHB1035>3.0.CO;2-6. [DOI] [PubMed] [Google Scholar]
- 15.Guo SS, Zeller C, Chumlea WE, Siervogel RM. Aging, body composition, and lifestyle: the Fels Longitudinal Study. Am J Clin Nutr. 1999;70:405–11. doi: 10.1093/ajcn/70.3.405. [DOI] [PubMed] [Google Scholar]
- 16.Kyle UG, Schutz Y, Dupertuis YM, Pichard C. Body composition interpretation: contributions of the fat-free mass index and the body fat mass index. Nutrition. 2003;19:597–604. doi: 10.1016/s0899-9007(03)00061-3. [DOI] [PubMed] [Google Scholar]
- 17.Wells JCK, Victora CG. Indices of whole-body and central adiposity for evaluating the metabolic load of obesity. Int J Obes. 2005;29:483–89. doi: 10.1038/sj.ijo.0802899. [DOI] [PubMed] [Google Scholar]
- 18.Judd SE, Ramirez-Zea M, Stein AD. Relation of ratio indices of anthropometric measures to obesity in a stunted population. Am J Human Biol. 2008;20:446–50. doi: 10.1002/ajhb.20762. [DOI] [PMC free article] [PubMed] [Google Scholar]
- 19.Biro FM, Huang B, Crawford PB, et al. Pubertal correlates in black and white girls. J Pediatr. 2006;148:234–40. doi: 10.1016/j.jpeds.2005.10.020. [DOI] [PubMed] [Google Scholar]
- 20.Spadano JL, Bandini LG, Must A, et al. Longitudinal changes in energy expenditure in girls from late childhood through adolescence. Am J Clin Nutr. 2005;81:1102–9. doi: 10.1093/ajcn/81.5.1102. [DOI] [PubMed] [Google Scholar]
- 21.Deshmukh-Taskar P, Nicklas TA, Morales M, et al. Tracking of overweight status from childhood to young adulthood: The Bogalusa Heart Study. Eur J Clin Nutr. 2006;60:48–57. doi: 10.1038/sj.ejcn.1602266. [DOI] [PubMed] [Google Scholar]
- 22.Johannsson E, Arngrimsson SA, Thorsdottir I, et al. Tracking of overweight from early childhood to adolescence in cohorts born 1988 and 1994: Overweight in a high birth weight population. Int J Obes. 2006;30:1265–71. doi: 10.1038/sj.ijo.0803253. [DOI] [PubMed] [Google Scholar]
- 23.Nader PR, O’Brien M, Houts R, et al. Identifying risk for obesity in early childhood. Pediatrics. 2006;118:e594–e601. doi: 10.1542/peds.2005-2801. [DOI] [PubMed] [Google Scholar]