

Abstract
An objective measurement technique to quantify 3D femoral head shape was developed and applied to normal subjects and patients with cam-type femoroacetabular impingement (FAI). 3D reconstructions were made from high-resolution CT images of 15 cam and 15 control femurs. Femoral heads were fit to ideal geometries consisting of rotational conchoids and spheres. Geometric similarity between native femoral heads and ideal shapes was quantified. The maximum distance native femoral heads protruded above ideal shapes and the protrusion area were measured. Conchoids provided a significantly better fit to native femoral head geometry than spheres for both groups. Cam-type FAI femurs had significantly greater maximum deviations (4.99±0.39 mm and 4.08±0.37 mm) than controls (2.41±0.31 mm and 1.75±0.30 mm) when fit to spheres or conchoids, respectively. The area of native femoral heads protruding above ideal shapes was significantly larger in controls when a lower threshold of 0.1 mm (for spheres) and 0.01 mm (for conchoids) was used to define a protrusion. The 3D measurement technique described herein could supplement measurements of radiographs in the diagnosis of cam-type FAI. Deviations up to 2.5 mm from ideal shapes can be expected in normal femurs while deviations of 4 to 5 mm are characteristic of cam-type FAI.
Key Terms: cam FAI, femur morphology, asphericity
Introduction
Femoroacetabular impingement is a recently described disease of the hip that involves reduced clearance between the femoral head and acetabulum due to morphologic abnormalities of the femur (termed cam FAI), acetabulum (termed pincer FAI), or both (termed mixed FAI).21 Cam-type FAI is marked by bony deformities of the femoral head epiphysis and/or reduction of head-neck offset.23,43 Cam deformities appear most often in the anterosuperior or anterolateral region of the femoral head and may cause shearing of hyaline cartilage, labral tears and early onset osteoarthritis (OA) in young adults.21,22,30
Radiographs and physical examinations are the first tools to diagnose cam-type FAI.13,37,46 Physical examinations, involving passive flexion, adduction, and internal rotation of the hip, can often replicate pain and demonstrate loss of range of motion in patients with cam-type FAI, but cannot localize intra-articular bony abnormalities.37 Standard radiographic measurements, such as the alpha angle, provide an estimate of how femoral head shape in hips with suspected cam-type FAI deviates from a perfect circle.13,35,46 However, there is disagreement in the literature regarding the optimal radiographic projection to view cam deformities.18,25,33 In addition, the reliability of two-dimensional (2D) radiographic measurements has been debated.8,11,14
Computed tomography (CT) and magnetic resonance (MR) imaging improve the visualization of cam deformities as well as provide a qualitative assessment of the biological response of adjacent tissue.9,17,36 Unfortunately, published CT/MR based techniques for measuring cam-type FAI, such as radial MRI or acetabular sector angles, still yield only a 2D characterization of femoral head deformities, since measurements are made on a single image slice or limited series of slices.2,17,18,40 To this end, patient-specific 3D reconstructions of femoral head geometry, generated from segmentation of volumetric CT or MR images, have been described to quantify femoral head shape. Most often, 3D reconstructions are fit to spheres.1,6,45 However, there is evidence that even healthy femurs are aspherical and that the articulating surfaces of the whole hip joint may be more accurately described by rotational ellipsoids or conchoids.12,31,41
Currently, there lacks methodology to objectively isolate the femoral head from the neck and identify the 3D location and size of cam-type deformities. Furthermore, quantitative descriptions of how 3D femoral head shapes deviate with respect to ideal shapes are not available. Finally, anatomical deviations from ideal shapes that can be expected in femoral heads with suspected cam-type FAI compared to normal femurs have not been reported. Thus, the purpose of this study was to develop an objective measurement technique to quantify and compare 3D femoral head shape between normal subjects and cam-type FAI patients.
Patients and methods
Subject selection
Institutional Review Board (IRB) approval (#10983) was obtained to prospectively acquire high-resolution multi-detector CT scans of the pelvis and proximal femur in 15 patients (14 males, 1 female) with cam-type FAI. At the time of this study, all patients had hip and groin pain during activity, a positive impingement test, and radiographic evidence of cam-type FAI. In addition, all patients received or were scheduled for femoral osteochondroplasty and treatment of corresponding chondrolabral injury. Three patients were also treated for mixed FAI with correction to the acetabulum, but still had clear radiographic evidence of cam-type FAI.
CT scans were acquired using a Siemens SOMATOM 128 Definition CT Scanner (120 kVp tube voltage, 512 x 512 acquisition matrix, 1.0 mm slice thickness, 0.9 to 1.0 pitch). The baseline tube current was 250 mAs (CareDose used to minimize radiation exposure) and the estimated dose equivalent was 0.969 rem. The field of view covered the lateral border of both hips and varied between 300–400 mm across patients.
Control femurs were retrospectively selected from a collection of dissected and CT scanned cadavers (IRB #11755). Specimens had been screened to exclude those with signs of osteoarthritis and gross bony abnormalities. A cadaveric femur was chosen to match each patient by sex, age, weight, height, and body mass index (BMI). Femurs were aligned anatomically and imaged in a GE High Speed CTI Single Slice Helical CT scanner (100 kVp tube voltage, 512 x 512 acquisition matrix, 1.0 mm slice thickness, 1.0 pitch, 100 mAs tube current, 160 mm field of view).42
Digitally reconstructed radiographs (DRR) were generated from the CT images to measure the alpha angle and head-neck offset of both patients and controls using the standing frog-leg lateral view of the femur.32 First, CT image data of only the femur were isolated from the complete CT image stack using segmentation masks and a Boolean operation within Amira software (v5.3, Visage Imaging, San Diego, CA). The femur images were then rotated into the standing frog-leg position (femur flexed approximately 35° and externally rotated approximately 60°) and a DRR was generated to simulate plain film x-rays (Fig. 1). Alpha angle and head-neck offset were measured as described by Notzli et al. and Eijer et al., respectively, and adapted for the frog-leg lateral view by Clohisy et al.15,19,35 (Fig. 1).
Figure 1.
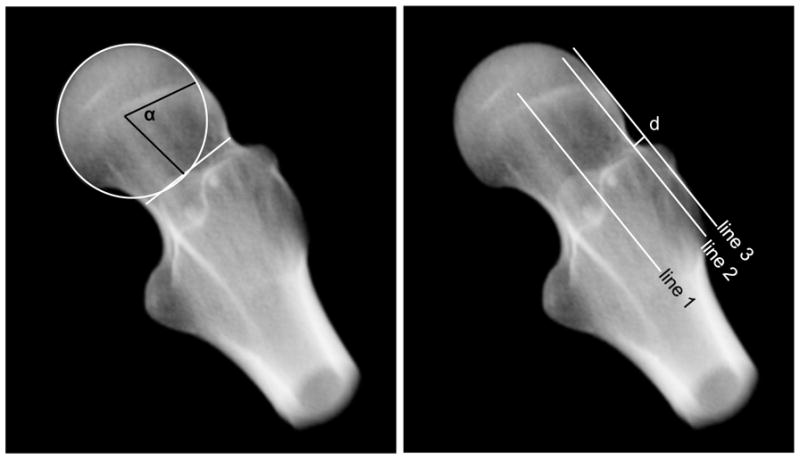
Alpha angle and head-neck offset measured on DRRs of the standing frog-leg lateral view. Left - A circle was fit to the femoral head and a line was drawn across the narrow section of the femoral neck. Alpha angle (α) was measured between a line from the center of the femoral neck to the center of the head and a second line from the center of the head to the point where the femur deviated from the best-fit circle. Right - Head-neck offset was measured by drawing line 1 along the axis of the femoral neck, line 2 parallel to line 1 tangent to the anterolateral neck and line 3 parallel to line 1 tangent to the anterolateral femoral head. Offset was measured as distance (d) between lines 2 and 3.
3D reconstruction
Bone surfaces were semi-automatically segmented from CT image data using Amira and validated threshold settings.4,5 To improve resolution of the segmentation mask, CT images were up-sampled to 1536×1536, 0.3 mm thickness for patients and 1024×1024, 0.5 mm for controls. A sensitivity study found that further up-sampling of either control or patient images did not appreciably alter the shape of resulting 3D reconstructions. Reconstructed surfaces were triangulated and segmentation artifacts were removed by slightly smoothing surfaces using tools available in Amira.
The femoral head-neck junction was delineated using a custom Matlab script (r2010a; MathWorks, Natick, MA). First, a contour map of principal curvatures was created for the entire femoral surface and points of inflection (curvature = 0) were connected circumferentially around the head to define the transition between the head and neck (Fig 2a). Next, a flexible 3D cutting surface was fit to the inflection points (Fig. 2b). The femoral head was identified as the section of the femur proximal to the cutting surface (Fig. 2c).
Figure 2.

Three-dimensional reconstructions of the femur showing the process of identifying the head neck junction and regionalization of the femoral head. (a) First, a contour map of principal curvature was calculated for the entire proximal femur with inflection points identified by the dark line around the neck. (b) Next, a 3D cutting surface was fit to the inflection points. (c) The femoral head (blue) was identified as the section above the cutting surface. (d) Finally, the femoral head was regionalized into 4 regions.
Comparison to ideal geometries
Femoral head reconstructions were fit to two ideal geometries: spheres and rotational conchoids.3 First, the sphere that best fit the nodal coordinates of the femoral head was determined. Next, a spherical surface was created by projecting nodes from the native femoral head onto the best-fit sphere. Likewise, a best-fit conchoid was determined and fit for each femoral head according to:
| [1] |
where r is a curve with length measured from the geometric center of the conchoid, θ is the angle between r and the polar axis, and a and b are radii extending from the center (Fig. 3). The center of the conchoid was defined as the center of the best-fit sphere.
Figure 3.

Geometric description of rotational conchoid according to equation r=a+b*cos(θ). A conchoid was calculated for each femoral head by determining a and b radii values which resulted in a rotational vector, r, that best fit the native femur. Adapted from Anderson et al.3
A custom C++ script measured the distance between nodes on the native femoral head and the best-fit geometries; the maximum distance was identified as “maximum deviation”, with units of mm. Fitting errors between the native femoral head and the best-fit geometry were calculated as the root-mean-squared distance between nodes on the native head and the best-fit geometry. Lower fitting errors indicated a better fit. The fovea of the femoral head was visually identified and excluded during sphere/conchoid fitting and calculation of maximum deviation.
Regionalization of the femoral head and characterization of the protrusion
Regional analysis was completed by dividing each femoral head into four regions: anterolateral (AL), anteromedial (AM), posterolateral (PL), and posteromedial (PM). First, a plane was created based on three points: (1) the geometric center of the head when fit to a sphere, (2) the center of the narrowest cross-section of the neck (i.e. the average Cartesian coordinates of the surface nodes at the narrowest section of the neck), and (3) the circumferential center of the femoral shaft at the superior aspect of the lesser trochanter (i.e. the average Cartesian coordinates of surface nodes at a cross section of the superior aspect of the lesser trochanter). The first plane was approximately equivalent to a coronal slice as it divided the anterior and posterior halves of the femoral head. Using direction cosine values from the first plane and the center of the best-fit sphere, a second plane was created perpendicular to the first to divide the medial and lateral halves of the head. These bisecting planes defined the four regions of the femoral head (Fig. 2d), which were used for all subsequent analyses at the regional level (i.e. same planes used for conchoid and sphere analysis).
The region containing the maximum deviation from ideal geometry was identified as the location of the protrusion. Protrusion area was measured as the deviation threshold (i.e. the lower bound defining a protrusion) was increased logarithmically from 0 mm to 1.0 mm, with an additional deviation threshold at 0.5 mm. Protrusion areas were reported as absolutes (mm2) and as a percentage of total area of the region in which they were located.
Statistical analysis
Variables of interest were assessed for normality using the Shapiro-Wilk test. A paired t- test detected statistically significant differences between normally distributed variables. A nonparametric Mann-Whitney U test was used for data that were not normally distributed. Significance was set at p ≤ 0.05.
Alpha angles and head-neck offsets measured on the frog-leg lateral view were compared using paired t-tests. Fitting errors and maximum and mean deviations from a sphere and conchoid were compared between patients and controls. Fitting errors were also compared between sphere and conchoid fits within each subject group (e.g. sphere vs. conchoid for controls). Regionalized maximum and mean deviations from a sphere and conchoid were compared between patients and controls. Finally, differences in protrusion areas between controls and patients were tested at each deviation threshold for both spheres and conchoids. Data were reported as mean ± standard error of the mean unless otherwise noted.
Results
The average and standard deviation of the age, weight, height and BMI of the patients and (controls) was 26 ± 7 (27 ± 8) years, 84 ± 10 (83 ± 10) kg, 181 ± 8 (182 ± 7) cm, and 25.3 ± 3.4 (24.9 ± 3.2) kg/m2, respectively. Alpha angles for control subjects were 45.9 ± 7.8° and fell within a range previously reported for asymptomatic subjects.15,39 Alpha angles for patients (68.5 ± 13.5°) were significantly greater than those of controls (p < 0.001). The femoral head-neck offset in patients (4.9 ± 1.9 mm) was significantly less when compared to controls (7.1 ± 2.2 mm) (p=0.01).
Compared to a sphere, the rotational conchoid provided a better fit to both patients (p = 0.001) and controls (p < 0.001) (Fig. 4). In addition, control femurs fit the ideal geometry better than patient femurs for both the sphere (p < 0.001) and the conchoid (p < 0.001). Patients had greater maximum deviations from both the sphere and conchoid when compared to controls (p≤ 0.001). Maximum deviations, maximum deviation 95% confidence intervals (CI), and average fitting errors are shown in Table 1.
Figure 4.

Deviations from ideal sphere and rotational conchoid shapes in representative control and patient femurs. Positive fringe plot values indicate areas where the native femur protruded above the ideal geometry.
Table 1.
Mean ± standard error maximum deviation values, 95% confidence intervals of maximum deviations, and mean ± standard error fitting errors of control and patient femurs from best-fit spheres and conchoids.
| Sphere Fit | Conchoid Fit | |||||
|---|---|---|---|---|---|---|
| Max. Deviation (mm) | Max. Deviation 95% CI (mm) | Fit Error (mm) | Max. Deviation (mm) | Max. Deviation 95% CI (mm) | Fit Error (mm) | |
|
| ||||||
| Controls | 2.41 ± 0.31 | 1.81 – 3.01 | 0.739 ± 0.158 | 1.75 ± 0.30 | 1.16 – 2.33 | 0.296 ± 0.230 |
| Patients | 4.99 ± 0.39 | 4.22 – 5.75 | 0.949 ± 0.138 | 4.08 ± 0.37 | 3.36 – 7.80 | 0.660 ± 0.242 |
Maximum deviations from a sphere were less for control femurs than for patients in all regions. Differences were significant in the AL (p<0.001), AM (p = 0.023), and PL (p = 0.016) regions. Mean deviations for the control femurs were less than for patients, but were only statistically significant in the PL region (p = 0.011) (Fig. 5).
Figure 5.

Maximum protrusion and mean deviation by region. Conchoids provided a better fit. Compared to patients, controls had significantly smaller maximum protrusions in almost every region. However, mean deviations between groups were only significant in the posterolateral region. Error bars indicate standard error. P-values indicate significant differences between groups.
Maximum deviations from a conchoid were significantly smaller for control femurs than for patients in all regions (Fig. 5) As with the sphere, mean deviations from a conchoid for the control femurs were less than for patients, but were only statistically significant in the PL region (p = 0.045) (Fig. 5).
The maximum deviation from ideal geometries occurred most often in the AL region. This trend was true for all patients when fit to both spheres and conchoids. For the control femurs fit to spheres, 14 of 15 showed a maximum deviation in the AL region, with 1 being in the PM region. For controls fit to conchoids, there were 4 femurs with maximum deviation in the PM region, with the remaining 11 being in the AL region.
When fit to spheres and with a 0 mm deviation threshold, protrusion areas were 827.1 ± 42.2 mm2 (68.9 ± 3.7% of region) and 675.8 ± 39.3 mm2 (53.0 ± 3.1%) for controls and patients, respectively (Fig. 6). Using conchoids and a 0 mm deviation threshold, protrusion areas for controls and patients were 685.8 ± 56.3 mm2 (54.0 ± 3.5%) and 518.4 ± 41.3 mm2 (40.8 ± 3.4%), respectively (Fig. 6).
Figure 6.

Protrusion areas determined in the region of maximum deviation from spheres (top) and conchoids (bottom). Error bars indicate standard error. At lower deviation thresholds, protrusions for the control group had larger areas than those of the patients. However, at higher thresholds protrusions for the patients outsized those of the controls. Asterisks indicate thresholds at which areas were significantly different between control and cam-type FAI femurs.
Protrusion areas for the control group were significantly larger than that of the patients at lower deviation thresholds (Fig. 6). For the sphere, area differences between controls and patients were significant at deviation thresholds of 0 mm, 0.01 mm, and 0.1 mm (all p ≤0.016). For the conchoid, area differences were significant at thresholds of 0 mm and 0.01 mm (both p ≤ 0.021). At a deviation threshold of 1.0 mm for the sphere and 0.5 mm for the conchoid, the relationship between control and patient protrusion areas was inverted; above these thresholds the areas of patient protrusions were larger (Fig. 6).
Discussion
The purpose of this study was to develop an objective technique to isolate, quantify, and compare 3D femoral head shape between normal subjects and cam-type FAI patients. We determined that patients with cam-type FAI had femoral heads that deviated significantly more from ideal shapes than controls. While this result is to be expected, until now a quantified description of 3D deviations from ideal shapes in cam-type femurs relative to their normal counterparts has not been presented. In addition, to our knowledge, the characteristic features of bony protrusions beyond ideal geometries in normal subjects and patients with cam-type FAI had not been reported. Here, we found the counter-intuitive result that protrusion areas on the control femurs were significantly greater than protrusions on the cam-type FAI femurs. Nonetheless, protrusions on the cam-type FAI femurs were associated with significantly higher maximum deviations, which may be a greater contributor to joint damage and pain than the broad, yet low-lying, protrusions found on the control femurs.
The femurs analyzed in this study deviated from both spheres and rotational conchoids but were more similar to conchoids. This relationship was true for both control and patient femurs as indicated by conchoid fitting errors that were significantly lower than those from sphere-fitting. The better fit to rotational conchoids supports the theoretical findings of another study.31 Thus, when analyzing femoral head shape for surgical planning purposes, the conchoid is likely to give a more accurate indication of deviation from normal than a perfect sphere.
Maximum deviations were significantly smaller for control femurs than for patients. Still, maximum deviations for the control subjects averaged 2.41 mm (sphere-fit) and 1.75 mm (conchoid-fit), suggesting that some level of deviation from any ideal geometry can be expected among normal femurs. This amount of deviation is similar to the 2.8 mm of asphericity found in a prior study of subjects with no evidence of FAI.18 Patient femurs had maximum deviations that were roughly 2.5 times greater than control subjects. Control femurs were also a significantly better fit to both the sphere and the conchoid than were the patients. Hence, when comparing deviations from ideal shapes using either the sphere or the conchoid, measuring maximum deviation and fitting error facilitates a quantifiable distinction between normal and cam-type femurs that may be relevant when determining debridement surgery to treat cam-type FAI.
In this study, the largest deviations from ideal geometries were most often in the anterolateral region. This was an expected result for the patient femurs, as the anterolateral and anterosuperior sections of the femoral head have been identified as the primary locations for cam lesions.23,44 Considering this region also contained the maximum deviation for most control subjects reinforces the conjecture that this area is sensitive to developmental deformities that could result in impingement. Outside the anterolateral region, controls had maximum and mean regional deviations that were generally less, yet not always significantly so, than patients. So, while deviations in the anterolateral region were the most prominent in our study, a cam-type FAI femur may have lesions or deformities throughout the surface of the femoral head.
An interesting phenomenon was observed with respect to the maximum deviation and protrusion area. Although patients had larger maximum deviations than controls, protrusion areas on control subjects were actually greater than that of patients. However, this trend was inverted when deviation thresholds defining a protrusion were raised above 0.5 mm and 1.0 mm for conchoids and spheres, respectively. These results suggest that broad, but smooth/flat, protrusions may be present in normal femurs. In subjects with cam-type FAI, protrusions were more localized with higher maximum deviations. The difference in the shape of the protrusion between control and patient femurs may support the suspected high-pressure, high-shear mechanism of damage that is thought to occur in cam-type FAI hips.21
There were limitations to this study that should be considered when interpreting the findings. First, controls in this study did not have a documented patient history, which limited the clinical characterization of joint health to that of gross observation. Categorization as a control femur relied upon qualifications, including cartilage/subchondral appearance. However, alpha angle and head-neck offset values for the control subjects fell within acceptable ranges for normal femurs.15,39
An additional limitation was that patients were included only if they had radiographic evidence of cam impingement and associated symptoms consistent with FAI. Asymptomatic subjects who may have radiographic cam signs were not included, possibly excluding a sub- section of the FAI population. It has been previously shown that deviation from ideal geometry does not guarantee that a femur will become symptomatic or lead to OA.7,24,34 However, this exclusion provided clarity and distinction when quantifying anatomical differences between cam-type FAI patients and controls.
Another limitation was that the acetabulum and articular cartilage topology were not included in the analysis. While acetabular anatomy may contribute to impingement, this study intentionally focused on patients with deformities primarily on the femoral head. Certainly, when planning surgery to reduce impingement, acetabular orientation and shape should be considered. Articular cartilage may develop in such a way to form a congruent articulating surface between the femur and acetabulum, thereby compensating for minor asphericity of the bone. As such, cartilage topology should be considered, especially intra-operatively, when determining the severity of geometric deviations. However, altered bone geometry is the focus when diagnosing cam-type FAI from CT images and radiographs, not cartilage topology as it is often not available. Thus, for the current study, which serves as a 3D supplement to conventional diagnostic tools, only bony anatomy of the femur was considered. Another limitation is that, because CT image data were segmented semi-automatically, there may be some observer-dependence in the resulting segmentations. However, the accuracy of the segmentation and reconstruction protocols has already been evaluated and found to produce errors minor compared to the degree in which protrusions statistically differed between subject groups in the current study.4,5
A final limitation is that CT arthrography was used on the patients to obtain high- resolution CT images. This procedure is invasive with respect to ionizing radiation. The Food and Drug Administration (FDA) Guidelines for Research Subjects sets an estimated dose equivalent (EDE) limit of 3 rem for a single session and no more than 5 rem annually, equal to that stipulated for employees who utilize radiation as part of their employment. The EDE for our CT arthrogram procedure is 0.969 rem. Therefore, subjects obtained roughly 20% of the annual exposure stipulated by the FDA. In the future, non-invasive methods could be utilized to create 3D reconstructions, such as high-resolution MR imaging.
Surgical correction of cam-type FAI seeks to re-contour the femoral head to improve range of motion and correct deleterious joint contact mechanics.10,16,20,27 Under-correction has been reported to cause persistent pain while over-correction can weaken the femoral head and neck and disrupt vasculature.26,28,38 A-priori knowledge regarding the size and location of cam deformities, such as that provided in Figure 4, may assist surgeons when making pre- or intra- operative decisions. In fact, the methodology presented in this study could provide a basis to develop intra-operative hardware and software to determine, precisely, the location of cam-type deformities that require surgical correction.
While best-fit circles and 2D measures (e.g. alpha angle, head-neck offset) are the reference standard for diagnosing cam-type FAI, they provide a limited view of deformities that occur outside the radiographic projection plane. As such, we recommend the use of 3D reconstructions of the femoral head and subsequent objective quantification of pathoanatomy to characterize the severity of cam-type FAI, especially for those patients having hip pain, but presenting with unimpressive radiographs.29 The 3D methods proposed in this study can be used as a supplement to radiographic diagnostics by clinics that have the ability to make 3D femoral surface reconstructions from CT or MR images. The results of this study suggest that anatomical deviations of up to 2.5 mm from ideal geometries can be expected in normal femurs while deviations of 4 to 5 mm are characteristic of femoral heads that present symptomatic cam-type FAI.
Acknowledgments
Funding for the recruitment and CT scanning of cam-type FAI patients was received through NIH grant #R01AR053344. Procurement and CT scanning of the control femurs was done with funds from a U.S. Department of the Army Award #W81XWH-06-1-0574.
Contributor Information
Michael D. Harris, Department of Orthopaedics, Department of Bioengineering, University of Utah, Salt Lake City, UT 84108.
Shawn P. Reese, Department of Bioengineering, University of Utah, Salt Lake City, UT 84108.
Christopher L. Peters, Department of Orthopaedics, University of Utah School of Medicine, Salt Lake City, UT 84108.
Jeffrey A. Weiss, Department of Bioengineering, Department of Orthopaedics, University of Utah, Salt Lake City, UT 84108.
Andrew E. Anderson, Department of Orthopaedics, Department of Bioengineering, Department of Physical Therapy, University of Utah, Salt Lake City, UT 84108, USA.
References
- 1.Almoussa S, Barton C, Speirs AD, Gofton W, Beaule PE. Computer-assisted correction of cam-type femoroacetabular impingement: A sawbones study. The Journal of bone and joint surgery. American volume. 2011;93(Suppl 2):70–75. doi: 10.2106/JBJS.J.01706. [DOI] [PubMed] [Google Scholar]
- 2.Anda S, Terjesen T, Kvistad KA, Svenningsen S. Acetabular angles and femoral anteversion in dysplastic hips in adults: Ct investigation. Journal of computer assisted tomography. 1991;15:115–120. doi: 10.1097/00004728-199101000-00018. [DOI] [PubMed] [Google Scholar]
- 3.Anderson AE, Ellis BJ, Maas SA, Weiss JA. Effects of idealized joint geometry on finite element predictions of cartilage contact stresses in the hip. Journal of biomechanics. 2010;43:1351–1357. doi: 10.1016/j.jbiomech.2010.01.010. [DOI] [PMC free article] [PubMed] [Google Scholar]
- 4.Anderson AE, Ellis BJ, Peters CL, Weiss JA. Cartilage thickness: Factors influencing multidetector ct measurements in a phantom study. Radiology. 2008;246:133–141. doi: 10.1148/radiol.2461062192. [DOI] [PMC free article] [PubMed] [Google Scholar]
- 5.Anderson AE, Peters CL, Tuttle BD, Weiss JA. Subject-specific finite element model of the pelvis: Development, validation and sensitivity studies. Journal of biomechanical engineering. 2005;127:364–373. doi: 10.1115/1.1894148. [DOI] [PubMed] [Google Scholar]
- 6.Audenaert EA, Baelde N, Huysse W, Vigneron L, Pattyn C. Development of a three-dimensional detection method of cam deformities in femoroacetabular impingement. Skeletal radiology. 2011;40:921–927. doi: 10.1007/s00256-010-1021-2. [DOI] [PubMed] [Google Scholar]
- 7.Audenaert EA, Peeters I, Van Onsem S, Pattyn C. Can we predict the natural course of femoroacetabular impingement? Acta orthopaedica Belgica. 2011;77:188–196. [PubMed] [Google Scholar]
- 8.Barton C, Salineros MJ, Rakhra KS, Beaule PE. Validity of the alpha angle measurement on plain radiographs in the evaluation of cam-type femoroacetabular impingement. Clinical orthopaedics and related research. 2011;469:464–469. doi: 10.1007/s11999-010-1624-x. [DOI] [PMC free article] [PubMed] [Google Scholar]
- 9.Beaule PE, Zaragoza E, Motamedi K, Copelan N, Dorey FJ. Three-dimensional computed tomography of the hip in the assessment of femoroacetabular impingement. Journal of orthopaedic research : official publication of the Orthopaedic Research Society. 2005;23:1286–1292. doi: 10.1016/j.orthres.2005.03.011.1100230608. [DOI] [PubMed] [Google Scholar]
- 10.Byrd JW, Jones KS. Arthroscopic femoroplasty in the management of cam-type femoroacetabular impingement. Clinical orthopaedics and related research. 2009;467:739–746. doi: 10.1007/s11999-008-0659-8. [DOI] [PMC free article] [PubMed] [Google Scholar]
- 11.Carlisle JC, Zebala LP, Shia DS, Hunt D, Morgan PM, Prather H, Wright RW, Steger-May K, Clohisy JC. Reliability of various observers in determining common radiographic parameters of adult hip structural anatomy. The Iowa orthopaedic journal. 2011;31:52–58. [PMC free article] [PubMed] [Google Scholar]
- 12.Cerveri P, Manzotti A, Baroni G. Patient-specific acetabular shape modelling: Comparison among sphere, ellipsoid and conchoid parameterisations. Computer methods in biomechanics and biomedical engineering. 2012 doi: 10.1080/10255842.2012.702765. [DOI] [PubMed] [Google Scholar]
- 13.Clohisy JC, Carlisle JC, Beaule PE, Kim YJ, Trousdale RT, Sierra RJ, Leunig M, Schoenecker PL, Millis MB. A systematic approach to the plain radiographic evaluation of the young adult hip. The Journal of bone and joint surgery American volume. 2008;90(Suppl 4):47–66. doi: 10.2106/JBJS.H.00756. [DOI] [PMC free article] [PubMed] [Google Scholar]
- 14.Clohisy JC, Carlisle JC, Trousdale R, Kim YJ, Beaule PE, Morgan P, Steger-May K, Schoenecker PL, Millis M. Radiographic evaluation of the hip has limited reliability. Clinical orthopaedics and related research. 2009;467:666–675. doi: 10.1007/s11999-008-0626-4. [DOI] [PMC free article] [PubMed] [Google Scholar]
- 15.Clohisy JC, Nunley RM, Otto RJ, Schoenecker PL. The frog-leg lateral radiograph accurately visualized hip cam impingement abnormalities. Clinical orthopaedics and related research. 2007;462:115–121. doi: 10.1097/BLO.0b013e3180f60b53. [DOI] [PubMed] [Google Scholar]
- 16.Clohisy JC, Zebala LP, Nepple JJ, Pashos G. Combined hip arthroscopy and limited open osteochondroplasty for anterior femoroacetabular impingement. The Journal of bone and joint surgery. American volume. 2010;92:1697–1706. doi: 10.2106/JBJS.I.00326. [DOI] [PubMed] [Google Scholar]
- 17.Domayer SE, Ziebarth K, Chan J, Bixby S, Mamisch TC, Kim YJ. Femoroacetabular cam-type impingement: Diagnostic sensitivity and specificity of radiographic views compared to radial mri. European journal of radiology. 2010 doi: 10.1016/j.ejrad.2010.10.016. [DOI] [PubMed] [Google Scholar]
- 18.Dudda M, Albers C, Mamisch TC, Werlen S, Beck M. Do normal radiographs exclude asphericity of the femoral head-neck junction? Clinical orthopaedics and related research. 2009;467:651–659. doi: 10.1007/s11999-008-0617-5. [DOI] [PMC free article] [PubMed] [Google Scholar]
- 19.Eijer H, Leunig M, Mahomed N, Ganz R. Cross table lateral radiographs for screening of anterior femoral head-neck offset in patients with femoro-acetabular impingement. Hip international : the journal of clinical and experimental research on hip pathology and therapy. 2001;11:37–41. [Google Scholar]
- 20.Ganz R, Gill TJ, Gautier E, Ganz K, Krugel N, Berlemann U. Surgical dislocation of the adult hip a technique with full access to the femoral head and acetabulum without the risk of avascular necrosis. The Journal of bone and joint surgery British volume. 2001;83:1119–1124. doi: 10.1302/0301-620x.83b8.11964. [DOI] [PubMed] [Google Scholar]
- 21.Ganz R, Parvizi J, Beck M, Leunig M, Notzli H, Siebenrock KA. Femoroacetabular impingement: A cause for osteoarthritis of the hip. Clinical orthopaedics and related research. 2003:112–120. doi: 10.1097/01.blo.0000096804.78689.c2. [DOI] [PubMed] [Google Scholar]
- 22.Harris WH. Etiology of osteoarthritis of the hip. Clinical orthopaedics and related research. 1986:20–33. [PubMed] [Google Scholar]
- 23.Ito K, Minka MA, 2nd, Leunig M, Werlen S, Ganz R. Femoroacetabular impingement and the cam-effect. A mri-based quantitative anatomical study of the femoral head-neck offset. The Journal of bone and joint surgery British volume. 2001;83:171–176. doi: 10.1302/0301-620x.83b2.11092. [DOI] [PubMed] [Google Scholar]
- 24.Kapron AL, Anderson AE, Aoki SK, Phillips LG, Petron DJ, Toth R, Peters CL. Radiographic prevalence of femoroacetabular impingement in collegiate football players: Aaos exhibit selection. J Bone Joint Surg Am. 2011;93:e111 111–110. doi: 10.2106/JBJS.K.00544. [DOI] [PubMed] [Google Scholar]
- 25.Konan S, Rayan F, Haddad FS. Is the frog lateral plain radiograph a reliable predictor of the alpha angle in femoroacetabular impingement? The Journal of bone and joint surgery British volume. 2010;92:47–50. doi: 10.1302/0301-620X.92B1.22359. [DOI] [PubMed] [Google Scholar]
- 26.Lavigne M, Kalhor M, Beck M, Ganz R, Leunig M. Distribution of vascular foramina around the femoral head and neck junction: Relevance for conservative intracapsular procedures of the hip. The Orthopedic clinics of North America. 2005;36:171–176. viii. doi: 10.1016/j.ocl.2005.02.002. [DOI] [PubMed] [Google Scholar]
- 27.Lavigne M, Parvizi J, Beck M, Siebenrock KA, Ganz R, Leunig M. Anterior femoroacetabular impingement: Part i. Techniques of joint preserving surgery. Clinical orthopaedics and related research. 2004:61–66. [PubMed] [Google Scholar]
- 28.Mardones RM, Gonzalez C, Chen Q, Zobitz M, Kaufman KR, Trousdale RT. Surgical treatment of femoroacetabular impingement: Evaluation of the effect of the size of the resection. Surgical technique. The Journal of bone and joint surgery. American volume. 2006;88(Suppl 1 Pt 1):84–91. doi: 10.2106/JBJS.E.01024. [DOI] [PubMed] [Google Scholar]
- 29.Matsuda DK. The case for cam surveillance: The arthroscopic detection of cam femoroacetabular impingement missed on preoperative imaging and its significance. Arthroscopy : the journal of arthroscopic & related surgery : official publication of the Arthroscopy Association of North America and the International Arthroscopy Association. 2011;27:870–876. doi: 10.1016/j.arthro.2010.12.002. [DOI] [PubMed] [Google Scholar]
- 30.Meermans G, Konan S, Haddad FS, Witt JD. Prevalence of acetabular cartilage lesions and labral tears in femoroacetabular impingement. Acta orthopaedica Belgica. 2010;76:181–188. [PubMed] [Google Scholar]
- 31.Menschik F. The hip joint as a conchoid shape. Journal of biomechanics. 1997;30:971–973. doi: 10.1016/s0021-9290(97)00051-1. [DOI] [PubMed] [Google Scholar]
- 32.Metz CT. Digitally reconstructed radiographs. Utrecht University. 2005;79 [Google Scholar]
- 33.Meyer DC, Beck M, Ellis T, Ganz R, Leunig M. Comparison of six radiographic projections to assess femoral head/neck asphericity. Clinical orthopaedics and related research. 2006;445:181–185. doi: 10.1097/01.blo.0000201168.72388.24. [DOI] [PubMed] [Google Scholar]
- 34.Nepple JJ, Carlisle JC, Nunley RM, Clohisy JC. Clinical and radiographic predictors of intra-articular hip disease in arthroscopy. The American journal of sports medicine. 2011;39:296–303. doi: 10.1177/0363546510384787. [DOI] [PubMed] [Google Scholar]
- 35.Notzli HP, Wyss TF, Stoecklin CH, Schmid MR, Treiber K, Hodler J. The contour of the femoral head-neck junction as a predictor for the risk of anterior impingement. The Journal of bone and joint surgery British volume. 2002;84:556–560. doi: 10.1302/0301-620x.84b4.12014. [DOI] [PubMed] [Google Scholar]
- 36.Pfirrmann CW, Mengiardi B, Dora C, Kalberer F, Zanetti M, Hodler J. Cam and pincer femoroacetabular impingement: Characteristic mr arthrographic findings in 50 patients. Radiology. 2006;240:778–785. doi: 10.1148/radiol.2403050767. [DOI] [PubMed] [Google Scholar]
- 37.Philippon MJ, Maxwell RB, Johnston TL, Schenker M, Briggs KK. Clinical presentation of femoroacetabular impingement. Knee surgery, sports traumatology, arthroscopy : official journal of the ESSKA. 2007;15:1041–1047. doi: 10.1007/s00167-007-0348-2. [DOI] [PubMed] [Google Scholar]
- 38.Philippon MJ, Schenker ML, Briggs KK, Kuppersmith DA, Maxwell RB, Stubbs AJ. Revision hip arthroscopy. The American journal of sports medicine. 2007;35:1918–1921. doi: 10.1177/0363546507305097. [DOI] [PubMed] [Google Scholar]
- 39.Pollard TC, Villar RN, Norton MR, Fern ED, Williams MR, Simpson DJ, Murray DW, Carr AJ. Femoroacetabular impingement and classification of the cam deformity: The reference interval in normal hips. Acta orthopaedica. 2010;81:134–141. doi: 10.3109/17453671003619011. [DOI] [PMC free article] [PubMed] [Google Scholar]
- 40.Rakhra KS, Sheikh AM, Allen D, Beaule PE. Comparison of mri alpha angle measurement planes in femoroacetabular impingement. Clinical orthopaedics and related research. 2009;467:660–665. doi: 10.1007/s11999-008-0627-3. [DOI] [PMC free article] [PubMed] [Google Scholar]
- 41.Rasquinha BJ, Sayani J, Rudan JF, Wood GC, Ellis RE. Articular surface remodeling of the hip after periacetabular osteotomy. International journal of computer assisted radiology and surgery. 2012;7:241–248. doi: 10.1007/s11548-011-0641-x. [DOI] [PubMed] [Google Scholar]
- 42.Ruff CB, Hayes WC. Sex differences in age-related remodeling of the femur and tibia. Journal of orthopaedic research : official publication of the Orthopaedic Research Society. 1988;6:886–896. doi: 10.1002/jor.1100060613. [DOI] [PubMed] [Google Scholar]
- 43.Siebenrock KA, Wahab KH, Werlen S, Kalhor M, Leunig M, Ganz R. Abnormal extension of the femoral head epiphysis as a cause of cam impingement. Clinical orthopaedics and related research. 2004:54–60. doi: 10.1097/00003086-200401000-00010. [DOI] [PubMed] [Google Scholar]
- 44.Tannast M, Goricki D, Beck M, Murphy SB, Siebenrock KA. Hip damage occurs at the zone of femoroacetabular impingement. Clinical orthopaedics and related research. 2008;466:273–280. doi: 10.1007/s11999-007-0061-y. [DOI] [PMC free article] [PubMed] [Google Scholar]
- 45.Tannast M, Kubiak-Langer M, Langlotz F, Puls M, Murphy SB, Siebenrock KA. Noninvasive three-dimensional assessment of femoroacetabular impingement. Journal of orthopaedic research : official publication of the Orthopaedic Research Society. 2007;25:122–131. doi: 10.1002/jor.20309. [DOI] [PubMed] [Google Scholar]
- 46.Tannast M, Siebenrock KA, Anderson SE. femoroacetabular impingement: Radiographic diagnosis--what the radiologist should know. Radiologia. 2008;50:271–284. doi: 10.1016/s0033-8338(08)71986-6. [DOI] [PubMed] [Google Scholar]