

Abstract
A small number of excellent papers on exercise genomics issues have been published in 2012. A new PYGM knock-in mouse model will provide opportunities to investigate the exercise intolerance and very low activity level of people with McArdle disease. New reports on variants in ACTN3 and ACE have increased the level of uncertainty regarding their true role in skeletal muscle metabolism and strength traits. The evidence continues to accumulate on the positive effects of regular physical activity on body mass index (BMI) or adiposity in individuals at risk of obesity as assessed by their FTO genotype or by the number of risk alleles they carry at multiple obesity-susceptibility loci. Serum levels of triglycerides and the risk of hypertriglyceridemia were shown to be influenced by the interactions between a single nucleotide polymorphism (SNP) in the NOS3 gene and physical activity level. Allelic variation at nine SNPs was shown to account for the heritable component of the changes in submaximal exercise heart rate induced by the HERITAGE Family Study exercise program. SNPs at the RBPMS, YWHAQ, and CREB1 loci were found to be particularly strong predictors of the changes in submaximal exercise heart rate. The 2012 review ends with comments on the importance of relying more on experimental data, the urgency of identifying panels of genomic predictors of the response to regular exercise and particularly of adverse responses, and the exciting opportunities offered by recent advances in our understanding of the global architecture of the human genome as reported by the ENCODE project.
Keywords: Genetics, exercise training, physical activity, candidate genes, gene–exercise interaction, single nucleotide polymorphism, quantitative trait locus, genomic predictors
Introduction
This installment of the 2012 exercise genomics review summarizes the most significant papers published in the past calendar year in the area of genomics of exercise, fitness, and performance. The review is not intended to be a comprehensive and cumulative summary of all published literature of the past year in exercise genomics. Rather, the paper focuses only on the strongest studies as evaluated by design, sample size, phenotypes, novelty, and potential impact. The present paper is the fourth annual version of the review of the “scientifically strongest and substantively most important articles in exercise genomics.” As described in the introduction to the first such review (26), a secondary aim of this effort is to help exercise scientists identify the gaps in our knowledge concerning genomics and genetics relative to exercise, fitness, and performance and thereby to provide direction for future investigative efforts and improved study designs.
In this review, we have selected papers focusing on (a) physical activity behavior and exercise intolerance, (b) muscular strength and power, (c) cardiorespiratory fitness and endurance performance, (d) body weight and adiposity, (e) glucose and insulin metabolism phenotypes, (f) lipid and lipoprotein metabolism, and (g) hemodynamic traits.
Physical activity behavior and exercise intolerance
No new major human studies related to the molecular genetics of human physical activity behavior were published in 2012. Likewise, reports dealing with mutations associated with exercise intolerance phenotypes were focused on genes that are already known to cause the trait. However, a genome-wide quantitative trait locus (QTL) screening for wheel-running phenotypes in mice and the first animal model targeting a specific mutation causing McArdle disease were published in 2012. While these animal studies do not address directly the topic of the genomic determinants of physical activity behavior in humans, they make important contributions to the knowledge base that will eventually allow us to design, conduct, and interpret human studies more efficiently. For example, the mouse physical activity QTL study reviewed in the following paragraph will be valuable for the interpretation of the results of large human genome-wide association studies on physical activity and sedentary behavior that are currently in progress.
Leamy and coworkers reported results of genome-wide linkage scans for wheel-running behavior traits in an intercross at generation 10 produced from mouse crosses of inbred strain C57BL/6J with a strain selected for high voluntary wheel running (17). The animals were given access to running wheels at 8 weeks of age, and running distance, time spent running, average speed, and maximum speed were recorded electronically for 6 days. The averages of these four traits measured on days 5 and 6 were used as final phenotypes. A total of 2,058 single nucleotide polymorphisms (SNPs) were used to cover the entire genome. The analyses revealed one QTL for the running behavior traits that reached an experiment-wise statistical significance: chromosome 19 at 17.4–22.0 Mb for running time. In addition, nine other QTLs reached a chromosome-wise level of significance: chromosomes 16 (85.2–90.4 Mb) and 19 (17.4–22.0 Mb) for running distance, chromosomes 16 (86.1–90.4 Mb) and 19 (35.2–48.9 Mb) for average running speed, and chromosomes 2 (149.5–159.4 Mb), 11 (5.9–19.1 Mb), 18 (58.6–63.8 Mb), and 19 (42.1–48.7 Mb and 48.9–55.1 Mb) for maximum running speed. Interestingly, both running time and distance QTLs seemed to be compatible with a dominance genotypic effect, whereas running speed QTLs were following an additive genetic effect pattern. QTLs for running time and distance on chromosome 19, as well as for running distance and average speed on chromosome 16, overlapped, which is not surprising given the strong correlations (r=0.83 and r=0.84, respectively) between these traits. However, it should be noted that none of these QTLs overlapped with those that were observed in generation four intercrosses of the same mouse model (17).
Nogales-Gadea and colleagues reported a knock-in mouse model that carries a R50X (arginine to stop codon) in the first exon of the PYGM (muscle glycogen phosphorylase) gene, a mutation that is commonly found in McArdle disease patients (21). Homozygotes for the mutant allele had undetectable PYGM protein and activity levels in skeletal muscle. Moreover, they exhibited the same histological and biochemical phenotypes as McArdle patients: massive glycogen accumulation in skeletal muscle, high plasma creatine kinase levels, and exercise-induced myoglobinuria. Furthermore, the mutant allele homozygotes performed drastically worse in exercise tests than the wild-type homozygotes and the heterozygotes. In a wire-grip test, all wild-type animals and 73% of the heterozygotes were able to stay on for 180 seconds (max duration of the test), while six of the seven mutant allele homozygotes let go after only 7 seconds. In a treadmill test, the maximum exercise time of the mutant allele homozygote mice was only 29% of the wild-type homozygotes (21). This animal model provides valuable insights into the pathophysiology of McArdle disease. The model helps us to understand why these animals exhibit exercise intolerance and very low levels of activity, and it may be instrumental in the development of novel therapies for patients with this disease.
Muscular strength and power
The year 2012 did not generate a large number of publications in the area of genetics and muscular strength and power phenotypes. Of the papers that were published, the majority had small sample sizes or inconclusive findings, which preclude them from the present review format. Some studies did provide additions to the literature that are worth mentioning, though the discussion will be brief given the generally negative findings of the studies. For example, multiple articles examined the actinin, alpha 3 (ACTN3) R577X polymorphism and the possible importance of the X/X genotype on cellular or metabolic aspects of skeletal muscle. Vincent et al. (35) observed no significant association of ACTN3 genotype with metabolic characteristics of skeletal muscle fibers taken from human vastus lateralis samples, contrary to what has been reported in the Actn3 knockout mouse (19, 20). A detailed analysis of skeletal muscle fibers taken from three men (R/R, R/X, and X/X genotypes, respectively) with spinal cord injury revealed lower unloaded shortening velocity and higher fiber elasticity in the X/X genotype, but no genotype differences in peak force (6). In a study of 81 octogenarians, neither ACTN3 nor the angiotensin I converting enzyme 1 (ACE) I/D polymorphisms were associated with any measures of muscle strength or mass (11). Finally, a study examining the influence of testosterone and the androgen receptor gene (AR) CAG repeat polymorphism in 183 young and older men revealed that only free testosterone, but not total testosterone or the AR CAG repeat, was associated with knee extensor muscle strength (10). In summary, the findings in 2012 reveal less clarity in our understanding of the influences of specific genes on skeletal muscle strength-related traits.
Cardiorespiratory fitness and endurance performance
In 2012, only a few papers were published on genetic variations in cardiorespiratory fitness and endurance performance phenotypes, and they were typically based on case-control studies. One study tested the association of elite athlete status and the ACTN3 R577X polymorphism in 278 endurance athletes and 355 power athletes from Spain, Russia, and Poland and 808 nonathlete controls (9). In a subanalysis of the endurance athletes, the odds ratio (OR) of a “world-class” athlete having the XX genotype versus the RR+RX genotype was 3.74 compared with “national” level athletes (P=0.038). Other differences were observed, but since the threshold p-value for statistical significance was not adjusted for multiple comparisons, it is likely that none of them was truly significant. On the positive side, it is encouraging that we are now beginning to see studies undertaken with larger sample sizes, although they remain small compared to the sample sizes needed in order to rule out spurious results (2).
One report based on the HERITAGE Family Study focused on the response to an exercise program of submaximal exercise capacity as measured by the power output, oxygen uptake, and cardiac output associated with 60% of VO2max, a clinically relevant parameter in the context of exercise prescription and physical activity promotion (28). Based on the data from 475 Caucasians from 99 families, a genome-wide linkage analysis identified a QTL on chromosome 13q12 for indicators of submaximal exercise capacity, with the strongest evidence being for the training-induced changes in VO2 at 60% of max or ΔVO260. A 7.9 Mb region harboring this QTL was investigated using a dense set of about 1,800 SNPs. Because the single-SNP results were inconclusive in terms of strongly implicating any particular region or gene association with ΔVO260, several haplotypes were analyzed using a sliding window procedure. These analyses revealed some strong haplotype associations, with p-values < 0.0001, in regions encoding the ATPase aminophospholipid transporter, class 1, type 8A, member 2 gene (ATP8A2) and the GS homeobox protein 1 gene (GSX1). The target region was further narrowed to the potential biological candidate genes mitochondrial intermediate peptidase (MIPEP) and sarcoglycan, gamma (35kDa dystrophin-associated glycoprotein) (SGCG). The magnitude of the effect on ΔVO260 was determined using stepwise regression analysis. The final model included 13 single SNPs and haplotypes which accounted for about 20% of the variance in ΔVO260. Considering that submaximal exercise capacity at 60% of VO2max falls well within the current recommendations of the Physical Activity Guidelines for Americans (33), these new genomic targets should be further investigated to establish their true relevance for targeted exercise recommendations in the context of personalized exercise medicine.
One study attempted to verify whether the rs6552828 polymorphism in the acyl-coenzyme A synthetase long-chain family member 1 gene (ACSL1), which had been identified as a strong marker of VO2max trainability in a genome-wide association study (GWAS) report (4), was associated with elite endurance athlete status (39). A marginal association was observed in Chinese male athletes but not in females or in male athletes from Spain. The generally negative findings could be related to the low statistical power but more likely to the major differences between the two traits (i.e., VO2max trainability in sedentary individuals versus elite endurance athlete status), although there is undoubtedly a relationship between them at some point in time in the development of the athlete.
Another study dealing with training-induced changes was conducted by Dhamrait and coworkers (7).They investigated the influence of uncoupling protein 2 (UCP2) and 3 (UCP3) polymorphisms on training-related changes in two different cohorts undergoing controlled physical training sessions. The phenotype of interest was delta efficiency (DE), which is a measure of skeletal muscle contraction efficiency, defined as the ratio of external work performed to the internal energy expenditure. About 60 subjects completed the training sessions, and they showed a significant increase in DE (P=0.01) compared with baseline. The UCP2 866G>A variant was nominally associated (P=0.03) with the DE response to training. In addition, multivariate analysis showed a significant gene–gene interaction between the UCP2 8ggG>A and UCP3 55C>T genotypes on changes in DE (p-value for interaction =0.003). Further research is needed to confirm that sequence variants in the UCP2 and UCP3 genes are associated with training-related improvements in DE. Work efficiency has been seldom considered, if at all, in genetic studies. However, it is an important topic for future endeavors, as exercise training has the potential to increase not only work-related power and capacity, but is also known to reduce the energy cost at a given workload and thus improve work efficiency.
Body weight and adiposity
While 2009 and, in particular, 2010 were marked by a substantial increase in the number of loci associated with obesity-related traits, the discovery of new loci identified through GWAS has slowed down in the past 2 years. This does not mean a general leveling off in the number of loci to be identified for obesity-related traits, but rather reflects the extent of ongoing efforts by the various consortia. Nevertheless, several new loci were reported in 2012, bringing the total of obesity-related trait loci to 60. In brief, two large-scale GWAS for BMI in East Asian populations identified four loci (22, 36), three additional BMI-associated loci were identified using a gene-centric array that captured genetic variation of ∼2,100 metabolic- and cardiovascular-related genes (12), and the first large-scale GWAS in children reported four new loci for common childhood obesity (5).
In the past three reviews, we have highlighted the growing evidence supporting the notion that these genetic loci interact with daily physical activity in their causal pathway to obesity (13, 26, 29). More specifically, the genetic susceptibility to obesity was found to be 30% to 40% lower in individuals who are physically active compared to those who are sedentary. The evidence has been particularly convincing for the fat mass and obesity associated gene(FTO) as a single locus (16) and for genetic susceptibility to obesity assessed as a score based on a combination of multiple loci (18). In 2012, no large-scale studies reported new findings on gene–physical activity interactions, but previous observations were further confirmed. In a study that combined data of 7,740 women from the Nurses' Health Study (NHS) and 4,564 men from the Health Professionals Follow-up Study (HPFS), the genetic susceptibility to obesity, assessed with a genetic risk score based on 32 BMI loci, was significantly higher the more individuals spent time watching TV, in particular among those who watched TV for >40 hours per week (24). The same study also confirmed that higher physical activity levels attenuated the genetic susceptibility to obesity (24).
While these studies emphasize the beneficial effect of physical activity, findings from recent studies suggest that other lifestyle factors may also influence the genetic susceptibility to obesity. For example, using the data from the NHS and HPFS mentioned earlier, it was shown that the genetic susceptibility to obesity was significantly more pronounced when individuals reported a greater intake of sugar-sweetened beverages, which was replicated using data from 21,740 women of the Women's Genome Health Study (WGHS) (23). Another study examined the whole genome in a meta-analysis of about 170,000 individuals for association with “BMI variability,” assuming that variability reflects sensitivity to environmental influences (38). FTO was the only locus identified as having such an effect; i.e., it was shown that the known BMI-increasing FTO allele was also associated with greater variability in BMI, consistent with FTO's reported sensitivity to environmental factors (38). Several other, yet smaller, studies have reported corroborating observations for dietary components and other lifestyle factors influencing the genetic susceptibility to obesity, with an overrepresentation of papers on FTO. Taken together, while there is evidence that physical activity attenuates the genetic susceptibility to obesity when compared to a sedentary lifestyle, recent observations suggest that other lifestyle factors have similar effects. Further analyses will be needed to disentangle which lifestyle factors exert the actual effect on the genetic susceptibility or whether it is caused by a “healthy lifestyle” in general.
So far, the majority of studies have focused either on the FTO locus or on genetic risk scores based on several loci combined, whereas few studies have reported on the influence of physical activity on the effect of other single obesity-susceptibility loci. While studying a combination of loci allows for potential public health applications, the exploration of single loci may provide insights on biological mechanisms. Furthermore, as of yet, neither animal nor human studies have found evidence for any of the obesity-susceptibility loci to directly affect physical activity levels as such.
Insulin and glucose metabolism phenotypes
Few major studies were published in 2012 showing evidence of gene–exercise or gene–physical activity interactions for insulin and glucose metabolism phenotypes. The only study that provided evidence of gene–exercise interaction found that the response of muscle ATP synthesis to 26 weeks of exercise training in relatives of type 2 diabetic subjects was associated with a polymorphism in the NDUFB6 gene encoding a subunit of complex I of the respiratory chain (15). In a larger case-control (n=1,019 and n=1,709,respectively) study of middle-aged Chinese women, 39 SNPs in the peroxisome proliferator-activated receptor delta gene (PPARD) were investigated for association with type 2 diabetes in interaction with exercise participation (34). No evidence of interaction between PPARD polymorphisms and exercise participation was observed. Despite its negative findings, this study is worth reporting because of its large sample size and its excellent coverage (91%) of the genetic variation in the PPARD gene.
Lipid and lipoprotein metabolism
The year 2012 was a quiet one in terms of genetic studies involving lipids and physical activity, with the exception of one study with a reasonable sample size that examined gene–physical activity interactions on serum triglyceride levels in a Japanese population. Higashibata et al. examined the association of the nitric oxide synthase 3 (NOS3) T-786C polymorphism (rs2070744) with serum triglyceride levels (measured after a minimum 2-hour fast) and leisure-time physical activity, as assessed by the International Physical Activity Questionnaire (IPAQ), using cross-sectional data from 2,226 participants of the Japan Multi-Institutional Collaborative Cohort (J-MICC) Study (14). In stratified analyses, the adjusted risk of hypertriglyceridemia (defined as serum triglyceride levels≥1.69 mmol/L [150 mg/dL]) was significantly lower among subjects with the C allele (19%) than those without it in the active group (≥600 MET-minutes/week, N=877), but not the sedentary group (<600 MET-minutes/week, N=1349) in the total sample (OR=0.49, 95% CI=0.31–0.80; P=0.01 for interaction) and the fasting samples (≥12 hours) -only group (N=1417, OR=0.43, 95% CI=0.22–0.84; P=0.007 for interaction) (14). Serum triglyceride levels were significantly lower in physically active individuals in the combined TC+CC genotype group (1.25±0.68 mmol/L or 111±60 mg/dL for sedentary, 1.07±0.54 mmol/L or 95±48 mg/dL for moderately active, 0.99±0.50 mmol/L or 88±44 mg/dL for very active; P for trend = 0.008 in the fasting group), but not in the TT homozygotes.
An obvious limitation of this study is that it included only one NOS3 polymorphism. Recent meta-analyses of GWAS have identified over 24 loci associated with fasting triglyceride levels, which together explain about 10% of the total trait variance (32). Furthermore, it is important to note that the minor allele frequency of the NOS3 -786C C allele in the Japanese population (10%) is much lower than that found in Caucasians (∼40%).
Hemodynamic traits
In 2012, one publication made important contributions to the genetic basis for cardiovascular response to exercise training (27). Rankinen and coworkers (27) investigated the SNPs responsible for the interindividual variation in changes in heart rate (HR) during submaximal exercise in response to endurance exercise training in the HERITAGE cohort of 472 white subjects. A reduced HR response to a submaximal exercise work rate is clearly a classic adaptation elicited by endurance exercise training. In a previous paper, this group reported that the HERITAGE cohort had reduced its HR response to a 50 watt cycle ergometer work rate by an average of 11 beats per minute as a result of 20 weeks of endurance training (37). However, the interindividual variation around this average response was substantial, with a range from a 12 beats per minute increase to a 42 beats per minute decrease. Additional data from HERITAGE also indicated that this training-induced HR adaptation aggregated in families, with the maximal heritability estimate being 34% (1).
In a prior study, they had performed a linkage exploration with 701 polymorphic markers spread across the entire genome and identified a 2q34 locus as being significantly linked with the change in submaximal exercise HR in response to training (31). They then followed this up with a more in-depth investigation of this locus and found that a common variant in the cAMP responsive element binding protein 1 gene (CREB1) accounted for ∼4% of the variance in the submaximal exercise HR response to training (25). However, since their previous finding indicated that heritability, i.e., genetic factors, accounted for 34% of the interindividual variation in this response, this still left ∼30% of the variation resulting from genetics unaccounted for, even after considering the CREB1 locus. Thus, to further refine the genetic basis of this response, in the2012 study, they performed a GWAS using ∼320,000 SNPs to identify additional loci associated with the submaximal exercise HR response to endurance exercise training. Their results across the 22 autosomes are presented in Figure 1. They found 40 individual SNPs that were associated with the HR response (all P<9.9 × 10⁻⁵). The two SNPs most closely associated with the training-induced submaximal exercise HR changes were both on chromosome 2p25, within the tyrosine 3-monooxygenase/tryptophan 5-monooxygenase activation protein, theta polypeptide gene (YWHAQ) locus, with both again being highly statistically significant (both P<1.2 × 10⁻⁶).
Figure 1.
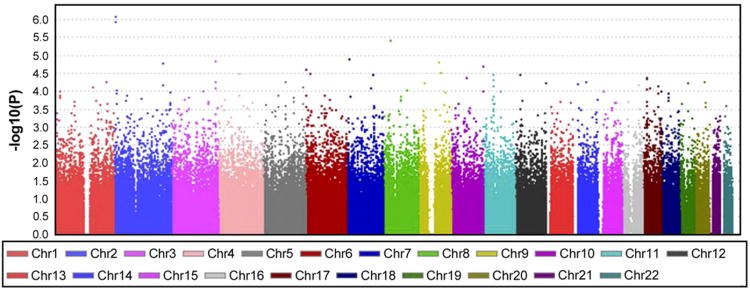
Manhattan plot of heart rate during steady-state submaximal exercise at 50 watts training response genome-wide association study (GWAS) results across the 22 autosomes.
Reproduced from Rankinen et al., J Appl Physiol, 2012 (27)
They then extended their analyses to higher levels of regression and genetic analyses and found that nine SNPs, including the previous CREB1 locus, RBPMS (RNA binding protein with multiple splicing), and one of the YWHAQ loci, accounted for all of the heritable interindividual variability of this response to endurance exercise training, with six SNPs each accounting for 3% to 6% of the variability and another three SNPs each accounting for 2% to 3% of the variability. They created a SNP summary score based on the number of “favorable” alleles an individual carried at these nineloci, i.e., those that resulted in a greater training-induced reduction in submaximal exercise HR (Figure 2), and found that individuals carrying less than 10 of these alleles did not reduce their submaximal exercise HR with training, while those with more than 15 favorable alleles elicited an average HR reduction of ∼20 beats per minute as a result of exercise training.
Figure 2.

Exercise training-induced changes in heart rate (HR) at 50 watts (adjusted for age, sex, BMI, and initial HR response) across eight genome-wide association study (GWAS) SNP summary score categories in white subjects from the HERITAGE Family Study. Number of participants within each category is indicated inside or below each box.
Reproduced from Rankinen et al., J Appl Physiol, 2012 (27)
Overall, this study identified novel genetic variations associated with the response of submaximal exercise HR to exercise training. Without an unbiased genome-wide exploration, it is highly unlikely that anyone would have ever a priori selected YWHAQ and RBPMS or CREB1 as candidate genes to investigate these cardiovascular adaptations. Further studies are now required to assess whether these are simply fortuitous associations or whether there is truly a functional cause-and-effect relationship between these variants and training-induced HR response adaptations. Also, these results still require replication in other independent cohorts. Such replication studies are difficult, costly, and time-consuming to perform, as one clearly needs large numbers of participants studied prior to and following a prolonged and highly standardized endurance exercise training intervention. Such large sample sizes are necessary to have the appropriate power to be able to detect associations with genetic loci responsible for 2% to 3% of the interindividual variation in this training adaptation, a percentage that translates into accounting for differences in training adaptations of less than 1 beat per minute in the case of the present study.
Comments and Summary
Observational versus experimental
Even though the increasing reliance on unbiased genome-wide screens is clearly a strength, we again note that the vast majority of exercise genomics studies (defined in a broad sense), including many that have not been reviewed herein, reported in 2012 are observational. We have previously argued that it would be beneficial for the field to develop a complementary portfolio of large intervention studies or highly targeted experiments anchored on Mendelian randomization. We again emphasize that it would be advantageous if more studies with appropriate designs and statistical power were undertaken using the latest genomics technologies in sequencing and genotyping, combined with and incorporating evidence from epigenomics, transcriptomics, proteomics, and metabolomics.
Personalized medicine and adverse responses
One of the overarching aims of exercise genomics is to eventually be able to define panels of genomic markers, which by themselves or in combination with other biomarkers (including epigenomic and metabolomic markers) would make it possible to predict the benefits to be derived from an exercise program or a physically active lifestyle. For example, exercise medicine practitioners would find it useful to be able to determine a priori whether a given individual with a high normal resting systolic blood pressure can expect large, moderate, small, or no change in blood pressure with a moderate-intensity exercise program, as it is by now well documented that there are considerable differences in responsiveness. Such a capability would have an enormous impact on our ability to individualize exercise medicine for preventive or therapeutic purposes. It would also make it possible for exercise medicine to become a full partner in the emerging personalized medicine enterprise. In this regard, one of the most urgent tasks is to identify genomic and other biomarkers that would make it possible to screen for adverse response patterns to regular exercise.
This sense of urgency is fueled by a recent paper which provided evidence that some individuals exhibit adverse responses to regular exercise in cardiovascular disease and diabetes risk factors (3). An adverse response was defined as an exercise program-induced change that worsens a risk factor beyond measurement error and expected day-to-day variation. Based on that definition and using data from six well-characterized exercise intervention studies encompassing almost 1,700 subjects, the proportion of participants that experienced adverse responses ranged from 8% for the changes in fasting insulin to 13% for the changes in HDL-cholesterol. As shown in Table 1, when four common cardiovascular and diabetes risk factors were considered, 31% of the completers in these six intervention studies experienced at least one adverse response to the exercise program to which they were exposed. Of great importance, about 7% of the participants registered adverse responses for at least two of these four common risk factors. Being able to identify a priori the individuals at risk for adverse responses would allow them to be directed to other intervention modalities (such as pharmacological, dietary, or weight loss, if appropriate) in order to improve the targeted risk factor. Based on the exercise genomics body of literature, we speculate that genetic factors are likely involved in deleterious patterns of response to regular exercise. Although no genomic predictors of adverse responses have been found to date, it is of the utmost importance to develop such resources as soon as possible.
Table 1. Percentage of Subjects in Each Study with 1, 2, or 3 and More Adverse Responses.
| 1 Adverse Response | 2 Adverse Responses | 3 or 4 Adverse Responses | ||||
|---|---|---|---|---|---|---|
|
| ||||||
| N | % | N | % | N | % | |
| HERITAGE | ||||||
| Blacks | 51 | 20% | 11 | 4% | 0 | 0% |
| Whites | 94 | 20% | 17 | 4% | 3 | 1% |
| DREW | 131 | 40% | 37 | 11% | 9 | 3% |
| INFLAME | 32 | 46% | 9 | 13% | 1 | 1% |
| STRRIDE | 71 | 24% | 9 | 3% | 0 | 0% |
| MARYLAND | 54 | 34% | 5 | 3% | 0 | 0% |
| JYVASKYLA | 35 | 33% | 7 | 7% | 0 | 0% |
| TOTALS (mean %) | 468 | 31% | 95 | 6% | 13 | 0.8% |
The four traits considered were the exercise training-induced changes in fasting insulin, HDL-cholesterol, triglycerides, and resting systolic blood pressure. Adverse responses were defined as follows: increases in fasting insulin of ≥ 24 pmol/L, increases in triglycerides of ≥ 0.42 mmol/L, increases in systolic blood pressure of ≥ 10 mm Hg, or decreases in HDL-cholesterol of 0.12 mmol/L and more. To convert pmol/L of insulin to mU/L, divide by 6.945. To convert mmol/L of HDL-C to mg/dL, divide by 0.02586. To convert mmol/L of triglycerides to mg/dl, divide by 0.01129.
Reproduced from Bouchard et al, PLoS One, 2012 (3)
Encyclopedia of DNA Elements (ENCODE)
One of the surprises of the first annotated version of the sequenced human genome in the late 1990s was the presence of only a relatively small number of genes along with an apparent large fraction of noncoding DNA, which was referred to at times as “junk DNA.” However, it was obvious that the human genome is much more complex than the number of individual genes led us to believe. Although it was already known that some “gene desert areas” actually harbored functionally relevant elements (enhancers, repressors, microRNAs, etc.), it remained unclear how common such regulatory elements are and what their distribution across the genome is. To clarify these questions, the Encyclopedia of DNA Elements (ENCODE) research consortium was created in September 2003 by the National Human Genome Research Institute (NHGRI), with the goal of delineating all functional elements encoded in the human genome. After a 4-year pilot phase, full-scale data production and analysis started in 2007, and the first comprehensive set of results was published in September 2012 (8).Details of the ENCODE study designs and methods, as well as the first reported results, are available at the NHGRI ENCODE Website (https://www.genome.gov/10005107) and at www.nature.com/encode. The ENCODE data are already incorporated into several popular genome browsers (e.g., UCSC Genome Browser at http://genome.ucsc.edu/).
The dominant finding is that over 80% of the human genome is transcribed and is involved in at least one biochemical RNA- and/or chromatin-associated event in at least one of the 147 cell types tested (8). Moreover, about 95% of the genome is within 8 kb of a DNA-protein interaction, and 99% is located within 1.7kb of at least one of the biochemical events assayed in ENCODE. Almost 3 million DNA protein-binding sites have been identified. More than 8,800 small RNAs and 9,600 long RNAs are transcribed in the human genome. The more than 1,500 transcription factors that have been uncovered bind to 8% of the genome. Strikingly, the human genome harbors more than 70,000 promoter regions and more than 400,000 enhancer sequences that interact with other factors to regulate the expression of the 20,687 genes currently recognized as encoded in the human genome. Thus, these observations clearly indicate that there is no such thing as “junk DNA” in the human genome. A complex network of transcription factors, DNA binding sites, promoter, enhancer, and suppressor regions, various populations of RNAs, and epigenetic events come into play to regulate the expression of protein-encoding genes.
While the majority of the novel information generated by the ENCODE consortium deals with epigenetic mechanisms, these data will also greatly benefit DNA sequence variation research in general and exercise genomics in particular. Many noncoding DNA sequence variants are located within the ENCODE-annotated functional regions, and the number of such variants is at least as large as those that lie in protein-coding genes. Also, disease-associated SNPs identified by GWAS are abundant among noncoding functional elements (8, 30). Thus, out of a total of 4,724 SNPs associated with 470 different traits from the NHGRI GWAS catalog, almost 45% of these SNPs overlap with newly defined ENCODE regions. When linkage disequilibrium data (r2≥0.80 in all four HapMap 2 populations) were incorporated in the analyses, the proportion of functional SNPs increased to 58%. When the same analysis was repeated in Caucasians only, about 81% of the GWAS-derived SNPs were either functional or in strong linkage disequilibrium with functional SNPs (30). These data have great potential to guide the interpretation of the GWAS results and to facilitate studies to uncover the functional links between sequence variants and disease and other traits. These newly and publicly available ENCODE resources should be very useful for future exercise-related genomics studies.
In summary, only a small number of papers on exercise genomics issues published in 2012 were deemed sufficiently excellent to be reviewed herein. A recently developed PYGM knock-in mouse model may be helpful for future research designed to understand the exercise intolerance and very low activity level of people with McArdle disease. Variants in ACTN3 and ACE genes were recently revisited in new publications, and the findings have increased the level of uncertainty regarding their true role in skeletal muscle metabolism and muscle strength traits. Based on large observational genomics studies, the evidence continues to accumulate for the positive effects of regular physical activity on BMI or adiposity in individuals at risk of obesity as assessed by their FTO genotype or by the number of risk alleles they carry at multiple obesity-susceptibility loci. Moreover, this modulation of the genetic susceptibility risk on obesity-related traits appears to be driven not only by physical activity but also by dietary factors. In one observational study, serum levels of triglycerides and the risk of hypertriglyceridemia were shown to be influenced by the interactions between a SNP in the NOS3 gene and physical activity level. Allelic variation at nine SNPs were shown to account for the heritable component of the changes in exercise HR at a low power output (50 watts) induced by the HERITAGE Family Study exercise program. SNPs at the RBPMS, YWHAQ, and CREB1 loci were found to be particularly strong predictors of the changes in submaximal exercise HR. The 2012 review ends with comments on three important topics: the importance of relying more in the future on data from controlled experimental interventions as opposed to observational exercise genomics designs; the urgency of identifying panels of genomic predictors of the response to regular exercise, and particularly of adverse response traits, in order to provide a stronger foundation for the growing field of exercise preventive and therapeutic medicine; and the exciting opportunities offered to exercise genomics by recent advances in our understanding of the global architecture of the human genome as reported by the ENCODE project.
Acknowledgments
The authors would like to express their gratitude to Ms. Allison Templet for her assistance with the preparation of the final version of the manuscript.
CB and TR are funded by the National Institutes of Health (HL-45670). CB is partially funded by the John W. Barton, Sr. Chair in Genetics and Nutrition.
The results of the present study do not constitute endorsement by the American College of Sports Medicine.
Footnotes
Conflict of Interest: CB is an adviser to Weight Watchers International and NIKE SPARQ and a consultant to Pathway Genomics. The other authors have no conflicts of interest to disclose.
Publisher's Disclaimer: This is a PDF file of an unedited manuscript that has been accepted for publication. As a service to our customers we are providing this early version of the manuscript. The manuscript will undergo copyediting, typesetting, and review of the resulting proof before it is published in its final citable form. Please note that during the production process errors may be discovered which could affect the content, and all legal disclaimers that apply to the journal pertain.
References
- 1.An P, Perusse L, Rankinen T, et al. Familial aggregation of exercise heart rate and blood pressure in response to 20 weeks of endurance training: the HERITAGE family study. Int J Sports Med. 2003;24(1):57–62. doi: 10.1055/s-2003-37200. [DOI] [PubMed] [Google Scholar]
- 2.Bouchard C. Overcoming barriers to progress in exercise genomics. Exerc Sport Sci Rev. 2011;39(4):212–7. doi: 10.1097/JES.0b013e31822643f6. [DOI] [PMC free article] [PubMed] [Google Scholar]
- 3.Bouchard C, Blair SN, Church TS, et al. Adverse metabolic response to regular exercise: is it a rare or common occurrence? PLoS ONE. 2012;7(5):e37887. doi: 10.1371/journal.pone.0037887. [DOI] [PMC free article] [PubMed] [Google Scholar]
- 4.Bouchard C, Sarzynski MA, Rice TK, et al. Genomic predictors of the maximal O(2) uptake response to standardized exercise training programs. J Appl Physiol. 2011;110(5):1160–70. doi: 10.1152/japplphysiol.00973.2010. [DOI] [PMC free article] [PubMed] [Google Scholar]
- 5.Bradfield JP, Taal HR, Timpson NJ, et al. A genome-wide association meta-analysis identifies new childhood obesity loci. Nat Genet. 2012;44(5):526–31. doi: 10.1038/ng.2247. [DOI] [PMC free article] [PubMed] [Google Scholar]
- 6.Broos S, Malisoux L, Theisen D, Francaux M, Deldicque L, Thomis MA. Role of Alpha-actinin-3 in Contractile Properties of Human Single Muscle Fibers: A Case Series Study in Paraplegics. PLoS ONE. 2012;7(11):e49281. doi: 10.1371/journal.pone.0049281. [DOI] [PMC free article] [PubMed] [Google Scholar]
- 7.Dhamrait SS, Williams AG, Day SH, et al. Variation in the uncoupling protein 2 and 3 genes and human performance. J Appl Physiol. 2012;112(7):1122–7. doi: 10.1152/japplphysiol.00766.2011. [DOI] [PMC free article] [PubMed] [Google Scholar]
- 8.Dunham I, Kundaje A, Aldred SF, et al. An integrated encyclopedia of DNA elements in the human genome. Nature. 2012;489(7414):57–74. doi: 10.1038/nature11247. [DOI] [PMC free article] [PubMed] [Google Scholar]
- 9.Eynon N, Ruiz JR, Femia P, et al. The ACTN3 R577X polymorphism across three groups of elite male European athletes. PLoS ONE. 2012;7(8):e43132. doi: 10.1371/journal.pone.0043132. [DOI] [PMC free article] [PubMed] [Google Scholar]
- 10.Folland JP, Mc Cauley TM, Phypers C, Hanson B, Mastana SS. The relationship of testosterone and AR CAG repeat genotype with knee extensor muscle function of young and older men. Exp Gerontol. 2012;47(6):437–43. doi: 10.1016/j.exger.2012.03.013. [DOI] [PubMed] [Google Scholar]
- 11.Garatachea N, Fiuza-Luces C, Torres-Luque G, et al. Single and combined influence of ACE and ACTN3 genotypes on muscle phenotypes in octogenarians. Eur J Appl Physiol. 2012;112(7):2409–20. doi: 10.1007/s00421-011-2217-4. [DOI] [PubMed] [Google Scholar]
- 12.Guo Y, Lanktree MB, Taylor KC, Hakonsarson H, Lange LA, Keating BJ. Gene-centric meta-analyses of 108 912 individuals confirm known body mass index loci and reveal three novel signals. Hum Mol Genet. 2013;22(1):184–201. doi: 10.1093/hmg/dds396. [DOI] [PMC free article] [PubMed] [Google Scholar]
- 13.Hagberg JM, Rankinen T, Loos RJF, Perusse L, Roth SM, Wolfarth B, Bouchard C. Advances in exercise, fitness, and performance genomics in 2010. Med Sci Sports Exerc. 2011;43(5):743–52. doi: 10.1249/MSS.0b013e3182155d21. [DOI] [PMC free article] [PubMed] [Google Scholar]
- 14.Higashibata T, Hamajima N, Naito M, et al. eNOS genotype modifies the effect of leisure-time physical activity on serum triglyceride levels in a Japanese population. Lipids Health Dis. 2012;11(1):150. doi: 10.1186/1476-511X-11-150. [DOI] [PMC free article] [PubMed] [Google Scholar]
- 15.Kacerovsky-Bielesz G, Kacerovsky M, Chmelik M, et al. A single nucleotide polymorphism associates with the response of muscle ATP synthesis to long-term exercise training in relatives of type 2 diabetic humans. Diabetes Care. 2012;35(2):350–7. doi: 10.2337/dc11-1426. [DOI] [PMC free article] [PubMed] [Google Scholar]
- 16.Kilpelainen TO, Qi L, Brage S, et al. Physical activity attenuates the influence of FTO variants on obesity risk: a meta-analysis of 218,166 adults and 19,268 children. PLoS Med. 2011;8(11):e1001116. doi: 10.1371/journal.pmed.1001116. [DOI] [PMC free article] [PubMed] [Google Scholar]
- 17.Leamy LJ, Kelly SA, Hua K, Pomp D. Exercise and diet affect quantitative trait loci for body weight and composition traits in an advanced intercross population of mice. Physiol Genomics. 2012;44(23):1141–53. doi: 10.1152/physiolgenomics.00115.2012. [DOI] [PMC free article] [PubMed] [Google Scholar]
- 18.Li S, Zhao JH, Luan Ja, et al. Physical activity attenuates the genetic predisposition to obesity in 20,000 men and women from EPIC-Norfolk Prospective Population Study. PLoS Med. 2010;7(8):e1000332. doi: 10.1371/journal.pmed.1000332. [DOI] [PMC free article] [PubMed] [Google Scholar]
- 19.MacArthur DG, Seto JT, Chan S, et al. An Actn3 knockout mouse provides mechanistic insights into the association between alpha-actinin-3 deficiency and human athletic performance. Hum Mol Genet. 2008;17(8):1076–86. doi: 10.1093/hmg/ddm380. [DOI] [PubMed] [Google Scholar]
- 20.MacArthur DG, Seto JT, Raftery JM, et al. Loss of ACTN3 gene function alters mouse muscle metabolism and shows evidence of positive selection in humans. Nat Genet. 2007;39(10):1261–5. doi: 10.1038/ng2122. [DOI] [PubMed] [Google Scholar]
- 21.Nogales-Gadea G, Pinos T, Lucia A, et al. Knock-in mice for the R50X mutation in the PYGM gene present with McArdle disease. Brain. 2012;135(Pt 7):2048–57. doi: 10.1093/brain/aws141. [DOI] [PubMed] [Google Scholar]
- 22.Okada Y, Kubo M, Ohmiya H, et al. Common variants at CDKAL1 and KLF9 are associated with body mass index in east Asian populations. Nat Genet. 2012;44(3):302–6. doi: 10.1038/ng.1086. [DOI] [PMC free article] [PubMed] [Google Scholar]
- 23.Qi Q, Chu AY, Kang JH, et al. Sugar-sweetened beverages and genetic risk of obesity. N Engl J Med. 2012;367(15):1387–96. doi: 10.1056/NEJMoa1203039. [DOI] [PMC free article] [PubMed] [Google Scholar]
- 24.Qi Q, Li Y, Chomistek AK, et al. Television watching, leisure time physical activity, and the genetic predisposition in relation to body mass index in women and men. Circulation. 2012;126(15):1821–7. doi: 10.1161/CIRCULATIONAHA.112.098061. [DOI] [PMC free article] [PubMed] [Google Scholar]
- 25.Rankinen T, Argyropoulos G, Rice T, Rao DC, Bouchard C. CREB1 is a strong genetic predictor of the variation in exercise heart rate response to regular exercise: the HERITAGE Family Study. Circ Cardiovasc Genet. 2010;3(3):294–9. doi: 10.1161/CIRCGENETICS.109.925644. [DOI] [PMC free article] [PubMed] [Google Scholar]
- 26.Rankinen T, Roth SM, Bray MS, et al. Advances in exercise, fitness, and performance genomics. Med Sci Sports Exerc. 2010;42(5):835–46. doi: 10.1249/MSS.0b013e3181d86cec. [DOI] [PubMed] [Google Scholar]
- 27.Rankinen T, Sung YJ, Sarzynski MA, Rice TK, Rao DC, Bouchard C. Heritability of submaximal exercise heart rate response to exercise training is accounted for by nine SNPs. J Appl Physiol. 2012;112(5):892–7. doi: 10.1152/japplphysiol.01287.2011. [DOI] [PMC free article] [PubMed] [Google Scholar]
- 28.Rice TK, Sarzynski MA, Sung YJ, et al. Fine mapping of a QTL on chromosome 13 for submaximal exercise capacity training response: the HERITAGE Family Study. Eur J Appl Physiol. 2012;112(8):2969–78. doi: 10.1007/s00421-011-2274-8. [DOI] [PMC free article] [PubMed] [Google Scholar]
- 29.Roth SM, Rankinen T, Hagberg JM, et al. Advances in exercise, fitness, and performance genomics in 2011. Med Sci Sports Exerc. 2012;44(5):809–17. doi: 10.1249/MSS.0b013e31824f28b6. [DOI] [PMC free article] [PubMed] [Google Scholar]
- 30.Schaub MA, Boyle AP, Kundaje A, Batzoglou S, Snyder M. Linking disease associations with regulatory information in the human genome. Genome Res. 2012;22(9):1748–59. doi: 10.1101/gr.136127.111. [DOI] [PMC free article] [PubMed] [Google Scholar]
- 31.Spielmann N, Leon AS, Rao DC, Rice T, Skinner JS, Rankinen T, Bouchard C. Genome-wide linkage scan for submaximal exercise heart rate in the HERITAGE family study. Am J Physiol Heart Circ Physiol. 2007;293(6):H3366–71. doi: 10.1152/ajpheart.00042.2007. [DOI] [PubMed] [Google Scholar]
- 32.Teslovich TM, Musunuru K, Smith AV, et al. Biological, clinical and population relevance of 95 loci for blood lipids. Nature. 2010;466(7307):707–13. doi: 10.1038/nature09270. [DOI] [PMC free article] [PubMed] [Google Scholar]
- 33.U.S. Department of Health and Human Services. 2008 Physical Activity Guidelines for Americans. Washington, DC: U.S. Department of Health and Human Services; 2008. [Google Scholar]
- 34.Villegas R, Williams S, Gao Y, et al. Peroxisome proliferator-activated receptor delta (PPARD) genetic variation and type 2 diabetes in middle-aged Chinese women. Ann Hum Genet. 2011;75(5):621–9. doi: 10.1111/j.1469-1809.2011.00669.x. [DOI] [PMC free article] [PubMed] [Google Scholar]
- 35.Vincent B, Windelinckx A, Van Proeyen K, et al. Alpha-actinin-3 deficiency does not significantly alter oxidative enzyme activity in fast human muscle fibres. Acta Physiol (Oxf) 2012;204(4):555–61. doi: 10.1111/j.1748-1716.2011.02366.x. [DOI] [PubMed] [Google Scholar]
- 36.Wen W, Cho YS, Zheng W, et al. Meta-analysis identifies common variants associated with body mass index in east Asians. Nat Genet. 2012;44(3):307–11. doi: 10.1038/ng.1087. [DOI] [PMC free article] [PubMed] [Google Scholar]
- 37.Wilmore JH, Stanforth PR, Gagnon J, et al. Heart rate and blood pressure changes with endurance training: the HERITAGE Family Study. Med Sci Sports Exerc. 2001;33(1):107–16. doi: 10.1097/00005768-200101000-00017. [DOI] [PubMed] [Google Scholar]
- 38.Yang J, Loos RJ, Powell JE, et al. FTO genotype is associated with phenotypic variability of body mass index. Nature. 2012;490(7419):267–72. doi: 10.1038/nature11401. [DOI] [PMC free article] [PubMed] [Google Scholar]
- 39.Yvert T, He ZH, Santiago C, et al. Acyl coenzyme A synthetase long-chain 1 (ACSL1) gene polymorphism (rs6552828) and elite endurance athletic status: a replication study. PLoS ONE. 2012;7(7):e41268. doi: 10.1371/journal.pone.0041268. [DOI] [PMC free article] [PubMed] [Google Scholar]