

Abstract
Multiple sclerosis (MS) is a chronic inflammatory disorder of the central nervous system with a strong genetic component. Several lines of evidence support a strong role for genetic factors influencing both disease susceptibility and clinical outcome in MS. Identification of genetic variants that distinguish particular disease subgroups and/or predict a severe clinical outcome is critical to further our understanding of disease mechanisms and guide development of effective therapeutic approaches. We studied 1470 MS cases and performed a genome-wide association study of more than 2.5 million single-nucleotide polymorphisms to identify loci influencing disease severity, measured using the MS severity score (MSSS), a measure of clinical disability. Of note, no single result achieved genome-wide significance. Furthermore, variants within previously confirmed MS susceptibility loci do not appear to influence severity. Although bioinformatic analyses highlight certain pathways that are over-represented in our results, we conclude that the genetic architecture of disease severity is likely polygenic and comprised of modest effects, similar to what has been described for MS susceptibility, to date. However, a role for major effects of rare variants cannot be excluded. Importantly, our results also show the MSSS, when considered as a binary or continuous phenotype variable is by comparison a stable outcome.
Keywords: multiple sclerosis, MSSS, genome-wide association, meta-analysis
Introduction
Multiple sclerosis (MS (MIM 126200)) is an inflammatory demyelinating disease of the central nervous system that has an important neurodegenerative component and results in the accumulation of neurological deficits in most patients.1 An important feature of the disease is the heterogeneity of its clinical manifestations that includes a wide range of cognitive and functional disability; in general, disability increases with disease duration. Through recent advances in biomedical research, it is evident that both genetic and environmental factors contribute to MS susceptibility.2 The search for genetic risk factors affecting susceptibility to MS has been particularly successful, but it is not yet clear whether these susceptibility alleles or other genetic variants influence the course of MS. Currently, the genetic architecture of MS susceptibility includes one locus with a very strong effect on risk—the major histocompatibility complex—and over a dozen susceptibility loci with modest effects such as IL7RA, IL2RA, CLEC16A, CD58, CD6, IRF8, KIF21B, TMEM39A and TNFRSF1A.1,3–5
Interestingly, concordance in families for early and late clinical features indicates that, in addition to susceptibility, genetic variation may influence disease course and other clinical phenotypes.6–8 The clinical course of MS may also differ between ethnic groups.9 In the MS animal model, experimental autoimmune encephalomyelitis, multiple loci modulate specific phenotypes such as topographic location of lesions in the brain or spinal cord as well as the nature and severity of the inflammatory response.10–13 Given these observations and our current understanding of the genetic architecture of human traits, it is likely that many genetic variants of modest effect have a role in influencing the course of MS.
The gradual accumulation of disability over the course of MS and the limited availability of longitudinal assessments of disability has hampered efforts to delineate specific biological mechanisms contributing to disease course. However, one method provides a measure of clinical disability and incorporates the important variable of disease duration: the MS severity scale (MSSS).14 The MSSS is a probabilistic algorithm that captures disease severity by adjusting disability (as measured by the Expanded Disability Status Scale (EDSS)) at a point in time for disease duration. This method has been shown to be more powerful than alternative measures of disease severity.14 The MSSS score for an individual reflects the expected percentage of patients in the reference population (9892 patients from 11 countries), with a lower EDSS score for comparable disease duration; it is an attractive measure for MS severity as it requires information from a single time point and is applicable to all MS patients regardless of disease course (that is, whether the patient has a progressive component to his/her illness). Several studies support the validity of MSSS;14–16 nonetheless, while this method is robust, it does not capture all aspects of disability in MS.
To date, a handful of studies have explored the genetic component contributing to MS progression. Several studies have investigated specific candidate genes and/or MS susceptibility loci using various measure of disease severity,17–20 and two genome-wide association (GWA) scans of MSSS have been published.21,22 However, there is no confirmed MS severity locus at this time, and our understanding of the neurodegenerative disease component of MS remains limited. Thus, identifying genetic variation with effects on the severity of MS could be instrumental to further our understanding of disease mechanism(s) and contribute to clinical prognostic algorithms. Here, we present a comprehensive investigation of MSSS using 1470 MS subjects and analysis of genotypes derived from more than 2.5 million single-nucleotide polymorphisms (SNPs) (see Figure 1). We provide a methodological framework for investigating MSSS to address analytical challenges that are present for studies using this clinical outcome.
Figure 1.

Schematic overview of analysis.
Results
A total of 1470 MS patients, recruited from three clinical centers (Table 1; see Materials and methods), were eligible for investigation. Over 2.1 million SNPs met stringent quality control standards, with minor allele frequency (MAF) >0.01 and imputation scores >0.3 (see Materials and methods). The distribution of MSSS values differed significantly between the clinical recruitment centers (F2, 1467=194.03, P<1 ×10⁻⁶; Table 1); therefore, random-effects meta-analyses were pursued. Given the distributional differences in MSSS by recruitment center (Figure 2), we explored three phenotypic outcomes based on MSSS, with an aim of determining the most suitable statistical model for the data. MSSS was classified as follows (see Materials and methods; Table 1): (1) MEDIAN MSSS (MSSS ≤5 versus >5); (2) EXTREME MSSS (MSSS <2.5 versus ≥7.5); and as a continuous variable, (3) CONTINUOUS MSSS.
Table 1.
Clinical and demographic features of the MS cases
| Demographics | MS cases | UK | US | BWH |
|---|---|---|---|---|
| N | 1470 | 451 | 309 | 710 |
| Female:Male ratio | 3.2:1 | 3.0:1 | 3.4:1 | 3.2:1 |
| Mean MSSS (s.d.) | 4.1 (2.9) | 5.9 (2.6) | 4.3 (2.5) | 2.9 (2.6) |
| Mean disease duration in years (s.d.) | 12.2 (8.0) | 12.4 (7.0) | 10.0 (7.4) | 13.0 (8.7) |
| Ratio of cases | ||||
| Median MSSS (≤5 vs >5) | 1.6:1 (N=1470) | 1:2.1 | 1.9:1 | 3.6:1 |
| Extreme MSSS (<2.5 vs ≥7) | 1.8:1 (N=875) | 1:2.6 | 1.4:1 | 5.4:1 |
| Disease course | ||||
| Relapsing remitting MS | 71.8% | 59.2% | 74.8% | 78.6% |
| Secondary progressive MS | 24.4% | 33.7% | 20.0% | 20.4% |
| Primary progressive MS | 3.1% | 7.1% | 3.9% | 0.9% |
| Progressive remitting MS | 0.7% | – | 1.3% | 0.1% |
Abbreviations: BWH, Partners MS Center in Boston, MA; MS, multiple sclerosis; MSSS, multiple sclerosis severity score.
Figure 2.
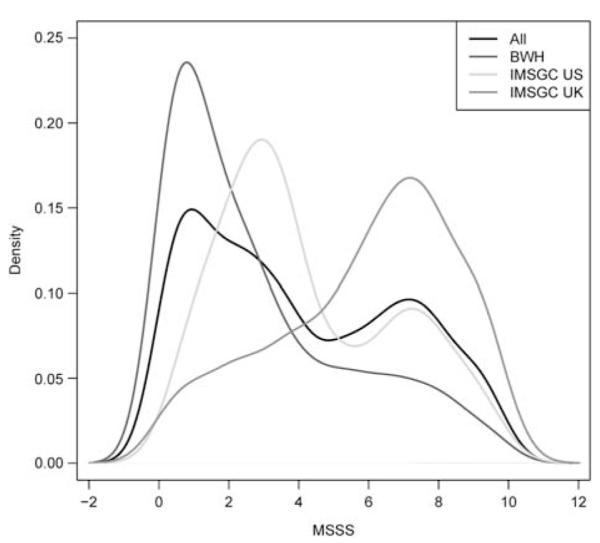
Density plot of the MSSS distribution by cohort of origin. A full colour version of this figure is available at the Genes and Immunity journal online.
The stability of the estimators from random-effects meta-analyses for each MSSS outcome was evaluated using 100 bootstraps based on an augmented testing data set of 1000 SNPs (see Materials and methods). The significance rank of each SNP in the augmented testing data set was noted for each meta-analysis and we compared the percentage that were present among the top-ranking SNPs from the bootstrapped analyses at the top 1% (N=10), 5% (N=50) and 10% (N=100) SNPs when ranked by significance. The meta-analyses were comparably stable (Figure 3); on average, at least one of the SNPs among the top 1% (top 10 SNPs) in the augmented data set was also ranked among the top 1% (top 10 SNPs) across all bootstrapped analyses regardless of phenotypic outcome. Similarly, approximately 12 and 30 SNPs from among the top 5% (top 50 SNPs) and 10% (top 100 SNPs) ranked SNPs in the augmented data set were also ranked among the top 5 and 10% in the bootstrapped results across phenotypic outcomes, respectively. We subsequently report from all three meta-analyses, as each phenotype targets a different definition of MS severity, and may highlight relevant information not present in any single analysis. A total of 5267 genes had associations at P<0.05 level; however, a third of the results from all three meta-analyses overlap (Supplementary Figures 1 and 2).
Figure 3.
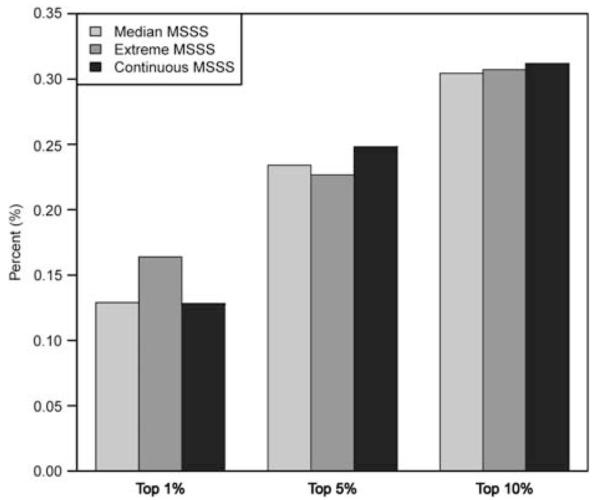
Estimator stability for each MSSS meta-analysis: percent concordance of top-ranking SNPs in the testing data set and across the 100 bootstrapped data sets. To determine which meta-analysis of the phenotypic outcome was most appropriate given the distribution of MSSS (see Figure 2), the stability of the estimator was evaluated using bootstrap. An augmented data set of 1000 randomly selected SNPs from among the union of SNPs (N=196 771 SNPs) that showed a significant association (P<0.05) in any of the three meta-analyses. One hundred bootstrap replicates were generated and the meta-analyses were performed (logistic and linear regression as appropriate) for each SNP in each of the 100 bootstrapped data sets. The ranking of each SNP in the original augmented data set was compared with its ranking in each of the 100 bootstrapped data sets. The aim was to determine if a specific phenotype showed greater stability among its top 1% (10), 5% (50) and 10% (100) SNPs. The application of a random-effect meta-analysis proved to be consistently stable across the phenotypic outcomes; therefore, all three meta-analytical results were considered equally. A full colour version of this figure is available at the Genes and Immunity journal online.
The most significant associations for SNPs within genes from each meta-analysis are presented in Table 2. Importantly, no association met GWA significance criteria (P<5 × 10⁻⁸; Figure 4); the lowest P-values were observed for: PTPRD (MEDIAN MSSS, rs10977017: odds ratio (OR)=1.67, P=1.0 × 10⁻⁵); TRIM2 (tripartite motif (TRIM)-containing 2) (EXTREME MSSS, rs12644284: OR=0.49, P=3.0×10⁻⁶); and the LOC100289506/YWHAG region (CONTINUOUS MSSS, rs758944/rs7779014: β=0.48, P=7.9×10⁻⁶). Table 3 lists 29 genes with associations at P<0.001 in all three meta-analyses, which interestingly also included variants within the established MS susceptibility locus CLEC16A (MEDIAN MSSS, rs8056098: OR=0.65; P=5.3×10⁻⁴; EXTREME MSSS, rs8056098: OR=0.74, P=5.5×10⁻⁴; CONTINUOUS MSSS, rs7186166: β=−0.44, 3.4×10⁻⁴). We compared results directly with those reported in a previous independent GWA investigation of MSSS21 (Table 4). The locus with the most evidence of association was GRIN2A (glutamate (N-methyl d-aspartate) receptor subtype 2A) (MEDIAN MSSS, rs1448239: OR=1.65; P=3.0×10⁻⁵; EXTREME MSSS, rs1448239: OR 1.89, P=2.0×10⁻⁴; CONTINUOUS MSSS, rs1448239: β=0.56, 3.2×10⁻⁵). No overlap with other published GWA results was observed based on the stringent criteria (P<0.0001).22 Associations lower than P<10−5 for any classical human leukocyte antigen region SNPs (total n=8701 examined) with any of the three MSSS phenotypes were not present; in particular, no class II region SNPs showed strong evidence of association (data not shown). MICB (specifically, rs2855814—an intronic SNP) was the only gene with P<0.0001 in any of human leukocyte antigen region analyses (data not shown).
Table 2.
Most significant associations for each MSSS meta-analysisa
| Gene b | Chr | Base-pair location | SNP | Function | Minor allele | CEU MAF c | MS MAF d | OR/β | P-value |
|---|---|---|---|---|---|---|---|---|---|
| Median (≤5 vs >5) | |||||||||
| PTPRD | 9 | 8 380 546 | rs10977017 | Intron | A | 0.219 | 0.186 | 1.67 | 1.02×10⁻⁵ |
| CRTAC1 | 10 | 99 689 864 | rs11189446 | Intron | C | 0.095 | 0.099 | 0.54 | 2.05×10⁻⁵ |
| ZFPM2 | 8 | 106 780 628 | rs10505082 | Intron | A | 0.158 | 0.162 | 0.62 | 2.45×10⁻⁵ |
| GRIN2A | 16 | 10 187 435 | rs1448239 | Intron | G | 0.150 | 0.143 | 1.65 | 2.99×10⁻⁵ |
| GPR158 | 10 | 25 595 237 | rs7071606 | Intron | A | 0.017 | 0.020 | 3.59 | 4.25×10⁻⁵ |
| PDZD2 | 5 | 32 107 764 | rs161522 | Intron | A | 0.233 | 0.228 | 1.62 | 4.35×10⁻⁵ |
| OR6T1 | 11 | 123 814 753 | rs1476203 | Near 5′ | T | 0.175 | 0.219 | 0.65 | 4.43×10⁻⁵ |
| PLCG2 | 16 | 81 888 905 | rs7185362 | Intron | A | 0.052 | 0.126 | 1.70 | 4.48×10⁻⁵ |
| CDHR3 | 7 | 105 604 231 | rs193806 | Intron | C | 0.127 | 0.188 | 0.63 | 5.53×10⁻⁵ |
| POPDC3 | 6 | 105 612 220 | rs11962089 | Intron | G | 0.164 | 0.114 | 0.55 | 5.89×10⁻⁵ |
| CDH13 | 16 | 83 149 215 | rs8047176 | Intron | G | 0.211 | 0.186 | 1.58 | 6.90×10⁻⁵ |
| STX8 | 17 | 9 295 309 | rs7219526 | Intron | T | 0.192 | 0.223 | 0.64 | 7.14×10⁻⁵ |
| KCNMA1 | 10 | 78 651 796 | rs7087337 | Intron | C | 0.075 | 0.077 | 2.00 | 7.47×10⁻⁵ |
| NOS1AP | 1 | 162 322 955 | rs12403202 | Intron | T | 0.267 | 0.241 | 0.63 | 7.83×10⁻⁵ |
| OR8D4 | 11 | 123 777 986 | rs7942047 | Missense | T | 0.183 | 0.218 | 0.67 | 8.68×10⁻⁵ |
| Extreme (<2.5 vs ≥7) | |||||||||
| TRIM2 | 4 | 154 154 000 | rs12644284 | Intron | G | 0.333 | 0.295 | 0.49 | 3.89×10⁻⁶ |
| YWHAG | 7 | 75 978 229 | rs17149161 | Intron | A | 0.200 | 0.257 | 1.87 | 5.83×10⁻⁶ |
| LOC100289506 | 7 | 75 951 230 | rs7789940 | Intron | G | 0.188 | 0.257 | 1.87 | 6.04×10⁻⁶ |
| ASXL2 | 2 | 25 973 309 | rs10178552 | Intron | T | 0.308 | 0.327 | 0.58 | 1.00×10⁻⁵ |
| FHIT | 3 | 60 683 737 | rs1735457 | Intron | G | 0.042 | 0.060 | 2.85 | 1.55×10⁻⁵ |
| NKD1 | 16 | 50 654 375 | rs12596811 | Intron | T | 0.172 | 0.179 | 2.43 | 1.80×10⁻⁵ |
| HACE1 | 6 | 105 182 839 | rs7741733 | Intron | T | 0.483 | 0.330 | 1.69 | 1.97×10⁻⁵ |
| MICB | 6 | 31 484 334 | rs2855814 | Intron | C | 0.060 | 0.121 | 0.40 | 2.09×10⁻⁵ |
| GPC5 | 13 | 92 964 812 | rs17430373 | Intron | G | 0.058 | 0.041 | 4.19 | 3.12×10⁻⁵ |
| AFF3 | 2 | 100 247 756 | rs12471490 | Intron | A | 0.208 | 0.217 | 0.56 | 3.15×10⁻⁵ |
| RELN | 7 | 103 375 266 | rs10487166 | Intron | T | 0.093 | 0.123 | 0.45 | 5.33×10⁻⁵ |
| PRDM2 | 1 | 14 043 609 | rs4344326 | Intron | G | 0.008 | 0.025 | 4.26 | 5.82×10⁻⁵ |
| PPARGC1A | 4 | 23 815 662 | rs8192678 | Missense | A | 0.367 | 0.348 | 1.72 | 5.94×10⁻⁵ |
| JAZF1 | 7 | 27 909 037 | rs735664 | Intron | C | 0.429 | 0.463 | 1.65 | 5.97×10⁻⁵ |
| CTNND2 | 5 | 11 548 050 | rs11750073 | Intron | T | 0.220 | 0.198 | 1.99 | 6.49×10⁻⁵ |
| Continuous | |||||||||
| LOC100289506 | 7 | 75 953 297 | rs758944 | Intron | T | 0.200 | 0.265 | 0.48 | 7.85×10⁻⁶ |
| YWHAG | 7 | 75 975 586 | rs7779014 | Intron | T | 0.200 | 0.266 | 0.48 | 7.95×10⁻⁶ |
| POPDC3 | 6 | 105 612 220 | rs11962089 | Intron | G | 0.164 | 0.114 | −0.69 | 8.33×10⁻⁶ |
| ANAPC1 | 2 | 112 626 773 | rs4848821 | Intron | G | 0.058 | 0.091 | 0.80 | 1.44×10⁻⁵ |
| PTPRD | 9 | 8 380 546 | rs10977017 | Intron | A | 0.219 | 0.186 | 0.57 | 1.47×10⁻⁵ |
| RBM20 | 10 | 112 572 873 | rs1832745 | Intron | T | 0.500 | 0.480 | −0.45 | 2.02×10⁻⁵ |
| IFNA16 | 9 | 21 218 873 | rs1820314 | Near 5′ | A | 0.217 | 0.203 | −0.50 | 2.13×10⁻⁵ |
| IFNA17 | 9 | 21 227 622 | rs9298814 | Missense | G | 0.208 | 0.190 | −0.50 | 2.30×10⁻⁵ |
| IFNA10 | 9 | 21 208 723 | rs10811505 | Near 5′ | C | 0.208 | 0.190 | −0.50 | 2.56×10⁻⁵ |
| GRIN2A | 16 | 10 187 435 | rs1448239 | Intron | G | 0.150 | 0.143 | 0.56 | 3.17×10⁻⁵ |
| PSD3 | 8 | 18 520 079 | rs7015570 | Intron | G | 0.195 | 0.138 | −0.60 | 3.76×10⁻⁵ |
| KLHL9 | 9 | 21 331119 | rs8729 | Utr-3 | A | 0.200 | 0.188 | −0.49 | 3.85×10⁻⁵ |
| TRIM2 | 4 | 154 154 000 | rs12644284 | Intron | G | 0.333 | 0.290 | −0.49 | 3.88×10⁻⁵ |
| NPSR1 | 7 | 34 872 332 | rs17170015 | Intron | G | 0.229 | 0.219 | −0.48 | 4.65×10⁻⁵ |
| ASXL2 | 2 | 25 973 309 | rs10178552 | Intron | T | 0.308 | 0.325 | −0.41 | 4.76×10⁻⁵ |
Abbreviations: Chr, chromosome; MAF, minor allele frequency; MS, multiple sclerosis; OR, odds ratio; SNP, single-nucleotide polymorphism.
SNP genotypes were coded as a continuous variable (0–2 range) to reflect the imputation probability of the presence of the minor allele (where 0 indicates the absence of the minor allele). Random-effects meta-analyses adjusted for gender and cohort of origin were conducted for each phenotype (logistic regression for the binary outcomes: median MSSS and extreme MSSS; linear regression for the continuous MSSS outcome). Genes with only a single significant association (P<0.05) were ignored. Only SNPs located within genes are shown.
All genes, alleles and SNP function were retrieved from the National Center for Biotechnology Information’s (NCBI) dbSNP browser. Basepair locations are specified with respect to the forward (+) strand of the NCBI Build 37.1.
Minor allele frequencies in Haplotype Map (HapMap) data for Utah residents of northern and western European ancestry.
Minor allele frequencies in 1470 MS cases used in the median MSSS and continuous MSSS analyses, and in 875 MS cases used in the extreme MSSS analysis. SNP variants with an MAF <0.01 were excluded.
Figure 4.

Manhattan plots for the random-effects meta-analyses adjusted for cohort and gender. A full colour version of this figure is available at the Genes and Immunity journal online.
Table 3.
List of genes with associations (P<0.001) in all MSSS analysesa
| Locus | Chr |
Median MSSS (≤5 vs >5)
|
Extreme MSSS (<2.5 vs ≥7)
|
Continuous MSSS
|
||||||
|---|---|---|---|---|---|---|---|---|---|---|
| SNP | OR | P-value | SNP | OR | P-value | SNP | β | P-value | ||
| AGBL4 | 1 | rs12127450 | 0.65 | 0.00049 | rs12127450 | 0.53 | 0.00028 | rs12127450 | −0.54 | 8.8×10⁻⁵ |
| NTNG1 | 1 | rs17505688 | 1.80 | 0.00091 | rs17505688 | 2.24 | 0.00086 | rs17505688 | 0.75 | 0.00023 |
| PTGER3 | 1 | rs17541777 | 0.64 | 0.00031 | rs5673 | 2.02 | 0.00091 | rs17541777 | −0.52 | 0.00018 |
| ASXL2 | 2 | rs10178552 | 0.71 | 0.00014 | rs10178552 | 0.58 | 1.0×10⁻⁵ | rs10178552 | −0.41 | 4.8×10⁻⁵ |
| LHCGR | 2 | rs13019537 | 0.61 | 0.00012 | rs17398267 | 0.57 | 0.00016 | rs13019537 | −0.49 | 0.00052 |
| MYT1L | 2 | rs13387792 | 0.60 | 0.00040 | rs13387792 | 0.45 | 0.00020 | rs13387792 | −0.61 | 5.4×10⁻⁵ |
| PPARGC1A | 4 | rs8192678 | 1.40 | 0.00026 | rs8192678 | 1.72 | 5.9×10⁻⁵ | rs8192678 | 0.37 | 0.00022 |
| TRIM2 | 4 | rs12644284 | 0.69 | 0.00056 | rs12644284 | 0.49 | 3.9×10⁻⁵ | rs12644284 | −0.49 | 3.9×10⁻⁵ |
| CTNND2 | 5 | rs11750073 | 1.58 | 0.00025 | rs11750073 | 1.99 | 6.5×10⁻⁵ | rs11750073 | 0.52 | 0.00023 |
| ARID1B | 6 | rs7744583 | 1.37 | 0.00061 | rs7744583 | 1.59 | 0.00054 | rs7744583 | 0.36 | 0.00030 |
| POPDC3 | 6 | rs11962089 | 0.55 | 5.9×10⁻⁵ | rs11962089 | 0.45 | 0.00016 | rs11962089 | −0.69 | 8.3×10⁻⁶ |
| LOC100289506 | 7 | rs758944 | 1.37 | 0.00090 | rs7789940 | 1.87 | 6.0×10⁻⁶ | rs758944 | 0.48 | 7.9×10⁻⁶ |
| NPSR1 | 7 | rs2530548 | 0.75 | 0.00045 | rs12111597 | 0.56 | 0.000842 | rs17170015 | −0.48 | 4.7×10⁻⁵ |
| RELN | 7 | rs626065 | 0.76 | 0.00096 | rs10487166 | 0.45 | 5.3×10⁻⁵ | rs517761 | −0.36 | 0.00012 |
| YWHAG | 7 | rs11765693 | 1.37 | 0.00087 | rs17149161 | 1.87 | 5.8×10⁻⁶ | rs7779014 | 0.48 | 8.0×10⁻⁶ |
| INTS10 | 8 | rs7812549 | 0.66 | 0.00095 | rs7812549 | 0.54 | 0.00055 | rs7812549 | −0.5 | 0.00017 |
| ZFPM2 | 8 | rs10505082 | 0.62 | 2.5×10⁻⁵ | rs10505082 | 0.58 | 0.00067 | rs16873632 | −0.65 | 0.00011 |
| PTPRD | 9 | rs10977017 | 1.67 | 1.0×10⁻⁵ | rs10958932 | 0.65 | 0.00092 | rs10977017 | 0.57 | 1.5×10⁻⁵ |
| TBC1D2 | 9 | rs10985528 | 0.58 | 0.00038 | rs12352986 | 0.44 | 0.00057 | rs10985528 | −0.56 | 0.00038 |
| CAMK1D | 10 | rs2399849 | 1.58 | 0.00027 | rs2999981 | 5.36 | 0.00019 | rs2399849 | 0.50 | 0.00049 |
| DOCK1 | 10 | rs2766051 | 1.68 | 0.00054 | rs2050305 | 1.81 | 0.00023 | rs2766051 | 0.65 | 0.00015 |
| OR6T1 | 11 | rs1476203 | 0.65 | 4.4×10⁻⁵ | rs1476202 | 0.6 | 0.00068 | rs1476203 | −0.41 | 0.00025 |
| KDM2B | 12 | rs7134248 | 0.73 | 0.00041 | rs7134248 | 0.66 | 0.00067 | rs7134248 | −0.37 | 0.00017 |
| FAM189A1 | 15 | rs7167473 | 0.74 | 0.00053 | rs11634779 | 0.58 | 0.00031 | rs7167473 | −0.36 | 0.00021 |
| CLEC16A | 16 | rs8056098 | 0.74 | 0.00055 | rs8056098 | 0.65 | 0.00053 | rs7186166 | −0.44 | 0.00034 |
| GRIN2A | 16 | rs1448239 | 1.65 | 3.0×10⁻⁵ | rs1448239 | 1.89 | 0.00020 | rs1448239 | 0.56 | 3.2×10⁻⁵ |
| ACCN1 | 17 | rs9892479 | 2.20 | 0.00099 | rs9892479 | 2.95 | 0.00082 | rs9892479 | 0.99 | 0.00043 |
| DTD1 | 20 | rs4814783 | 0.70 | 0.00097 | rs6075409 | 1.70 | 0.00062 | rs6075409 | 0.43 | 0.00046 |
| CERK | 22 | rs9616098 | 3.56 | 0.00035 | rs9616098 | 5.92 | 7.2×10⁻⁵ | rs9616098 | 1.55 | 0.00023 |
Abbreviations: Chr, chromosome; MSSS, multiple sclerosis severity score; OR, odds ratio; SNP, single-nucleotide polymorphism.
Genes with only one significant SNP association (P<0.05) were excluded. For each meta-analysis, the most significantly associated SNP variant is reported for each gene.
Table 4.
Associations in this study with genes identified in previous GWAS of MSSSa
| Locus | Chr |
Median MSSS (≤5 vs >5)
|
Extreme MSSS (<2.5 vs ≥7)
|
Continuous MSSS
|
||||||
|---|---|---|---|---|---|---|---|---|---|---|
| SNP | OR | P-value | SNP | OR | P-value | SNP | β | P-value | ||
| AKAP12 | 6 | rs17080959 | 1.42 | 0.0024 | rs17080959 | 1.77 | 0.00065 | rs17080959 | 0.45 | 0.00072 |
| CAMK2D | 4 | rs987694 | 1.30 | 0.0016 | rs17531554 | 1.51 | 0.0075 | rs11729444 | 0.45 | 0.00036 |
| CDH4 | 20 | rs6089621 | 1.90 | 0.0015 | rs13040920 | 0.61 | 0.00014 | rs2066422 | −0.40 | 0.00035 |
| CSMD1 | 8 | rs9644362 | 1.48 | 0.0014 | rs9772485 | 1.71 | 0.00026 | rs4875322 | −0.36 | 0.00086 |
| GRIN2A | 16 | rs1448239 | 1.65 | 3.0×10⁻⁵ | rs1448239 | 1.89 | 0.00020 | rs1448239 | 0.56 | 3.2×10⁻⁵ |
| GSG1L | 16 | rs205420 | 0.71 | 0.00045 | rs205370 | 0.70 | 0.0035 | rs205418 | −0.32 | 0.0027 |
| KDM4C | 9 | rs2792226 | 0.79 | 0.0085 | rs10975870 | 0.18 | 0.00016 | rs10975869 | −1.79 | 0.00010 |
| MACROD2 | 20 | rs10485772 | 1.74 | 0.0010 | rs4814386 | 1.68 | 0.00011 | rs6079855 | 0.42 | 0.00017 |
| MAGI2 | 7 | rs246462 | 0.79 | 0.0082 | rs6958768 | 1.53 | 0.0055 | rs9886142 | 0.51 | 0.00084 |
| MTHFD1L | 6 | rs7349940 | 1.64 | 0.00081 | rs6557106 | 0.72 | 0.0066 | rs7349940 | 0.50 | 0.0031 |
Abbreviations: Chr, chromosome; GWAS, genome-wide association study; MSSS, multiple sclerosis severity score; OR, odds ratio; SNP, single-nucleotide polymorphism.
Genes listed have at least one SNP significantly associated at P<0.001 in at least one of the MSSS meta-analyses. Genes were excluded if there was only one significant SNP association (P<0.05) in any meta-analysis. This shows overlapping associations (with gene) reported in a previous independent GWAS of MSSS (P<0.0001).21
Two pathway-based investigations of significant genes (P<0.001; N=441) from the union of the three meta-analyses were also conducted (see Materials and methods). Based on pathways curated in the Kyoto Encyclopedia of Genes and Genomes database,23–25 there was significant (P<0.001) over-representation of genes involved in several Kyoto Encyclopedia of Genes and Genomes pathways, including: calcium signaling, natural killer cell-mediated cytotoxicity, antigen processing and presentation, axon guidance and Wnt signaling (Table 5). Similarly, when Gene Ontology terms were investigated, there was significant enrichment of terms associated with neuronal processes, calcium ion transport and interferon α/β receptor binding, among other terms (Supplementary Figure 3).
Table 5.
KEGG pathway analysis of significant genes identified in the MSSS meta-analyses (P<0.001)a
| KEGG pathway | Genes | Obs | Exp |
Enrichment
ratio |
P-value |
|---|---|---|---|---|---|
| Calcium signaling pathway |
ADCY2 GNAS GRIN2A ITPR1 ITPR2 LHCGR ATP2B1
PLCE1 PDE1C PLCG2 PTGER3 RYR3 SLC8A1 CAMK2D |
14 | 2.13 | 6.57 | 3.56×10⁻⁸ |
| Natural killer cell-mediated cytotoxicity |
NFAT5 HLA-C IFNA4 IFNA5 IFNA10 IFNA13 IFNA16
IFNA17 MICB NFATC1 PIK3CD PLCG2 |
12 | 1.53 | 7.86 | 4.70×10⁻⁸ |
| Regulation of autophagy | IFNA4 IFNA5 IFNA10 IFNA13 IFNA16 IFNA17 | 6 | 0.35 | 17.32 | 1.01×10⁻⁶ |
| Antigen processing and presentation |
HLA-C HLA-DQA1 IFNA4 IFNA5 IFNA10 IFNA13
IFNA16 IFNA17 |
8 | 0.92 | 8.66 | 4.02×10⁻⁶ |
| Jak-STAT signaling pathway |
CTNFR GHR IFNA4 IFNA5 IFNA10 IFNA13 IFNA16
IFNA17 PIK3CD |
9 | 1.83 | 4.91 | 0.00010 |
| Toll-like receptor signaling pathway |
IFNA4 IFNA5 IFNA10 IFNA13 IFNA16 IFNA17
PIK3CD |
7 | 1.10 | 6.34 | 0.00012 |
| Axon guidance |
NFAT5 EPHA7 NTNG1 EPHA6 LIMK2 NFATC1 NTN4
ROBO1 |
8 | 1.55 | 5.15 | 0.00018 |
| Long-term depression | GRIN2A GRID2 ITPR1 ITPR2 PPP2R2C PRKG1 | 6 | 0.98 | 6.15 | 0.00044 |
| Diterpenoid biosynthesis | EGLN3 KDM4C | 2 | 0.04 | 51.95 | 0.00049 |
| Wnt signaling pathway |
NFAT5 CTNNB1 DAAM1 NFATC1 WNT4 PPP2R2C
CAMK2D NKD1 |
8 | 1.83 | 4.36 | 0.00054 |
| Dentatorubropallidoluysian atrophy (DRPLA) |
WWP2 CNKSR3 MAGI2 | 3 | 0.19 | 15.58 | 0.00085 |
Abbreviations: Exp, expected; KEGG, Kyoto Encyclopedia of Genes and Genomes; MSSS, multiple sclerosis severity score; Obs, observed; OR, odds ratio; SNP, single-nucleotide polymorphism.
The union of genes with at least one significant SNP association at the P<0.001 level. Genes with one SNP association at the P<0.05 level were excluded. Of the 441 genes submitted for analysis, 424 were incorporated for analysis using a hypergeometric test to compare the submitted list to a reference of all human genes using WebGestalt v.2 (http://bioinfo.vanderbilt.edu/webgestalt/). Genes excluded were primarily predicted/hypothetical loci with no known function. The analysis was limited to KEGG pathways where at least two genes were present in the submitted list.
Discussion
MS is a common cause of neurological disability in individuals of European descent.26 Previous efforts to investigate the underlying genetic component contributing to MS progression and severity have been limited by small sample sizes, clinical heterogeneity and availability of genotypic information. Herein, we report a genome-wide investigation of MS disease severity characterized by the MSSS using over 2.5 million SNPs in 1470 MS patients of European descent. The MSSS is a probabilistic algorithm that relates disability scores (EDSS) to a distribution of patients with comparable disease duration.14 However, the true distribution of MSSS is not known, although it is traditionally treated as having a normal distribution. This presents an interesting analytical challenge for selecting an appropriate parametric model for MSSS inference.
Given the significant differences in the distribution of MSSS by recruitment site, we investigated the stability of estimators for three phenotypic outcomes: (1) dichotomizing MSSS by the overall minimum (MEDIAN MSSS); (2) dichotomizing MSSS by extreme phenotypes (EXTREME MSSS); (3) and as a continuous variable (CONTINUOUS MSSS). The aim was to determine which of the three phenotypic outcomes was most appropriately investigated using a random-effects meta-analysis. Random-effects meta-analysis allows for heterogeneity across studies due to inherent differences and/or differential biases, unlike fixed-effects models that assume a single common effect that underlies each study in the meta-analysis. As a general rule, a random-effects meta-analysis is generally more conservative, generating wider confidence interval and larger P-values.27 To determine the most suitable random-effects meta-analysis, bootstrap was used to generate 100 data sets for a subset of 1000 SNPs, which were randomly selected from among all SNPs that showed some level of association (P<0.05) with one of the MSSS outcomes. We compared the rank of the randomly selected SNPs in the augmented data set to the rank across the bootstrapped data sets. We hypothesized that a more stable model would have a higher percent concordance among the top-ranking SNPs. Surprisingly, the three random-effect meta-analyses were equally stable. As each analysis is based on a slightly different hypothesis, we considered results from all three analyses.
The most significant result based on gene association for each phenotypic outcome was consistent across all meta-analyses (Tables 2 and 3). Interestingly, biological evidence supports a potential role for some of these candidates in MS disease severity. For example, PTPRD (protein tyrosine phosphatase (receptor type) δ) on chromosome 9 encodes a transmembrane protein involved in neuronal differentiation,28,29 neurite out-growth30 and excitatory synapse formation.31 In murine models, PTPRD has been shown to regulate learning32 and motoneuron axon guidance.33PTPRD has recently been identified as a susceptibility locus for restless leg syndrome.34 Interestingly, there is clinical evidence that restless leg syndrome is more prevalent in MS patients, particularly those with greater disability.35,36
TRIM2 on chromosome 4 encodes a protein that localizes to cytoplasmic filaments with a TRIM motif (three zinc-binding domains) and participates in axon outgrowth during development. TRIM2 has been shown to participate in neuronal plasticity,37 axon initialization38 and ubiquitination of the neurofilament light subunit.39TRIM2-deficient mice have greater levels of neurofilament light subunit in axons and resulting axonal swellings in the cerebellum, retina, spinal cord and cerebral cortex, leading to progressive neurodegeneration with juvenile-onset tremor and ataxia.39
YWHAG (14-3-3γ protein) on chromosome 7 encodes a member of a highly conserved 14-3-3 family of proteins that mediate signal transduction. YWHAG is predominantly expressed within neurons40 and astrocytes.41 In neurons, 14-3-3γ protein appears to contribute to neuronal vulnerability during oxidative stress42 and increased levels promote astrocyte survival, whereas decreased levels result in increased apoptotic loss under ischemia.43YWHAG resides on chromosome 7q11.23, along with several genes, and haploinsufficiency of this region results in William–Beuren syndrome, which includes a specific mental retardation profile, distinctive dysmorphic features and supravalvular aortic stenosis.44 Interestingly, zebrafish knocked down for YWHAG have reduced brain size and an increased diameter of the heart tube.45
Finally, GRIN2A encodes a member of ionotrophic glutamate-gated ion channels, the NR2A subunit. A previous GWA study of MSSS identified GRIN2A as a candidate, albeit not the exact SNPs we observed (Table 4).21 Further, limited data available through HapMap (http://hapmap.ncbi.nlm.nih.gov/) cannot fully discern whether strong linkage disequilibrium exists between the associated SNPs identified in both studies. However, there is accumulating evidence for the involvement of glutamate receptors in MS and related animal models, including preliminary evidence showing increased expression of NR2A subunit in central nervous system tissue from encephalomyelitis rats.46,47 NR2A is expressed primarily in the neocortex and other forebrain structures,48,49 and is also present on oligodendrocytes.50–52 NR2A complexes with other N-methyl d-aspartate receptor subunits to form heterodimers, of which there are several. However, NR2A-containing heterodimers are the most stable and do increase in prevalence at synaptic surfaces as the neuron matures.53 Furthermore, genetic variation within GRIN2A has been associated with autism,54,55 schizophrenia56 and modifying age of onset in Huntington’s disease.57–59 We note that GRIN2A is a large gene (stretching 421 kb per HapMap: http://hapmap.ncbi.nlm.nih.gov/), which skews the likelihood of replicating an association within the gene. Nonetheless, our evidence is consistent with a previous MSSS GWA study,21 making this locus a viable candidate for further investigation.
A special emphasis was placed in the current investigation on 21 previously established MS susceptibility loci.5,60 None of the reported variants showed any evidence for association with severity (Supplementary Table 1). However, over 1100 SNPs in 13 of the 21 susceptibility loci had an association with MSSS at P<0.05 in at least one of the three meta-analyses (Supplementary Table 2). Given the importance of these particular genes in the development of MS, further work will be needed to fully characterize their role, if any, in disease severity and progression. MGAT, reported recently as associated with MSSS,22 was not replicated in our study. Finally, current results do not support a strong role for human leukocyte antigen influences on MSSS, and are consistent with previous reports.21,22
An extensive and conservative power assessment of the three MSSS phenotypes investigated in this analysis was conducted to guide interpretation of results, given the number of statistical tests performed and that no observed associations met genome-wide significance (P>1×10⁻⁶). We assumed a population risk of 0.0001 for each phenotype. For CONTINUOUS MSSS (mean=4.1, s.d.=2.9, N=1470), power was low to detect most associations at P<1×10⁻⁵, with the exception of moderately large effects (absolute β>0.6) for more common variants (MAF >0.30). For P<1×10⁻⁸, power was available to detect only large effects (absolute β >0.8) among the more common variants (MAFs >0.25) (Supplementary Figure 4). For MEDIAN MSSS (≤5 vs >5, ratio=1.6:1, N=1470), we were powered at P<1×10⁻⁵ to detect most associations where OR <0.5 or >1.7 for MAFs >0.15; however at P<1×10⁻⁸, we were primarily powered to observe these associations for more common variants with MAFs >0.25 (Supplementary Figure 5). We had lower power for the EXTREME MSSS phenotype analysis (<2.5 vs ≥7.5, ratio=1.8:1, N=875), with sufficient power to detect very strong associations with ORs <0.4 or >2 for variants with MAFs >0.15 at P<1×10⁻⁵ and with ORs <0.4 and >2 for MAFs >0.25 at P<1×10⁻⁸ (Supplementary Figure 6). Despite this being one of the largest investigations of MSSS performed, to date: that adequate power was available to detect some of the reported associations with P>1×10⁻⁶ and that we hypothesized larger genetic effects would be responsible for associations with disease severity, it is important to note that power to detect modest associations for less common variants was quite limited. Similar to GWA study for susceptibility loci in MS, it appears that genetic influences on severity as characterized by the MSSS are likely to be polygenic and modest. Our results are also consistent with a role for major effects of yet unidentified rare variants. Further and much larger studies are needed to fully characterize the genetic component in MS that influences disease severity and progression.
Materials and methods
Study population
A total of 1655 MS patients of European descent were initially included for analysis (as described previously).3 All subjects met the McDonald criteria for the diagnosis of MS.61 The MS subjects were recruited from three clinical sites: 453 cases from the UK (IMSGC UK) and 342 cases from the US (IMSGC US); the remaining 860 MS patients were recruited at Partners MS Center in Boston, MA (BWH). There were no overlapping subjects among the three recruitment sites. Stringent assessment of population stratification outliers were conducted for each cohort.3,62 Appropriate institutional review boards approved all studies and written informed consent was obtained from all participants. Individuals with disease duration less than a year were excluded from the analysis, resulting in a final study population of 1470 MS cases (Table 1).
Genotyping and imputation
MS subjects recruited through the IMSGC were genotyped on the Affymetrix platform using the GeneChip Human Mapping 500K Array set.62 The BWH MS subjects were genotyped on the Affymetrix Genome-wide Human SNP Array 6.0 (GeneChip 6.0).3 Conservative quality control measures were imposed on each data set before imputation (as described previously).3,62 The data sets were imputed to a common panel of 2.56 million SNPs using the MACH algorithm with HapMap data for Utah residents of northern and western European ancestry as the reference.3 The probabilistic dosages rather than hard genotype calls were used in this investigation, to allow for imputation uncertainty at each locus. Non-autosomal SNPs were excluded, as well as SNPs with an imputation quality score less than 0.3 and an MAF <%. MAF was calculated by summing the imputed genotypes for each SNP and dividing by twice the number of individuals in the study. A total of 2 151 258 SNPs were included for the analysis of both the MEDIAN and CONTINUOUS outcomes, and 2 110 417 SNPs for the EXTREME analysis (due to increased number of SNPs with MAF <% as a result of a reduced study population (N=875); Table 1).
MSSS
MSSS was calculated using EDSS and disease duration, which was defined as the elapsed time (in years) between the first symptom and EDSS assessment. The distribution of MSSS varied by recruitment site (Figure 2), with an overall bimodal distribution with the minimum at an MSSS of 5 (Figure 2). As a result, MSSS was also categorized into two binary variables, with the less severe category as the reference. MSSS was first dichotomized by the minimum of overall bimodal distribution (the expected median14). The MEDIAN MSSS variable was defined by MSSS ≤5 vs >5 (Table 1). MSSS was also dichotomized to reflect the extremes of the disease severity. The EXTREME MSSS variable was defined by MSSS <2.5 vs ≥7.5 (Table 1). MSSS was also treated as a continuous variable: CONTINUOUS MSSS.
Analytical methods
An analysis of variance (one-way analysis of variance) test compared mean MSSS across the three recruitment sites, and MSSS significantly differed. Given the observed MSSS heterogeneity among the three recruitment sites, it was important to consider which phenotypic outcome was most appropriate for investigation using a random-effects meta-analysis. The stability of the estimators for each MSSS outcome (MEDIAN, EXTREME and CONTINUOUS) was evaluated using bootstrap.63 Bootstrap is a computational procedure where the original data set is resampled with replacement, creating a synthetic data set. The objective is to emulate the process by which observations are selected into a study. First, for each outcome, a random-effects meta-analysis was conducted with the cohort of origin as the random-effect, and gender and genotype as fixed-effects using the glmmML function in the R package glmmML v.0.81-6 (http://www.cran.rproject.org/web/packages/glmmML/index.html/). A logistic model was used for the binary outcomes (MEDIAN and EXTREME) and a linear model for the continuous outcome (CONTINUOUS). Second, a random subset of 1000 SNPs were selected from among the union of significant SNPs (P<0.05; N=196 771 SNPs) from all three meta-analyses to create an augmented testing data set. One hundred bootstrap replicates were generated and the meta-analyses were performed (logistic and linear regression as appropriate) for each SNP in the augmented testing data set in each of the 100 bootstrapped data sets. The ranking of each SNP in the augmented data set was compared with its ranking in each of the 100 boot-strapped data sets. The aim was to determine if a specific phenotype showed greater stability among its top 1% (10), 5% (50) and 10% (100) SNPs when ranked by significance. For example, if a greater percentage of top 10 SNPs from the augmented data set were consistently present among the top 10 most significant SNPs in the bootstrapped data sets for a specific phenotypic outcome, it would suggest that the model for that phenotype was more stable. There was no advantage to investigating a specific phenotype (Figure 2); therefore, results from all three meta-analyses were considered.
The emphasis in this study was on SNPs located within genes. Genic information for all SNPs was retrieved from the National Center for Biotechnology Information’s dbSNP browser using Build 37.1. Genic associations were retained if more than one SNP had a significant association (P<0.05). Two pathway analyses were conducted using genes with at least one association at the P<0.001 level in any of the three meta-analyses using WebGestalt v.2 (http://bioinfo.vanderbilt.edu/webgestalt/).64 Of the 441 genes submitted for analysis, 424 were incorporated for analysis using a hypergeometric test to compare the submitted list to a reference of all human genes. Genes excluded were primarily predicted/hypothetical loci with no known function. The first analysis of Kyoto Encyclopedia of Genes and Genomes pathways was restricted to pathways where at least two genes were present in the submitted list. The second analysis was restricted to investigating Gene Ontology terms.
Supplementary Material
Acknowledgements
This work was supported by the National Institutes of Health (NS049477, NS032830, MH065215, NS067305, AI076544), the Wellcome Trust (084702/Z/08/Z) and the Cambridge NIHR Biomedical Research Centre. We appreciated the many helpful comments and suggestions from Paola Bronson and Patricia P Ramsay. All study participants were recruited in agreement with protocols of the institutional review board at each institution. For a full list of members of the IMSGC, see http://www.imsgc.org/.
Footnotes
Conflict of interest The authors declare no conflict of interest.
Author contributors: Contributing authors to this work are Farren BS Briggs (UC Berkeley), Xiaorong Shao (UC Berkeley), Benjamin A Goldstein (UC Berkeley), Jorge R Oksenberg (UC San Francisco), Lisa F Barcellos (UC Berkeley) and Philip L de Jager (Brigham & Women’s Hospital and Harvard Medical School). LFB and PLD contributed equally to this work. PLD is a Harry Weaver Neuroscience Scholar of the National MS Society. FBSB is a National MS Society Postdoctoral Fellow.
Contributors Farren BS Briggs Genetic Epidemiology and Genomics Laboratory, Division of Epidemiology, School of Public Health, UC Berkeley.
Xiaorong Shao Genetic Epidemiology and Genomics Laboratory, Division of Epidemiology, School of Public Health, UC Berkeley; Division of Biostatistics, School of Public Health, UC Berkeley.
Benjamin A Goldstein Genetic Epidemiology and Genomics Laboratory, Division of Epidemiology, School of Public Health, UC Berkeley; Division of Biostatistics, School of Public Health, UC Berkeley.
Jorge R Oksenberg Department of Neurology, School of Medicine, UC San Francisco; Institute for Human Genetics, School of Medicine, UC San Francisco.
Lisa F Barcellos Genetic Epidemiology and Genomics Laboratory, Division of Epidemiology, School of Public Health, UC Berkeley.
Philip L De Jager Program in NeuroPsychiatric Genomics, Center for Neurologic Diseases, Department of Neurology, Brigham & Women’s Hospital, Boston; Program in Medical & Population Genetics, Broad Institute of Harvard University and Massachusetts Institute of Technology, Cambridge, MA.
References
- 1.Oksenberg JR, Barcellos LF. Multiple sclerosis genetics: leaving no stone unturned. Genes Immun. 2005;6:375–387. doi: 10.1038/sj.gene.6364237. [DOI] [PubMed] [Google Scholar]
- 2.Zuvich RL, McCauley JL, Pericak-Vance MA, Haines JL. Genetics and pathogenesis of multiple sclerosis. Semin Immunol. 2009;21:328–333. doi: 10.1016/j.smim.2009.08.003. [DOI] [PMC free article] [PubMed] [Google Scholar]
- 3.De Jager PL, Jia X, Wang J, de Bakker PI, Ottoboni L, Aggarwal NT, et al. Meta-analysis of genome scans and replication identify CD6, IRF8 and TNFRSF1A as new multiple sclerosis susceptibility loci. Nat Genet. 2009;41:776–782. doi: 10.1038/ng.401. [DOI] [PMC free article] [PubMed] [Google Scholar]
- 4.International Multiple Sclerosis Genetics Consortium (IMSGC) Comprehensive follow-up of the first genome-wide association study of multiple sclerosis identifies KIF21B and TMEM39A as susceptibility loci. Hum Mol Genet. 2010;19:953–962. doi: 10.1093/hmg/ddp542. [DOI] [PMC free article] [PubMed] [Google Scholar]
- 5.Oksenberg JR, Baranzini SE. Multiple sclerosis genetics—is the glass half full, or half empty? Nat Rev Neurol. 2010;6:429–437. doi: 10.1038/nrneurol.2010.91. [DOI] [PubMed] [Google Scholar]
- 6.Brassat D, Azais-Vuillemin C, Yaouanq J, Semana G, Reboul J, Cournu I, et al. Familial factors influence disability in MS multiplex families. French Multiple Sclerosis Genetics Group. Neurology. 1999;52:1632–1636. doi: 10.1212/wnl.52.8.1632. [DOI] [PubMed] [Google Scholar]
- 7.Barcellos LF, Oksenberg JR, Green AJ, Bucher P, Rimmler JB, Schmidt S, et al. Genetic basis for clinical expression in multiple sclerosis. Brain. 2002;125(Part 1):150–158. doi: 10.1093/brain/awf009. [DOI] [PubMed] [Google Scholar]
- 8.Hensiek AE, Seaman SR, Barcellos LF, Oturai A, Eraksoi M, Cocco E, et al. Familial effects on the clinical course of multiple sclerosis. Neurology. 2007;68:376–383. doi: 10.1212/01.wnl.0000252822.53506.46. [DOI] [PubMed] [Google Scholar]
- 9.Cree BA, Khan O, Bourdette D, Goodin DS, Cohen JA, Marrie RA, et al. Clinical characteristics of African Americans vs Caucasian Americans with multiple sclerosis. Neurology. 2004;63:2039–2045. doi: 10.1212/01.wnl.0000145762.60562.5d. [DOI] [PubMed] [Google Scholar]
- 10.Butterfield RJ, Blankenhorn EP, Roper RJ, Zachary JF, Doerge RW, Teuscher C. Identification of genetic loci controlling the characteristics and severity of brain and spinal cord lesions in experimental allergic encephalomyelitis. Am J Pathol. 2000;157:637–645. doi: 10.1016/S0002-9440(10)64574-9. [DOI] [PMC free article] [PubMed] [Google Scholar]
- 11.Polanczyk M, Yellayi S, Zamora A, Subramanian S, Tovey M, Vandenbark AA, et al. Estrogen receptor-1 (Esr1) and -2 (Esr2) regulate the severity of clinical experimental allergic encephalomyelitis in male mice. Am J Pathol. 2004;164:1915–1924. doi: 10.1016/s0002-9440(10)63752-2. [DOI] [PMC free article] [PubMed] [Google Scholar]
- 12.Mazon Pelaez I, Vogler S, Strauss U, Wernhoff P, Pahnke J, Brockmann G, et al. Identification of quantitative trait loci controlling cortical motor evoked potentials in experimental autoimmune encephalomyelitis: correlation with incidence, onset and severity of disease. Hum Mol Genet. 2005;14:1977–1989. doi: 10.1093/hmg/ddi203. [DOI] [PubMed] [Google Scholar]
- 13.Stromnes IM, Cerretti LM, Liggitt D, Harris RA, Goverman JM. Differential regulation of central nervous system autoimmunity by T(H)1 and T(H)17 cells. Nat Med. 2008;14:337–342. doi: 10.1038/nm1715. [DOI] [PMC free article] [PubMed] [Google Scholar]
- 14.Roxburgh RH, Seaman SR, Masterman T, Hensiek AE, Sawcer SJ, Vukusic S, et al. Multiple Sclerosis Severity Score: using disability and disease duration to rate disease severity. Neurology. 2005;64:1144–1151. doi: 10.1212/01.WNL.0000156155.19270.F8. [DOI] [PubMed] [Google Scholar]
- 15.Pachner AR, Steiner I. The multiple sclerosis severity score (MSSS) predicts disease severity over time. J Neurol Sci. 2009;278:66–70. doi: 10.1016/j.jns.2008.11.020. [DOI] [PubMed] [Google Scholar]
- 16.Daumer M, Neuhaus A, Herbert J, Ebers G. Prognosis of the individual course of disease: the elements of time, heterogeneity and precision. J Neurol Sci. 2009;287(Suppl 1):S50–S55. doi: 10.1016/S0022-510X(09)71301-2. [DOI] [PubMed] [Google Scholar]
- 17.Burwick RM, Ramsay PP, Haines JL, Hauser SL, Oksenberg JR, Pericak-Vance MA, et al. APOE epsilon variation in multiple sclerosis susceptibility and disease severity: some answers. Neurology. 2006;66:1373–1383. doi: 10.1212/01.wnl.0000210531.19498.3f. [DOI] [PubMed] [Google Scholar]
- 18.Jensen CJ, Stankovich J, Van der Walt A, Bahlo M, Taylor BV, van der Mei IA, et al. Multiple sclerosis susceptibility-associated SNPs do not influence disease severity measures in a cohort of Australian MS patients. PLoS One. 2010;5:e10003. doi: 10.1371/journal.pone.0010003. [DOI] [PMC free article] [PubMed] [Google Scholar]
- 19.Johnson BA, Wang J, Taylor EM, Caillier SJ, Herbert J, Khan OA, et al. Multiple sclerosis susceptibility alleles in African Americans. Genes Immun. 2010;11:343–350. doi: 10.1038/gene.2009.81. [DOI] [PMC free article] [PubMed] [Google Scholar]
- 20.DeLuca GC, Ramagopalan SV, Herrera BM, Dyment DA, Lincoln MR, Montpetit A, et al. An extremes of outcome strategy provides evidence that multiple sclerosis severity is determined by alleles at the HLA-DRB1 locus. Proc Natl Acad Sci USA. 2007;104:20896–20901. doi: 10.1073/pnas.0707731105. [DOI] [PMC free article] [PubMed] [Google Scholar]
- 21.Baranzini SE, Wang J, Gibson RA, Galwey N, Naegelin Y, Barkhof F, et al. Genome-wide association analysis of susceptibility and clinical phenotype in multiple sclerosis. Hum Mol Genet. 2009;18:767–778. doi: 10.1093/hmg/ddn388. [DOI] [PMC free article] [PubMed] [Google Scholar]
- 22.Brynedal B, Wojcik J, Esposito F, Debailleul V, Yaouanq J, Martinelli-Boneschi F, et al. MGAT5 alters the severity of multiple sclerosis. J Neuroimmunol. 2010;220:120–124. doi: 10.1016/j.jneuroim.2010.01.003. [DOI] [PubMed] [Google Scholar]
- 23.Kanehisa M, Goto S. KEGG: Kyoto encyclopedia of genes and genomes. Nucleic Acids Res. 2000;28:27–30. doi: 10.1093/nar/28.1.27. [DOI] [PMC free article] [PubMed] [Google Scholar]
- 24.Kanehisa M, Goto S, Furumichi M, Tanabe M, Hirakawa M. KEGG for representation and analysis of molecular networks involving diseases and drugs. Nucleic Acids Res. 2010;38:D355–D360. doi: 10.1093/nar/gkp896. [DOI] [PMC free article] [PubMed] [Google Scholar]
- 25.Kanehisa M, Goto S, Hattori M, Aoki-Kinoshita KF, Itoh M, Kawashima S, et al. From genomics to chemical genomics: new developments in KEGG. Nucleic Acids Res. 2006;34:D354–D357. doi: 10.1093/nar/gkj102. [DOI] [PMC free article] [PubMed] [Google Scholar]
- 26.Pugliatti M, Rosati G, Carton H, Riise T, Drulovic J, Vecsei L, et al. The epidemiology of multiple sclerosis in Europe. Eur J Neurol. 2006;13:700–722. doi: 10.1111/j.1468-1331.2006.01342.x. [DOI] [PubMed] [Google Scholar]
- 27.Ioannidis JP, Patsopoulos NA, Evangelou E. Heterogeneity in meta-analyses of genome-wide association investigations. PLoS One. 2007;2:e841. doi: 10.1371/journal.pone.0000841. [DOI] [PMC free article] [PubMed] [Google Scholar]
- 28.Sommer L, Rao M, Anderson DJ. RPTP delta and the novel protein tyrosine phosphatase RPTP psi are expressed in restricted regions of the developing central nervous system. Dev Dyn. 1997;208:48–61. doi: 10.1002/(SICI)1097-0177(199701)208:1<48::AID-AJA5>3.0.CO;2-1. [DOI] [PubMed] [Google Scholar]
- 29.Schaapveld RQ, Schepens JT, Bachner D, Attema J, Wieringa B, Jap PH, et al. Developmental expression of the cell adhesion molecule-like protein tyrosine phosphatases LAR, RPTPdelta and RPTPsigma in the mouse. Mech Dev. 1998;77:59–62. doi: 10.1016/s0925-4773(98)00119-1. [DOI] [PubMed] [Google Scholar]
- 30.Wang J, Bixby JL. Receptor tyrosine phosphatase-delta is a homophilic, neurite-promoting cell adhesion molecular for CNS neurons. Mol Cell Neurosci. 1999;14:370–384. doi: 10.1006/mcne.1999.0789. [DOI] [PubMed] [Google Scholar]
- 31.Kwon SK, Woo J, Kim SY, Kim H, Kim E. Trans-synaptic adhesions between netrin-G ligand-3 (NGL-3) and receptor tyrosine phosphatases LAR, protein-tyrosine phosphatase delta (PTPdelta), and PTPsigma via specific domains regulate excitatory synapse formation. J Biol Chem. 2010;285:13966–13978. doi: 10.1074/jbc.M109.061127. [DOI] [PMC free article] [PubMed] [Google Scholar]
- 32.Uetani N, Kato K, Ogura H, Mizuno K, Kawano K, Mikoshiba K, et al. Impaired learning with enhanced hippocampal long-term potentiation in PTPdelta-deficient mice. EMBO J. 2000;19:2775–2785. doi: 10.1093/emboj/19.12.2775. [DOI] [PMC free article] [PubMed] [Google Scholar]
- 33.Uetani N, Chagnon MJ, Kennedy TE, Iwakura Y, Tremblay ML. Mammalian motoneuron axon targeting requires receptor protein tyrosine phosphatases sigma and delta. J Neurosci. 2006;26:5872–5880. doi: 10.1523/JNEUROSCI.0386-06.2006. [DOI] [PMC free article] [PubMed] [Google Scholar]
- 34.Shyur SD, Wang JY, Lin CG, Hsiao YH, Liou YH, Wu YJ, et al. The polymorphisms of protein-tyrosine phosphatase receptor-type delta gene and its association with pediatric asthma in the Taiwanese population. Eur J Hum Genet. 2008;16:1283–1288. doi: 10.1038/ejhg.2008.79. [DOI] [PubMed] [Google Scholar]
- 35.Manconi M, Fabbrini M, Bonanni E, Filippi M, Rocca M, Murri L, et al. High prevalence of restless legs syndrome in multiple sclerosis. Eur J Neurol. 2007;14:534–539. doi: 10.1111/j.1468-1331.2007.01740.x. [DOI] [PubMed] [Google Scholar]
- 36.Manconi M, Ferini-Strambi L, Filippi M, Bonanni E, Iudice A, Murri L, et al. Multicenter case–control study on restless legs syndrome in multiple sclerosis: the REMS study. Sleep. 2008;31:944–952. [PMC free article] [PubMed] [Google Scholar]
- 37.Okonkwo DO, Pettus EH, Moroi J, Povlishock JT. Alteration of the neurofilament sidearm and its relation to neurofilament compaction occurring with traumatic axonal injury. Brain Res. 1998;784:1–6. doi: 10.1016/s0006-8993(97)01075-5. [DOI] [PubMed] [Google Scholar]
- 38.Khazaei MR, Bunk EC, Hillje AL, Jahn HM, Riegler EM, Knoblich JA, et al. The E3-ubiquitin ligase TRIM2 regulates neuronal polarization. J Neurochem. 2011;117:29–37. doi: 10.1111/j.1471-4159.2010.06971.x. [DOI] [PubMed] [Google Scholar]
- 39.Balastik M, Ferraguti F, Pires-da Silva A, Lee TH, Alvarez-Bolado G, Lu KP, et al. Deficiency in ubiquitin ligase TRIM2 causes accumulation of neurofilament light chain and neurodegeneration. Proc Natl Acad Sci USA. 2008;105:12016–12021. doi: 10.1073/pnas.0802261105. [DOI] [PMC free article] [PubMed] [Google Scholar]
- 40.Watanabe M, Isobe T, Ichimura T, Kuwano R, Takahashi Y, Kondo H. Molecular cloning of rat cDNAs for beta and gamma subtypes of 14-3-3 protein and developmental changes in expression of their mRNAs in the nervous system. Brain Res Mol Brain Res. 1993;17:135–146. doi: 10.1016/0169-328x(93)90082-z. [DOI] [PubMed] [Google Scholar]
- 41.Chen XQ, Yu AC. The association of 14-3-3gamma and actin plays a role in cell division and apoptosis in astrocytes. Biochem Biophys Res Commun. 2002;296:657–663. doi: 10.1016/s0006-291x(02)00895-1. [DOI] [PubMed] [Google Scholar]
- 42.Ye SQ, Zhou XY, Lai XJ, Zheng L, Chen XQ. Silencing neuroglobin enhances neuronal vulnerability to oxidative injury by down-regulating 14-3-3gamma. Acta Pharmacol Sin. 2009;30:913–918. doi: 10.1038/aps.2009.70. [DOI] [PMC free article] [PubMed] [Google Scholar]
- 43.Dong Y, Zhao R, Chen XQ, Yu AC. 14-3-3gamma and neuroglobin are new intrinsic protective factors for cerebral ischemia. Mol Neurobiol. 2010;41:218–231. doi: 10.1007/s12035-010-8142-4. [DOI] [PubMed] [Google Scholar]
- 44.Ewart AK, Morris CA, Ensing GJ, Loker J, Moore C, Leppert M, et al. A human vascular disorder, supravalvular aortic stenosis, maps to chromosome 7. Proc Natl Acad Sci USA. 1993;90:3226–3230. doi: 10.1073/pnas.90.8.3226. [DOI] [PMC free article] [PubMed] [Google Scholar]
- 45.Komoike Y, Fujii K, Nishimura A, Hiraki Y, Hayashidani M, Shimojima K, et al. Zebrafish gene knockdowns imply roles for human YWHAG in infantile spasms and cardiomegaly. Genesis. 2010;48:233–243. doi: 10.1002/dvg.20607. [DOI] [PubMed] [Google Scholar]
- 46.Wheeler E, Bolton C, Mullins J, Paul C. Identification of the NMDA receptor subunit inovolved in blood-brain barrier breakdown during EAE. Immunology. 2002;107(Suppl 1):43–47. [Google Scholar]
- 47.Bolton C, Paul C. Glutamate receptors in neuroinflammatory demyelinating disease. Mediat Inflamm. 2006;2006:93684. doi: 10.1155/MI/2006/93684. [DOI] [PMC free article] [PubMed] [Google Scholar]
- 48.Laurie DJ, Bartke I, Schoepfer R, Naujoks K, Seeburg PH. Regional, developmental and interspecies expression of the four NMDAR2 subunits, examined using monoclonal anti-bodies. Brain Res Mol Brain Res. 1997;51:23–32. doi: 10.1016/s0169-328x(97)00206-4. [DOI] [PubMed] [Google Scholar]
- 49.Mohrmann R, Hatt H, Gottmann K. Developmental regulation of subunit composition of extrasynaptic NMDA receptors in neocortical neurones. NeuroReport. 2000;11:1203–1208. doi: 10.1097/00001756-200004270-00012. [DOI] [PubMed] [Google Scholar]
- 50.Salter MG, Fern R. NMDA receptors are expressed in developing oligodendrocyte processes and mediate injury. Nature. 2005;438:1167–1171. doi: 10.1038/nature04301. [DOI] [PubMed] [Google Scholar]
- 51.Karadottir R, Cavelier P, Bergersen LH, Attwell D. NMDA receptors are expressed in oligodendrocytes and activated in ischaemia. Nature. 2005;438:1162–1166. doi: 10.1038/nature04302. [DOI] [PMC free article] [PubMed] [Google Scholar]
- 52.Micu I, Jiang Q, Coderre E, Ridsdale A, Zhang L, Woulfe J, et al. NMDA receptors mediate calcium accumulation in myelin during chemical ischaemia. Nature. 2006;439:988–992. doi: 10.1038/nature04474. [DOI] [PubMed] [Google Scholar]
- 53.Groc L, Heine M, Cousins SL, Stephenson FA, Lounis B, Cognet L, et al. NMDA receptor surface mobility depends on NR2A-2B subunits. Proc Natl Acad Sci USA. 2006;103:18769–18774. doi: 10.1073/pnas.0605238103. [DOI] [PMC free article] [PubMed] [Google Scholar]
- 54.Turic D, Langley K, Mills S, Stephens M, Lawson D, Govan C, et al. Follow-up of genetic linkage findings on chromosome 16p13: evidence of association of N-methyl-Daspartate glutamate receptor 2A gene polymorphism with ADHD. Mol Psychiatry. 2004;9:169–173. doi: 10.1038/sj.mp.4001387. [DOI] [PubMed] [Google Scholar]
- 55.Barnby G, Abbott A, Sykes N, Morris A, Weeks DE, Mott R, et al. Candidate-gene screening and association analysis at the autism-susceptibility locus on chromosome 16p: evidence of association at GRIN2A and ABAT. Am J Hum Genet. 2005;76:950–966. doi: 10.1086/430454. [DOI] [PMC free article] [PubMed] [Google Scholar]
- 56.Tang J, Chen X, Xu X, Wu R, Zhao J, Hu Z, et al. Significant linkage and association between a functional (GT)n polymorphism in promoter of the N-methyl-d-aspartate receptor subunit gene (GRIN2A) and schizophrenia. Neurosci Lett. 2006;409:80–82. doi: 10.1016/j.neulet.2006.09.022. [DOI] [PubMed] [Google Scholar]
- 57.Arning L, Kraus PH, Valentin S, Saft C, Andrich J, Epplen JT. NR2A and NR2B receptor gene variations modify age at onset in Huntington disease. Neurogenetics. 2005;6:25–28. doi: 10.1007/s10048-004-0198-8. [DOI] [PubMed] [Google Scholar]
- 58.Arning L, Saft C, Wieczorek S, Andrich J, Kraus PH, Epplen JT. NR2A and NR2B receptor gene variations modify age at onset in Huntington disease in a sex-specific manner. Hum Genet. 2007;122:175–182. doi: 10.1007/s00439-007-0393-4. [DOI] [PubMed] [Google Scholar]
- 59.Andresen JM, Gayan J, Cherny SS, Brocklebank D, Alkorta-Aranburu G, Addis EA, et al. Replication of twelve association studies for Huntington’s disease residual age of onset in large Venezuelan kindreds. J Med Genet. 2007;44:44–50. doi: 10.1136/jmg.2006.045153. [DOI] [PMC free article] [PubMed] [Google Scholar]
- 60.Consortium ITIMSG IL12A, MPHOSPH9/CDK2AP1 and RGS1 are novel multiple sclerosis susceptibility loci. Genes Immun. 2010;11:397–405. doi: 10.1038/gene.2010.28. [DOI] [PMC free article] [PubMed] [Google Scholar]
- 61.McDonald WI, Compston A, Edan G, Goodkin D, Hartung HP, Lublin FD, et al. Recommended diagnostic criteria for multiple sclerosis: guidelines from the International Panel on the diagnosis of multiple sclerosis. Ann Neurol. 2001;50:121–127. doi: 10.1002/ana.1032. [DOI] [PubMed] [Google Scholar]
- 62.Hafler DA, Compston A, Sawcer S, Lander ES, Daly MJ, De Jager PL, et al. Risk alleles for multiple sclerosis identified by a genomewide study. N Engl J Med. 2007;357:851–862. doi: 10.1056/NEJMoa073493. [DOI] [PubMed] [Google Scholar]
- 63.Efron E, Tibshirani RJ. An Introduction to the Bootstrap. Chapman & Hall/CRC; New York: 1993. [Google Scholar]
- 64.Zhang B, Kirov S, Snoddy J. WebGestalt: an integrated system for exploring gene sets in various biological contexts. Nucleic Acids Res. 2005;33:W741–W748. doi: 10.1093/nar/gki475. [DOI] [PMC free article] [PubMed] [Google Scholar]
Associated Data
This section collects any data citations, data availability statements, or supplementary materials included in this article.