Abstract
The mouse laser injury thrombosis model provides up to 0.22 μm-resolved voxel information about the pore architecture of the dense inner core and loose outer shell regions of an in-vivo arterial thrombus. Computational studies were conducted on this 3D structure to quantify transport within and around the clot: Lattice Boltzmann method defined vessel hemodynamics, while passive Lagrangian Scalar Tracking with Brownian motion contribution simulated diffusive-convective transport of various inert solutes (released from lumen or the injured wall). For an input average lumen blood velocity of 0.478 cm/s (measured by Doppler velocimetry), a 0.2 mm/s mean flow rate was obtained within the thrombus structure, most of which occurred in the 100-fold more permeable outer shell region (calculated permeability of the inner core was 10−11 cm2). Average wall shear stresses were 80–100 dyne/cm2 (peak values > 200 dyne/cm2) on the outer rough surface of the thrombus. Within the thrombus, small molecule tracers (0.1 kDa) experienced ~70,000 collisions/sec and penetrated/exited it in about 1 sec, whereas proteins (~50 kDa) had ~9,000 collisions/sec and required about 10 sec (tortuosity ~ 2 to 2.5). These simulations help define physical processes during thrombosis and constraints for drug delivery to the thrombus.
Key Terms: Blood, Lattize Boltzmann, Confocal Microscopy, Brownian, Diffusion, Permeability, Stresses, Drug Delivery, Computation, Modeling
INTRODUCTION
Inadequate thrombus formation can result in bleeding, while excessive platelet aggregation or coagulation can lead to pathogenic thrombosis. The thrombus growth rate, mechanical stability, and risk of embolism are all emergent properties that depend on reaction processes within the porous structure as it forms under flow conditions. As platelets are recruited from the blood stream to the injury site, a complex interplay between their activation state, transport of coagulation factors and hemodynamic forces is responsible for determining the thrombus structure and function.
Despite the underlying complexity of the coupled processes involved in hemostasis, the resulting thrombotic structures do have some organization. Recent microscopy studies have observed the thrombus structure to be hierarchical, with two distinct regions: a densely packed “core” nearest the injury site (composed of highly activated platelets that have undergone αgranule exocytosis and phosphatidylserine exposure) and a loose “shell” overlaying the core composed of less activated platelets that have retained a discoid shape.3 Moreover, from own microscopy studies, the thrombus shell consists of loosely associated platelets that are subject to continual removal by flow forces.34 Within the thrombus core, platelet agonists may become enriched since molecular transit may be reduced by the core having restricted pores.7
In this work, we investigated the coupling between blood flow, transport of inert solutes, and the inner architecture of the porous thrombus. Utilizing the capability of intravital confocal microscopy to provide 3D thrombus structure with a single platelet resolution, we implemented a combination of in-vivo experiments, biomedical imaging, and computer simulations in order to quantify the intrathrombic microenvironment (Figure 1). This approach offers several advantages over the conventional blood systems biology models (for example Platelet Adhesive Dynamics). Specifically, while the typical simulations rely on generating the thrombus structure mathematically, in image-based modeling it is obtained from experiment. Therefore, instead of having to couple four different components (fluid mechanics, coagulation cascade, cell mechanics and receptor-ligand binding),40 the model is reduced to just two: hydrodynamics and transport of platelet agonists. This is a significant gain, since the bypassed parts of the simulations are the most complex ones and often rely on assumptions due to lack of experimental parameters. At the same time, the disadvantages of the image-based modeling methodology are relatively insignificant: the thrombus structure is static and the mesh resolution is limited by the quality of the microscope. Hence, the trade-off involved is considered to be a lucrative opportunity to obtain a top-down insight into the intra-thombic microenvironment that would otherwise be inaccessible.
Figure 1.
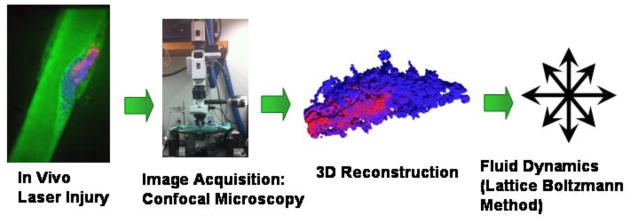
Schematic of the multidisciplinary investigation approach implemented in this manuscript. Red color marks activated thrombus core; blue marks the thrombus shell; green marks the lumen and interstitial space within the thrombus.
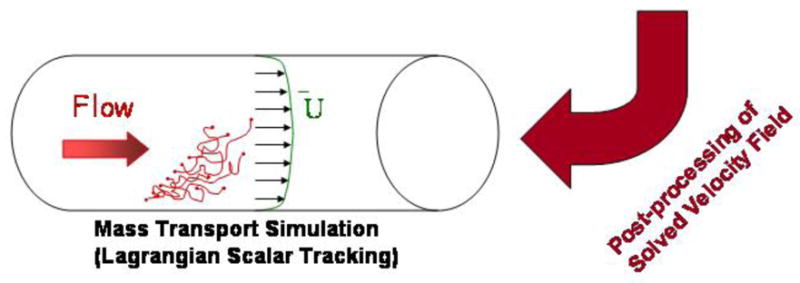
In order to build this model, a thrombus was induced via laser injury in a mouse cremaster muscle arteriole and imaged using fluorescent confocal microscopy. The 3D thrombus reconstruction recovers the pore space and its connectivity with up to 0.22 μm resolution (voxel-to-voxel distance) and this complex object was used in silico to model the fluid dynamic environment experienced by the thrombus due to blood flow in microvasculature as follows: (1) Lattice Boltzmann method (LBM) was implemented in order to obtain bulk fluid velocities around the thrombus and surface stresses; (2) permeability of the thrombus to flow of blood plasma was calculated in order to characterize the convective component of inner thrombus transport; and (3) convective/diffusive transport of inert molecular species with prescribed diffusivity within the thrombus pore space was modeled using passive Lagrangian Scalar Tracking (LST) with a Brownian motion component (Figure 1). Because the Brownian contribution to the motion of molecules is largely a function of their size, molecular weights of calcium ion (Ca2+), adenosine diphosphate (ADP), or Factor X (FX) were chosen as the representative low, medium and high MW tracers, respectively. Two modes of tracer release and transport were investigated: (1) release from the blood stream into the thrombus toward the injury site, and (2) release from the injury site across the thrombus and into the blood. Improved analysis of molecular and fluid transport within the thrombus pore space facilitates deeper understanding of thrombogenesis, therapeutic delivery of drugs, and in-vivo diagnostic imaging.
METHODS
In-vivo laser injury model and intravital microscopy
Procedures and protocols in this study were approved by the Institutional Animal Care and Use Committee (IACUC) of the University of Pennsylvania. Thrombus formation was visualized in the cremaster muscle microcirculation of mice according to procedures originally developed by Falati et al.16 Briefly, in order to obtain the thrombus structure, intravital microscopy experiments were performed in male C57Bl/6J mice 8–12 weeks of age (Jackson Laboratories, Bar Harbor, ME). The structure of the thrombus formed due to the laser injury was imaged using confocal microscopy. Alexa-fluor monoclonal antibody labeling kits from Invitrogen (Carlsbad, CA) were used to label antibodies. Anti-CD41 F(ab)2 fragments (clone MWReg30, BD Biosciences, San Diego, CA) were used to visualize platelet surfaces, anti-P-selectin (clone RB40.34, BD Bioscience) was used to visualize degranulated platelets, and Alexa-fluor 488 tagged dextran (3 kD, Invitrogen) was used to image the lumen and the interstitial space between the thrombus cells. The center line maximum velocity through the mouse blood vessels was measured using optical Doppler velocimetry, and divided by a factor of 1.6 (to account for an artifact of the measuring technique that causes velocity profiles to appear slightly blunted and non-parabolic due to out-of-focus cells modulating the light intensity signals) in order to obtain the average blood vessel velocity of 4.78 mm/s.5,13,18 The velocimetry measurement was taken in a region away from the thrombus where the velocity field was not affected by its presence.
3D image acquisition and reconstruction
Slidebook 5 software was used in order to acquire images from the confocal microscope at 0.22 μm pixel-to-pixel distance and 0.5 μm inter-slice separation (interpolated to 0.22 μm to be consistent with the pixel size). “Constrained Iterative” 3D deconvolution algorithm (developed by David Agard at UCSF) was used to deblur the images.1 A custom Matlab® code was then used to enhance the signal-to-noise ratio of the 2D image stack (See Supplemental Methods for a further discussion of image processing and accuracy). Platelets in the thrombus were detected and segmented from the rest of the image based on their characteristic intensities and shapes. The images were then assembled into a 3D stack in order to reconstruct a cubic lattice representative of the impermeable, solid phase geometry (an example shown in Figure 1). Also, the Qhull algorithm was used to define the total thrombus volume.2 The obtained Qhull mask was eroded with a cubic structuring element (size 93 voxels) using Matlab in order to avoid the outer boundary of the thrombus, where exceptionally high shear rates occur. The final thrombus geometry was used for flow dynamics calculations as described in the next section, and the Qhull volume was used to average any intra-thrombic results. Since the imaged thrombus structure is fixed, the underlying conjecture of this methodology is that the thrombus deformation occurs slower than does the transport within it. Thus, the results presented herein provide a glimpse of the intrathrombic microenvironment during a snapshot in time. Furthermore, the accuracy of the study is limited by the image resolution, which limits the capture of any physics or details of the thrombus structure occurring at length scales smaller than 0.22 μm in the plane of the confocal images and 0.5μm in the perpendicular direction. Though, not many features below this resolution are expected to be present in the thrombus, since most of the fibrin in arterial clots is typically located in the extravascular space.34
Lattice Boltzmann Method (LBM) simulation of fluid flow
Convection within the blood vessel and within the porous thrombus was modeled via LBM. LBM is a numerical technique for simulating fluid flow that consists of solving the discrete Boltzmann equation.9,35,36 In addition to computational advantages e.g., LBM is inherently parallelizable, 20,39 LBM techniques have been used in a wide spectrum of applications [turbulence, 12 non-Newtonian flows 6,17,43, and multiphase flows 37]. LBM is especially appropriate for modeling pore-scale flow within porous media due to the simplicity with which it handles complicated boundaries. A parallelized, in-house LBM code was used for this work employing a D3Q15 lattice 31 in conjunction with the single-relaxation time approximation of the collision term given by Bhatnagar et al. 4 The no-slip boundary condition was applied at the wall faces using the “bounce-back” technique.36 The LBM results were validated for several flow cases having analytical solutions: flow in a slit, pipe, or around an array of spheres, which is particularly relevant for porous media flow. 38
The average lumen blood velocity in LBM was matched to the in-vivo value obtained by optical Doppler velocimetry for the 65 μm diameter vessel. Since the thrombus was imaged 5 min post injury, the laser injury underneath the thrombus was completely sealed (no blood flow was detected out of the arteriole). Also, by 5 min post injury, the thrombus structure does not change shape significantly. Maximum thrombus dimensions (corresponding to the dimensions of a smallest bounding box) were: 108.4 μm length (along the direction of the arteriole), 26.0 μm width (of projection shown in Figure 4-Right), and 34.1 μm height (of projection shown in Figure 4-Right). While the fluid dynamic viscosity of blood is known to be shear-dependent 26,41, we assume Newtonian blood viscosity of μ ≈ 0.03 gr/cm-s.21,23. This is considered to be a good assumption due to the low hematocrit typically observed in microvasculature.14 The simulations were considered converged when smallest, average and highest flow velocities in the whole simulation domain varied by less than 0.001% per 1000 steps. Approximately 80,000 steps were needed for full conversion. The image-based LBM simulation results were validated against an idealized homogeneous porous media model of a thrombus using a commercial fluid dynamics package COMSOL®
Figure 4.
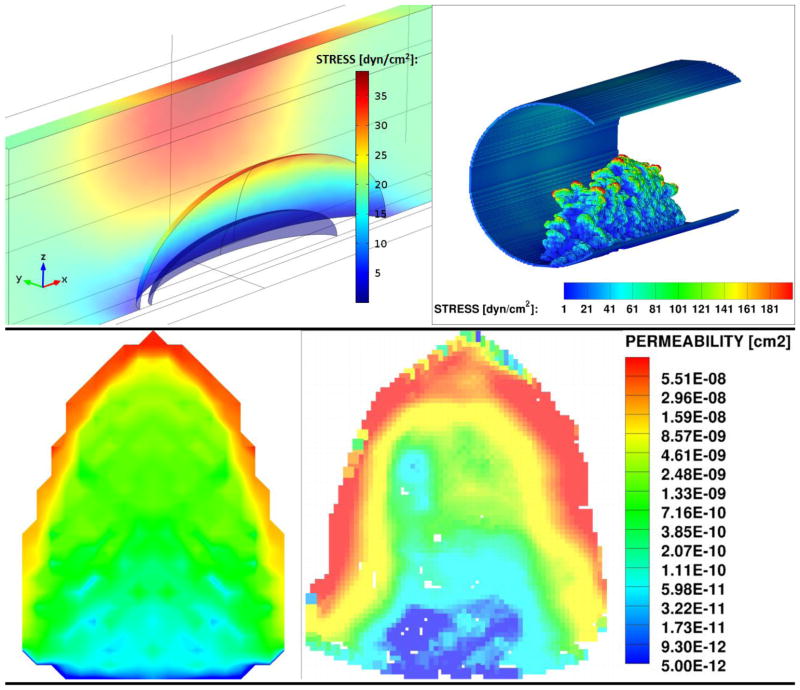
Comparison of thrombus permeability (Left) obtained from COMSOL (Right) calculated based on LBM results. Both are averaged over the length of the thrombus in the flow direction (perpendicular to the image).
Lagrangian Scalar Tracking (LST) of solute transport
Macroscopic solute transport was modeled using LST. 28,29 The fundamental hypothesis of this method is that solute transport behavior of passive, nonbinding tracers is a combination of convection (obtained using the velocity field from the LBM simulations) and diffusion (obtained from a mesoscopic Monte-Carlo approach that simulates Brownian motion). The LST method follows tracers that are passive (i.e., they do not affect the flow field, bind the solid phase, or experience molecularly hindered diffusion). The new position of a tracer at time t+1 is calculated from its previous position X⃗ at time t based on convection and diffusion, as given by:
| (1) |
where U⃗t is the fluid velocity at the particle location also at time t. The velocity is interpolated from the steady-state solution obtained from the LBM simulation via trilinear interpolation using the 8 nearest cubic lattice points. In order to stay consistent with the LBM bounce-back boundary condition, the LST particles are reflected to their previous position upon collision with a solid wall. Although the nature of the particle reflection could range anywhere between bounce-back (e.g. most fluid-solid no slip interfaces) to adsorption/adhesion/desorption kinetics (e.g. particles with strong interactions) to bounce forward (e.g. gas-fluid full slip interface), depending on the solute force interactions with the thrombus surface, the current study is limited to the former case no slip case for simplicity.
This method allows simulation of various Schmidt number solutes (Sc = ν/D where ν is kinematic viscosity and D is unhindered Brownian diffusivity in water at 37°C). The rate of molecular dispersion in one direction, say the X direction, is proportional to its diffusivity, as described by Einstein’s theory for Brownian motion 15:
| (2) |
The random diffusion of tracers follows a normal distribution with a zero mean and standard deviation σ, as denoted by N(0,σ). The ‘Mersenne Twister’ random number generator with a cycle of length (219937 − 1) is used for all random number generation in the LST code.25 The molecular dispersion in each one direction has a standard deviation that is given by , where D0 is the nominal molecular diffusivity (i.e. diffusivity that the tracers would have if their motion was purely Brownian). The properties of the fluid, i.e., the Schmidt number of the fluid, are thus taken into account. Equation (2) can now be written as follows:
| (3) |
In one mode of release, the LST tracers are released from the site of the injury and tracked as they move through the rest of the thrombus structure (where the injury is defined as the surface of the blood vessel under the upstream half of the thrombus). In the second mode of release, the tracers are released at the blood vessel inlet and their motion is tracked to the injury site. Since tracer numbers greater than 10,000 were found to be unnecessary in order to reproduce the results reported in this manuscript, this was the number used for the LST simualtions.
Continuum modeling of thrombus transport dynamics using finite element method
To validate the image-based LBM/LST results, a homogeneous porous media model of a thrombus in a blood vessel was simulated in COMSOL® version 4.2 (a commercial finite element fluid dynamics solver). In the model the idealized thrombus structure is represented by two distinct porous media regions: a homogeneous core with porosity of 0.3 and a homogeneous shell with a porosity of 0.7 (porosities obtained from the 3D reconstruction of the confocal microscopy image). The shell and core permeabilities, which were needed to characterize the porous media in COMSOL, were estimated using the Blake-Kozeny-Carman equation:
| (4) |
where ε is the porous medium porosity, S is the specific surface area, and K is the Kozeny “constant” (experimentally observed to be ≈ 5 for a wide variety of porous media with a range of porosities between 0.4 and 0.7).33 The specific surface area, similarly to porosity, was calculated from the 3D reconstruction of the fluorescent confocal microscopy images. The obtained value for S was found to be ~ 24,400 cm2/cm3. The final estimates for the core and shell permeabilities were 1.85 × 10⁻¹¹ cm2 and 1.28 × 10⁻⁹ cm2, respectively.
The porous thrombus was placed at the bottom of a 65 μm diameter cylinder, which represented the blood vessel. The fluid viscosity in the COMSOL model was same as in LBM: μ = 0.03 gr/cm-s. The inlet condition to the blood vessel was set to match a parabolic profile expected in pressure driven flow at the average blood vessel velocity that was measured from velocimetry. The outlet condition was set to be zero pressure. In order to reduce the computational intensity of the simulation, a symmetry condition was applied along the plane that cuts the cylinder and thrombus vertically, in half, along the direction of flow. Solute transport in COMSOL was modeled using an Eulerian approach, rather than Lagrangian, and the symmetry condition was imposed by applying a no mass flux requirement in the normal direction across the boundary.
RESULTS AND DISCUSSION
Intrathrombus velocity field
To simulate conditions in a mouse cremaster muscle arteriole laser injury model, LBM simulations were performed using a geometry reconstructed from confocal microscopy. From the LBM results, the average intrathrombus velocity in the stream-wise direction is 0.2 mm/s, which is about an order of magnitude less than average blood velocity in the arteriole. Clearly, there is a net flow in the stream-wise direction that takes place within the thrombus, while the convection in the other directions through the thrombus is negligible.
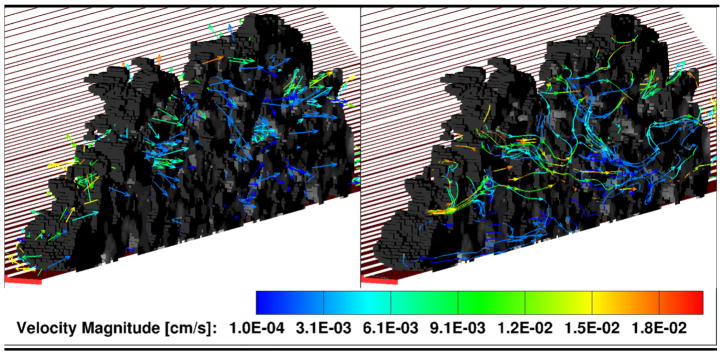
Since the thrombus structure is non-homogeneous, it is interesting to compare convection within different locations in its pore spacee. For this purpose, the local intra-thrombus velocity field visualized in 3D is shown Figure 2, where the velocity vectors (left) and streamlines (right) are plotted through a thrombus length-wise cross-section. Here, most of the flow occurs in the shell, while the compact core experiences significantly less permeation.
Figure 2.
Intra-thrombus velocity field (Left) and convective stream lines (Right). Red color marks the blood vessel; Gray scale is the porous thrombus structure. In both cases the simulation domain is cut in half along the flow direction in order to show the intra-thrombus environment. One half of the thrombus is shown, with the cut plane facing the reader. The other half is omitted.
Fluid stresses experienced by the thrombus
Since the thrombus partially obstructs blood flow within the vasculature, it experiences forces exerted by the passing fluid. These forces can drive thrombus break-up and embolism. Additionally, platelet adhesion and aggregation27 and activation19,32 are influenced by local shear rate. Therefore, it is interesting to calculate the stresses experienced by the platelets making up the blood clot structure. It is important to note that only stresses due to fluid shear are reported in this study, while events due to blood cell collisions with the thrombus are considered minimal due to the low hematocrit in microvasculature and are, thus, not taken into account.
The thrombus examined in this study obstructs about half way into the blood vessel (50% thrombus height to blood vessel diameter ratio), which is typical of thrombi observed during in vivo laser injury. In order to calculate the surface stresses due to fluid flow experienced by the thrombus within our model, the 3D velocity field obtained from LBM was differentiated following the scheme suggested by 30
| (5) |
where is the local velocity vector. The maximum fluid is the shear stress tensor, and U⃗ stresses in any direction are calculated at each surface node as the largest eigenvalues of . The final result is compared to COMSOL results in Figure 3.
Figure 3.
Maximum viscous fluid surface stresses experiences by the thrombus within microvasculature calculated from COMSOL (Left) and LBM (Right).
From both LBM and COMSOL simulations, the thrombus base (nearest the blood vessel wall) experiences stress values that are comparable to, or lower than, the upstream wall shear stress of 17.65 dyn/cm2 expected for an empty blood vessel at this flow rate. For comparison, experimentally measured wall stresses for similar size microvasculature of cat mesentery were found to be on the order of 40 dyn/cm2.24 The top part of the thrombus, on the other hand, protrudes into the center of the blood vessel and experiences stresses that are several fold higher than the wall stresses for the same shear rate: the ratio of stress experienced by the top of the thrombus top is roughly twice in the COMSOL model and up to four-to-five higher in the LBM model than the wall stress. The reason for this difference between the two models is that in COMSOL the thrombus structure is idealized and smooth, while in the LBM model it is composed of individual platelets where surface roughness causes heterogeneity of the surface shear stress. Therefore, the COMSOL model is representative of the lower bound of the expected stresses for the given flow conditions, while the LBM model is expected to be more accurate, since it takes into account the changes in the flow field due platelet-scale roughness of the actual thrombus surface. Nonetheless, the stresses predicted by both of the models are likely well below those needed for shear-induced platelet activation (although it is not well studied for mouse platelets). Since the stresses are dependent on viscosity, the error due to the Newtonian fluid assumption was tested against the Carreau blood viscosity model and was found to be approximately 6.3% for the peak stresses experienced by the thrombus.
Thrombus Darcy permeability
Permeability is a measure of the ability of a porous material to allow fluid to pass through it. It is the central characteristic of the porous media that is important to understanding convective transport through the thrombus. In order to calculate permeability, k, we use Brinkman’s empirical modification of Darcy’s law 8:
| (6) |
where the pressure drop across the thrombus is calculated by applying the Navier-Stokes equations to the converged velocity field from LBM. Figure 4 shows resulting Darcy permeability map averaged in the flow direction over the length of the thrombus for the COMSOL model (Left) and for the LBM model (Right). The resulting Darcy permeabilities ranged over two degrees of magnitude: from ~ 1 × 10⁻¹¹ cm2 in the thrombus core to ~ 1 × 10⁻⁹ cm2 in the thrombus shell. From Figure 4, the two models compare well, with the LBM model results showing more detail of permeability variations between the different regions in the thrombus. The fact that there is a two orders of magnitude difference between the permeability of the core and the shell reaffirms the finding that most of the convection is expected to take place in the shell region of the thrombus structure.
Intrathrombus diffusive transport of proteins: Injury-to-lumen release
In order to measure how various molecular species move within a blood clot, tracers with different diffusive properties were released from the injury site and tracked throughout the thrombus geometry. Since molecular diffusivity is a function of molecular size, a set of small, medium and high molecular weights (corresponding to that of Ca2+, ADP and Factor X, respectively) were used as the representative species in the simulation. Literature diffusivity values were used for ADP and FX, while the Ca2+ diffusivity was estimated using the Stokes-Einstein correlation for diffusion of spherical particles through liquid under low Reynolds number conditions (see Table 1):
| (7) |
where kB is the Boltzmann constant, T = absolute temperature (assumed to be body temperature of 310.15K), μ is the viscosity of the medium and R = 1.14 Å is the radius of a Ca2+ ion.
Table 1.
Intra-thrombus transport simulation results for coagulation factors of different molecular weights.
Figure 5 and Figure 6 are time plots of the percent remaining tracers in the thrombus and the average collision rates in the thrombus, respectively. From Figure 5, a much longer time is required for the tracers representing the large molecules to exit the thrombus than it does for the smaller-sized ones: 0.7 seconds for Ca2+, 1.7 seconds for ADP and 7.3 seconds for FX. This is because the smaller more dynamic molecules can make their way to the periphery of the thrombus faster and become entrained by the lumen flow there. The collision rates in Figure 6 are consistent with the observation that the smaller molecules are more dynamic, and, therefore, have higher collision rates than the larger molecules: Ca2+ undergoes almost 10 times more collisions with the thrombus surface per second than does FX. Interestingly, but expectedly, the average collision rates decrease with time for all three molecule types, because more of tracers begin to populate the porous shell where collisions with the thrombus surface are less probable.
Figure 5.
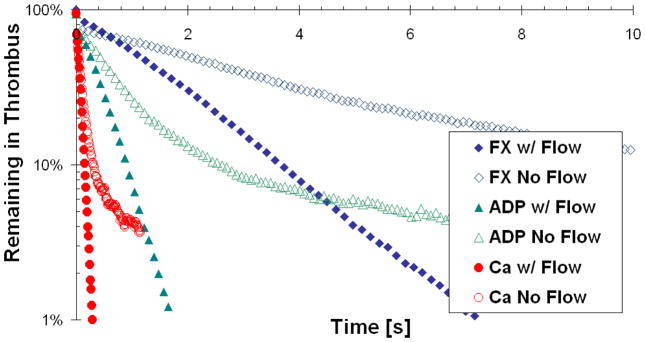
Percent of tracers remaining in the thrombus after the initial release at the injury site, as a function of time and molecule weight. Flow and no flow cases are presented for each tracer type.
Figure 6.
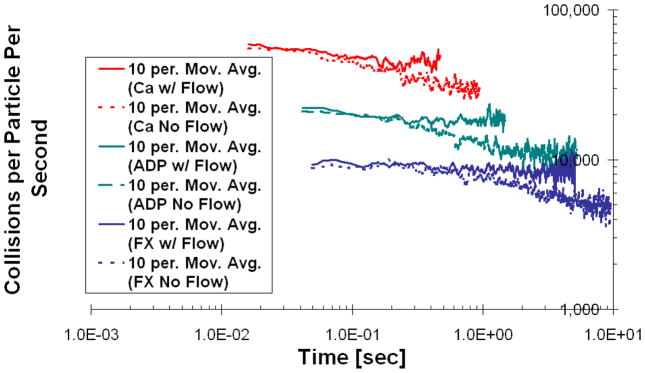
Average rate of collisions with the thrombus surface that each particle experiences after being released at the injury site, as a function of time and molecular weight. Data represented as moving average trend line with the number of periods equal to 10. Flow and no flow cases are presented for each tracer type.
Another interesting observation of tracer movement within the thrombus is that the dominant mode of exit for the tracers was out the sides of the clot, despite the fact that most of the intrathrombic convection takes place in the stream-wise direction according to the fluid dynamics solvers. This is because the thrombus is preferentially elongated in the stream-wise dimension (a typical thrombus structure thickness is approximately a third of its length in the stream wise direction, possibly due to the shape of the injured endothelial cell that serves as its base), and the tracers can traverse the thrombus width faster than its length.
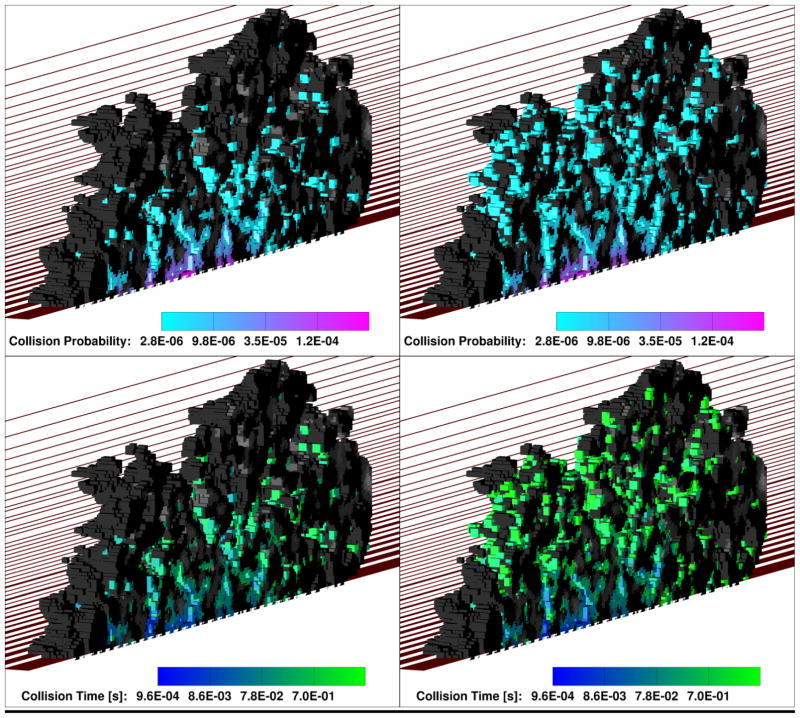
In order to further explore how convection affects tracer transport within the thrombus, we artificially turned off the flow in the simulation and modeled tracer release from the injury site using purely diffusive transport. Both Figure 5 and Figure 6 show that in the no-flow case the tracers remain in the thrombus considerably longer than in the case where the flow was present. Moreover, the trends in Figure 6 indicate that the tracers have more opportunity to migrate to the shell of the thrombus, because the collision rate for the no-flow case becomes significantly lower with time. This conclusion is also supported by Figure 7, where 3D collision probability (Upper) and time (Lower) “heat” maps are shown for the case of ADP transport in the presence of flow (Left) and without it (Right). From Figure 7, the thrombus core has a significantly higher probability of collisions relative to the thrombus shell in the presence of flow. In the “no flow” case, however, the particles had more opportunity to reach the thrombus shell due to a longer residence time. Similar trends were observed for Ca2+ and FX. The fact that tracers are removed from the thrombus porosity by the lumen flow before they can ever reach the shell, also explains why there is not a significant decrease with time in the rate of collisions for the flow cases in Figure 6.
Figure 7.
Comparison of intra-thrombus diffusive transport of ADP-sized tracers for flow conditions (Left) and no flow conditions (Right). Upper panel is collision probability (i.e., number of collisions at each solid surface node relative to the total number of collisions that occurred in the thrombus during the simulation time), and lower panel is average collision time shown at each surface node locally (grayscale means that no collisions occurred at that particular surface node). In all cases the simulation domain is cut in half along the flow direction in order to show the intra-thrombus environment. One half of the thrombus is shown, with the cut plane facing the reader. The other half is omitted.
Intrathrombus diffusive transport of proteins: Lumen-to-injury release
In order to explore transport of inert solutes from the blood lumen to the injury site, the simulations were repeated with the tracers being released at the inlet of the blood vessel instead of at the injury site. Periodic boundary conditions were applied to the tracer motion in the stream-wise dimension with the aim of mimicking a constant influx of the coagulation factors. Figure 8 is a plot of thrombus tracer concentration ratio relative to that in the bulk lumen after the initial release. All three tracers showed an increase in the thrombus concentration as the released tracers make their initial pass by the blood clot. After the tracers begin to loop around the simulation domain the increase in concentration becomes slower, which was more representative of continuous flow of coagulation factors past the thrombus. In agreement with previous observations, the smaller, more dynamic tracers made their way into the thrombus faster and took less time to reach the final value of 1 for the clot-to-lumen concentration ratio: ~ 0.1 seconds for Ca2+, ~1 second for ADP and ~10 seconds for FX.
Figure 8.
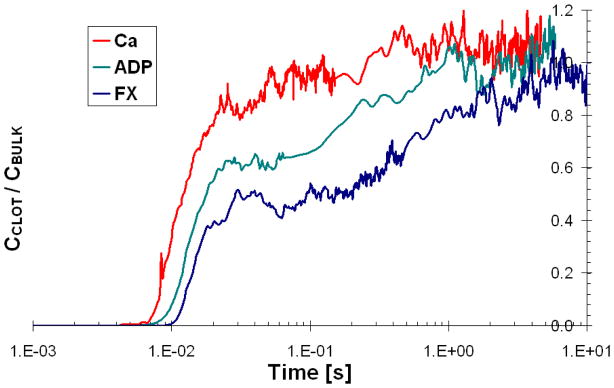
Ratio of tracer concentration in the thrombus to tracer concentration in the lumen, as a function of time and molecular weight.
Intrathrombus diffusive transport of diffusible species: Effect of pore constrictions
Since the thrombus pore walls present barriers to the tracers (even when the pore diameter is much greater than the size of the solute), the effective molecular diffusivity within the clot is reduced. On the other hand, the presence of convective flows within the thrombus can propel the motion of the tracers beyond their diffusive abilities. To compare the interplay between these two opposing effects, the intrathrombic transport results from the LST simulations are summarized in Table 1. The effective diffusivity due to the pore constrictions was measured by modeling tracer transport in the thrombus without flow. From the results in Table 1, the thrombus pores constricted the particle diffusion in the direction of flow, but not dramatically: the effective diffusivity was approximately 50% lower than in a free fluid. This corresponds to a tracer path tortuosity of approximately 2, if the tortuosity is defined as follows:
| (8) |
The tortuosity of the tracer path in the stream-wise direction did not seem to depend on the tracer type significantly, as expected for solutes that are dramatically smaller than the pore diameter. The addition of flow, as expected, enhanced transport within the thrombus. In order to quantify the effect of flow relative to diffusion, we calculated the Peclet number, which is defined as the product of the Reynolds and Schmidt numbers. A characteristic length of 1 μm (from mouse platelet size) was used for the calculation of the intrathrombus Reynolds number. The Peclet number results shown in Table 1 indicate that the molecular transport within the thrombus spans different regimes depending on the tracer type, ranging from roughly equal convective-diffusive contributions for Ca2+ to predominately convective for FX-sized proteins.
CONCLUSIONS
The intra-thrombus fluid dynamics simulation results showed that the shell experiences higher flows, stresses and is significantly more permeable than the core. At the same time, the Brownian transport results suggest that under normal physiological flow conditions molecules originating from the damaged endothelium would not be able to reach the shell prior to exiting the thrombus. Thus, it can be hypothesized that the contributing reasons for the shell-and-core structure of the thrombus could be: a) mechanical - the cell bonds in the shell are not sufficient for platelet activation, and/or b) chemical – platelet agonists from the injury do not reach the shell. Furthermore, the observed differences in the Intrathrombus transport environment could have implications for design of drugs that target either the core or the shell preferentially. The latter would be especially relevant for anti-clotting drug applications, since the shell is responsible for most of the embolism and, yet, does not seem to serve a biological purpose. Thus, the ability to dissolve it selectively, while keeping the core intact, would pave way for anti-clotting therapies that do not increase the risk of bleeding. Finally, we hope that this work will help to advocate the use of experiments and simulations coupled via imaging for future studies, as it guarantees a realistic thrombus structure and could be easily extended to other systems (e.g. aggregate formation in in-vitro microfluidics devices using human blood10).
Supplementary Material
Acknowledgments
We acknowledge financial support from NIH R01-HL103419 and AHA 11POST6890012 grants. Computation was carried under TERAGRID supercomputing allocation TG-IBN110004 on the Lonestar linux cluster (Texas Advanced Computing Center). We would also like to acknowledge Dr. Papavassiliou’s Computational Transport Processes laboratory at the University of Oklahoma, since a considerable portion of the code used in this study was written as a part of a PhD dissertation there. Finally, we would like to thank Dr. Henry J. Neeman, Dr. Raghu Reddy and the whole OU Supercomputing Center for Education & Research (OSCER) team for useful discussions and suggestions.
References
- 1.Agard DA, Hiraoka Y, Shaw P, Sedat JW. Fluorescence microscopy in 3 dimensions. Method Cell Biol. 1989;30:353–77. doi: 10.1016/s0091-679x(08)60986-3. [DOI] [PubMed] [Google Scholar]
- 2.Barber CB, Dobkin DP, Huhdanpaa H. The quickhull algorithm for convex hulls. Acm T Math Software. 1996;22(4):469–83. [Google Scholar]
- 3.Bellido-Martin L, Chen V, Jasuja R, Furie B, Furie BC. Imaging fibrin formation and platelet and endothelial cell activation in vivo. Thromb Haemost. 2011;105(5):776–82. doi: 10.1160/TH10-12-0771. [DOI] [PubMed] [Google Scholar]
- 4.Bhatnagar PL, Gross EP, Krook M. A model for collision processes in gases.1. Small amplitude processes in charged and neutral one-component systems. Physical Review. 1954;94(3):511–25. [Google Scholar]
- 5.Borders JL, Granger HJ. An optical doppler intravital velocimeter. Microvasc Res. 1984;27(1):117–27. doi: 10.1016/0026-2862(84)90047-5. [DOI] [PubMed] [Google Scholar]
- 6.Boyd J, Buick J, Green S. A second-order accurate lattice boltzmann non-newtonian flow model. Journal of Physics a-Mathematical and General. 2006;39(46):14241–7. [Google Scholar]
- 7.Brass LF, Wannemacher KM, Ma P, Stalker TJ. Regulating thrombus growth and stability to achieve an optimal response to injury. J Thromb Haemost. 2011;9(s1):66–75. doi: 10.1111/j.1538-7836.2011.04364.x. [DOI] [PMC free article] [PubMed] [Google Scholar]
- 8.Brinkman HC. A calculation of the viscous force exerted by a flowing fluid on a dense swarm of particles. Appl Sci Res. 1947;1(1):27–34. [Google Scholar]
- 9.Chen S, Doolen GD. Lattice boltzmann method for fluid flows. Annual Review of Fluid Mechanics. 1998;30:329–64. [Google Scholar]
- 10.Colace T, Falls E, Zheng XL, Diamond SL. Analysis of morphology of platelet aggregates formed on collagen under laminar blood flow. Annals of Biomedical Engineering. 2011;39(2):922–9. doi: 10.1007/s10439-010-0182-4. [DOI] [PubMed] [Google Scholar]
- 11.Comerford A, Plank MJ, David T. Endothelial nitric oxide synthase and calcium production in arterial geometries: An integrated fluid mechanics/cell model. J Biomech Eng-T Asme. 2008;130(1) doi: 10.1115/1.2838026. [DOI] [PubMed] [Google Scholar]
- 12.Cosgrove JA, Buick JM, Tonge SJ, Munro CG, Greated CA, Campbell DM. Application of the lattice boltzmann method to transition in oscillatory channel flow. Journal of Physics a-Mathematical and General. 2003;36(10):2609–20. [Google Scholar]
- 13.Davis MJ. Determination of volumetric flow in capillary tubes using an optical doppler-velocimeter. Microvasc Res. 1987;34(2):223–30. doi: 10.1016/0026-2862(87)90055-0. [DOI] [PubMed] [Google Scholar]
- 14.Desjardins C, Duling BR. Microvessel hematocrit - measurement and implications for capillary oxygen-transport. Am J Physiol. 1987;252(3):H494–H503. doi: 10.1152/ajpheart.1987.252.3.H494. [DOI] [PubMed] [Google Scholar]
- 15.Einstein A. The motion of elements suspended in static liquids as claimed in the molecular kinetic theory of heat. Annalen Der Physik. 1905;17(8):549–60. [Google Scholar]
- 16.Falati S, Gross P, Merrill-Skoloff G, Furie BC, Furie B. Real-time in vivo imaging of platelets, tissue factor and fibrin during arterial thrombus formation in the mouse. Nat Med. 2002;8(10):1175–81. doi: 10.1038/nm782. [DOI] [PubMed] [Google Scholar]
- 17.Gabbanelli S, Drazer G, Koplik J. Lattice boltzmann method for non-newtonian (power-law) fluids. Physical Review E. 2005;72(4):046312–7. doi: 10.1103/PhysRevE.72.046312. [DOI] [PubMed] [Google Scholar]
- 18.Granger DN, Benoit JN, Suzuki M, Grisham MB. Leukocyte adherence to venular endothelium during ischemia-reperfusion. American Journal of Physiology. 1989;257(5):G683–G8. doi: 10.1152/ajpgi.1989.257.5.G683. [DOI] [PubMed] [Google Scholar]
- 19.Holme PA, Orvim U, Hamers MJAG, Solum NO, Brosstad FR, Barstad RM, Sakariassen KS. Shear-induced platelet activation and platelet microparticle formation at blood flow conditions as in arteries with a severe stenosis. Arterioscl Throm Vas. 1997;17(4):646–53. doi: 10.1161/01.atv.17.4.646. [DOI] [PubMed] [Google Scholar]
- 20.Kandhai D, Koponen A, Hoekstra AG, Kataja M, Timonen J, Sloot PMA. Lattice-boltzmann hydrodynamics on parallel systems. Computer Physics Communications. 1998;111(1–3):14–26. [Google Scholar]
- 21.Kim MB, Sarelius IH. Distributions of wall shear stress in venular convergences of mouse cremaster muscle. Microcirculation. 2003;10(2):167–78. doi: 10.1038/sj.mn.7800182. [DOI] [PubMed] [Google Scholar]
- 22.Levine HA, McGee MP, Serna S. Diffusion and reaction in the cell glycocalyx and the extracellular matrix. J Math Biol. 2010;60(1):1–26. doi: 10.1007/s00285-009-0254-y. [DOI] [PubMed] [Google Scholar]
- 23.Lipowsky HH. Microvascular rheology and hemodynamics. Microcirculation. 2005;12(1):5–15. doi: 10.1080/10739680590894966. [DOI] [PubMed] [Google Scholar]
- 24.Lipowsky HH, Kovalcheck S, Zweifach BW. Distribution of blood rheological parameters in microvasculature of cat mesentery. Circ Res. 1978;43(5):738–49. doi: 10.1161/01.res.43.5.738. [DOI] [PubMed] [Google Scholar]
- 25.Matsumoto M, Nishimura T. Mersenne twister: A 623-dimensionally equidistributed uniform pseudo-random number generator. ACM Transactions on Modeling and Computer Simulation (TOMACS) 1998;8(1):3–30. [Google Scholar]
- 26.Merrill EW, Pelletie GA. Viscosity of human blood - transition from newtonian to non-newtonian. J Appl Physiol. 1967;23(2):178–82. doi: 10.1152/jappl.1967.23.2.178. [DOI] [PubMed] [Google Scholar]
- 27.Nesbitt WS, Westein E, Tovar-Lopez FJ, Tolouei E, Mitchell A, Fu J, Carberry J, Fouras A, Jackson SP. A shear gradient-dependent platelet aggregation mechanism drives thrombus formation. Nat Med. 2009;15(6):665–U146. doi: 10.1038/nm.1955. [DOI] [PubMed] [Google Scholar]
- 28.Papavassiliou DV. Turbulent transport from continuous sources at the wall of a channel. International Journal of Heat and Mass Transfer. 2002;45(17):3571–83. [Google Scholar]
- 29.Papavassiliou DV, Hanratty TJ. The use of lagrangian-methods to describe turbulent transport of heat from a wall. Industrial & Engineering Chemistry Research. 1995;34(10):3359–67. [Google Scholar]
- 30.Porter B, Zauel R, Stockman H, Guldberg R, Fyhrie D. 3-d computational modeling of media flow through scaffolds in a perfusion bioreactor. Journal of Biomechanics. 2005;38(3):543–9. doi: 10.1016/j.jbiomech.2004.04.011. [DOI] [PubMed] [Google Scholar]
- 31.Qian YH, Dhumieres D, Lallemand P. Lattice bgk models for navier-stokes equation. Europhysics Letters. 1992;17(6):479–84. [Google Scholar]
- 32.Sakariassen KS, Holme PA, Orvim U, Barstad RM, Solum NO, Brosstad FR. Shear-induced platelet activation and platelet microparticle formation in native human blood. Thromb Res. 1998;92(6):S33–S41. doi: 10.1016/s0049-3848(98)00158-3. [DOI] [PubMed] [Google Scholar]
- 33.Skartsis L, Kardos JL, Khomami B. Resin flow through fiber beds during composite manufacturing processes.1. Review of newtonian flow through fiber beds. Polymer Engineering and Science. 1992;32(4):221–30. [Google Scholar]
- 34.Stalker TJ, Traxler EA, Wu J, Wannemacher KM, Cermignano SL, Voronov RS, Diamond SL, Brass LF. Hierarchical organization in the hemostatic response and its relationship to the platelet signaling network. Blood. 2012 doi: 10.1182/blood-2012-09-457739. blood-2012-09-457739; published ahead of print January 9, 2013. [DOI] [PMC free article] [PubMed] [Google Scholar]
- 35.Succi S. The lattice boltzmann equation for fluid dynamics and beyond. New York: Clarendon Press; Oxford University Press; 2001. [Google Scholar]
- 36.Sukop MC, Thorne DT NetLibrary Inc. Lattice boltzmann modeling an introduction for geoscientists and engineers. ix. Berlin; New York: Springer; 2006. p. 172. [Google Scholar]
- 37.Swift MR, Orlandini E, Osborn WR, Yeomans JM. Lattice boltzmann simulations of liquid-gas and binary fluid systems. Physical Review E. 1996;54(5):5041–52. doi: 10.1103/physreve.54.5041. [DOI] [PubMed] [Google Scholar]
- 38.VanGordon S, Voronov RS, Blue TB, Shambaugh RL, Papavassiliou DV, Sikavitsas VI. Effects of scaffold architecture on preosteoblastic cultures under continuous fluid shear. Industrial & Engineering Chemistry Research. 2010;50(2):620–9. [Google Scholar]
- 39.Wang JY, Zhang XX, Bengough AG, Crawford JW. Domain-decomposition method for parallel lattice boltzmann simulation of incompressible flow in porous media. Physical Review E. 2005;72(1):016706–11. doi: 10.1103/PhysRevE.72.016706. [DOI] [PubMed] [Google Scholar]
- 40.Wang WW, King MR. Multiscale modeling of platelet adhesion and thrombus growth. Annals of Biomedical Engineering. 2012;40(11):2345–54. doi: 10.1007/s10439-012-0558-8. [DOI] [PubMed] [Google Scholar]
- 41.Windberger U, Bartholovitsch A, Plasenzotti R, Korak KJ, Heinze G. Whole blood viscosity, plasma viscosity and erythrocyte aggregation in nine mammalian species: Reference values and comparison of data. Exp Physiol. 2003;88(3):431–40. doi: 10.1113/eph8802496. [DOI] [PubMed] [Google Scholar]
- 42.Xu ZL, Chen N, Shadden SC, Marsden JE, Kamocka MM, Rosen ED, Alber M. Study of blood flow impact on growth of thrombi using a multiscale model. Soft Matter. 2009;5(4):769–79. [Google Scholar]
- 43.Yoshino A, Hotta Y, Hirozane T, Endo M. A numerical method for incompressible non-newtonian fluid flows based on the lattice boltzmann method. Journal of Non-Newtonian Fluid Mechanics. 2007;147(1–2):69–78. [Google Scholar]
Associated Data
This section collects any data citations, data availability statements, or supplementary materials included in this article.


